Multi-Lane Graphical User Interface System and Method

a user interface and multi-lane technology, applied in the field of multi-lane graphical user interface system and method, can solve the problems of ineffective continuous improvement, inability to sustain continuous improvement, and story can become muddled with uncertainty

Inactive Publication Date: 2022-03-17
PULSE-IQ INC
View PDF3 Cites 3 Cited by
  • Summary
  • Abstract
  • Description
  • Claims
  • Application Information

AI Technical Summary

Benefits of technology

[0486]We created an Artificial Intelligence model to choose the best donors to target in marketing campaigns. The AI model ranks all the donors by their predicted ROI and the list would be chosen manually from a spreadsheet based on an estimated breakeven cost. Since then, we have improved the model by incorporating the strategy lanes in order to create an improved User Interface which the user interacts with to create their marketing list from the model. The invention we are focusing on is the improvement in order to create a better UI. This new UI enables the user to harness the power of an AI model quicker, easier, and with more customization. The outcome of using this new UI is better marketing results (higher Net Income and greater donor file health) that are easier to come by than was ever possible by using an AI model without this UI.
[0568]In FIG. 75, The ability to plan future campaigns is invaluable when creating a budget. Predictive provides users with associated costs and Net Income that can be gained from future campaigns. Pulse Predictive enables users to quickly review all the decisions that were made in their historical campaigns as well as to plan future campaigns. It is useful to gauge past campaigns in one view as the knowledge from successes and failures is used to plan future campaigns. The tool allows users to visually see any donor blocks within each strategy that are not being mailed and mail those so that all past donors are being touched at least once throughout the year. Once all future months are added, the AI will provide an estimated summary for Number Mailed, Costs, Net Income, and ROI so that organizations are able to smartly plan their marketing and budgeting activities.FIG. 75 contains these elements:

Problems solved by technology

This fosters a cycle of continual improvement that cannot be sustained without clear insights into performance.
If the data is not accurate or is difficult to comprehend and produce insights from, then this continual improvement cannot be effectively achieved.
This can be difficult when they do not have the resources in order to manipulate their Customer Relationship Management (CRM) data in a database to unveil Key Performance Indicators (KPIs).
Then they would have to know what KPIs to create, this can be difficult for they can easily focus on KPIs that are not important and leave out other very important KPIs.
Due to the sheer number of metrics they can choose, the story can become muddled with uncertainty.

Method used


Image

  • Multi-Lane Graphical User Interface System and Method
  • Multi-Lane Graphical User Interface System and Method
  • Multi-Lane Graphical User Interface System and Method

Examples


Embodiment Construction
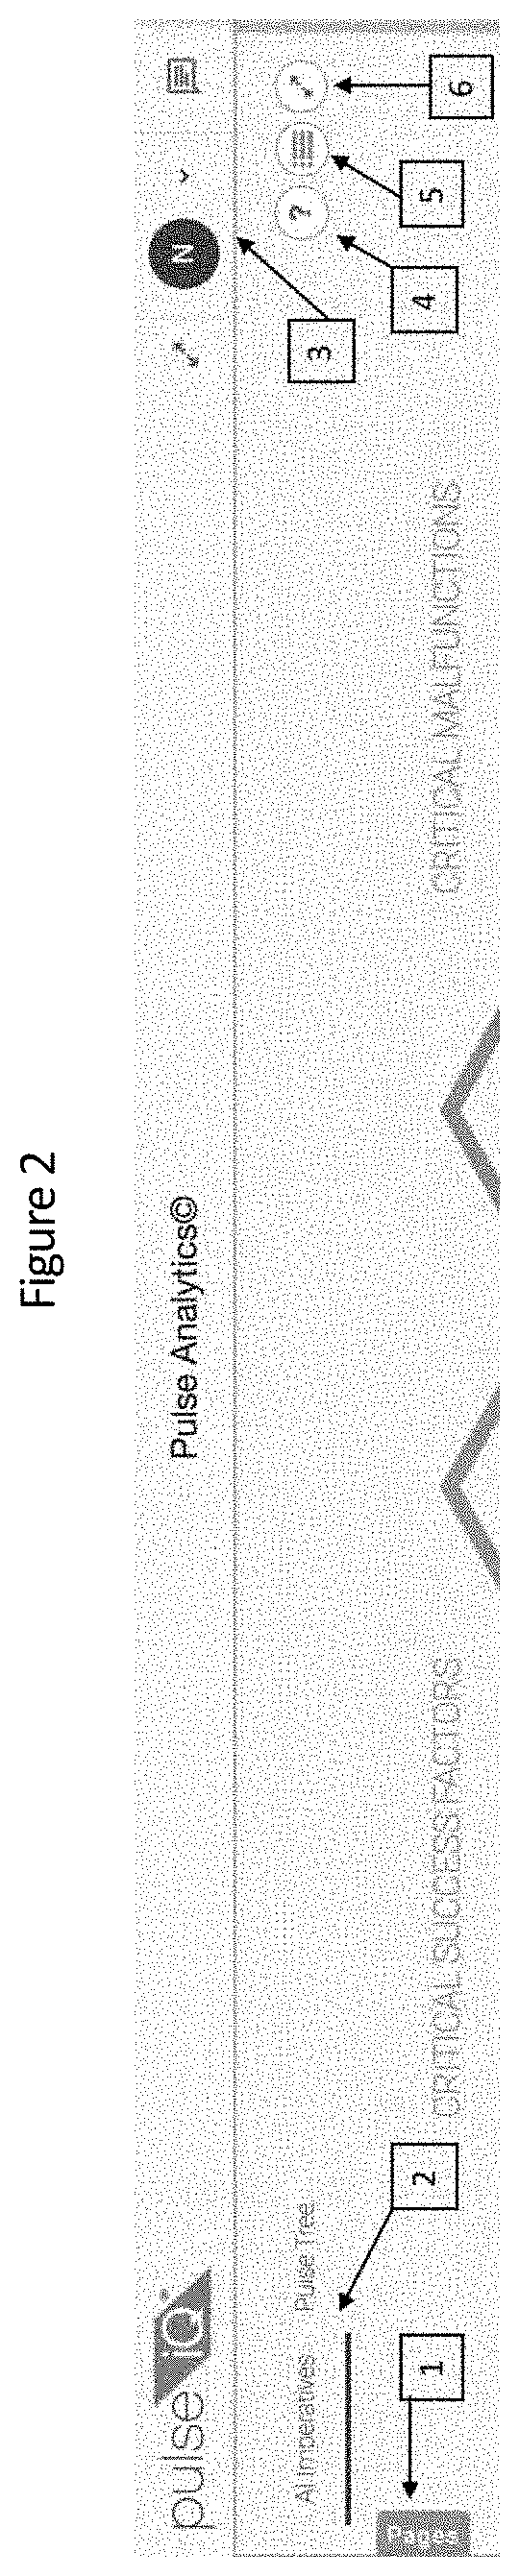
Pulse Analytics

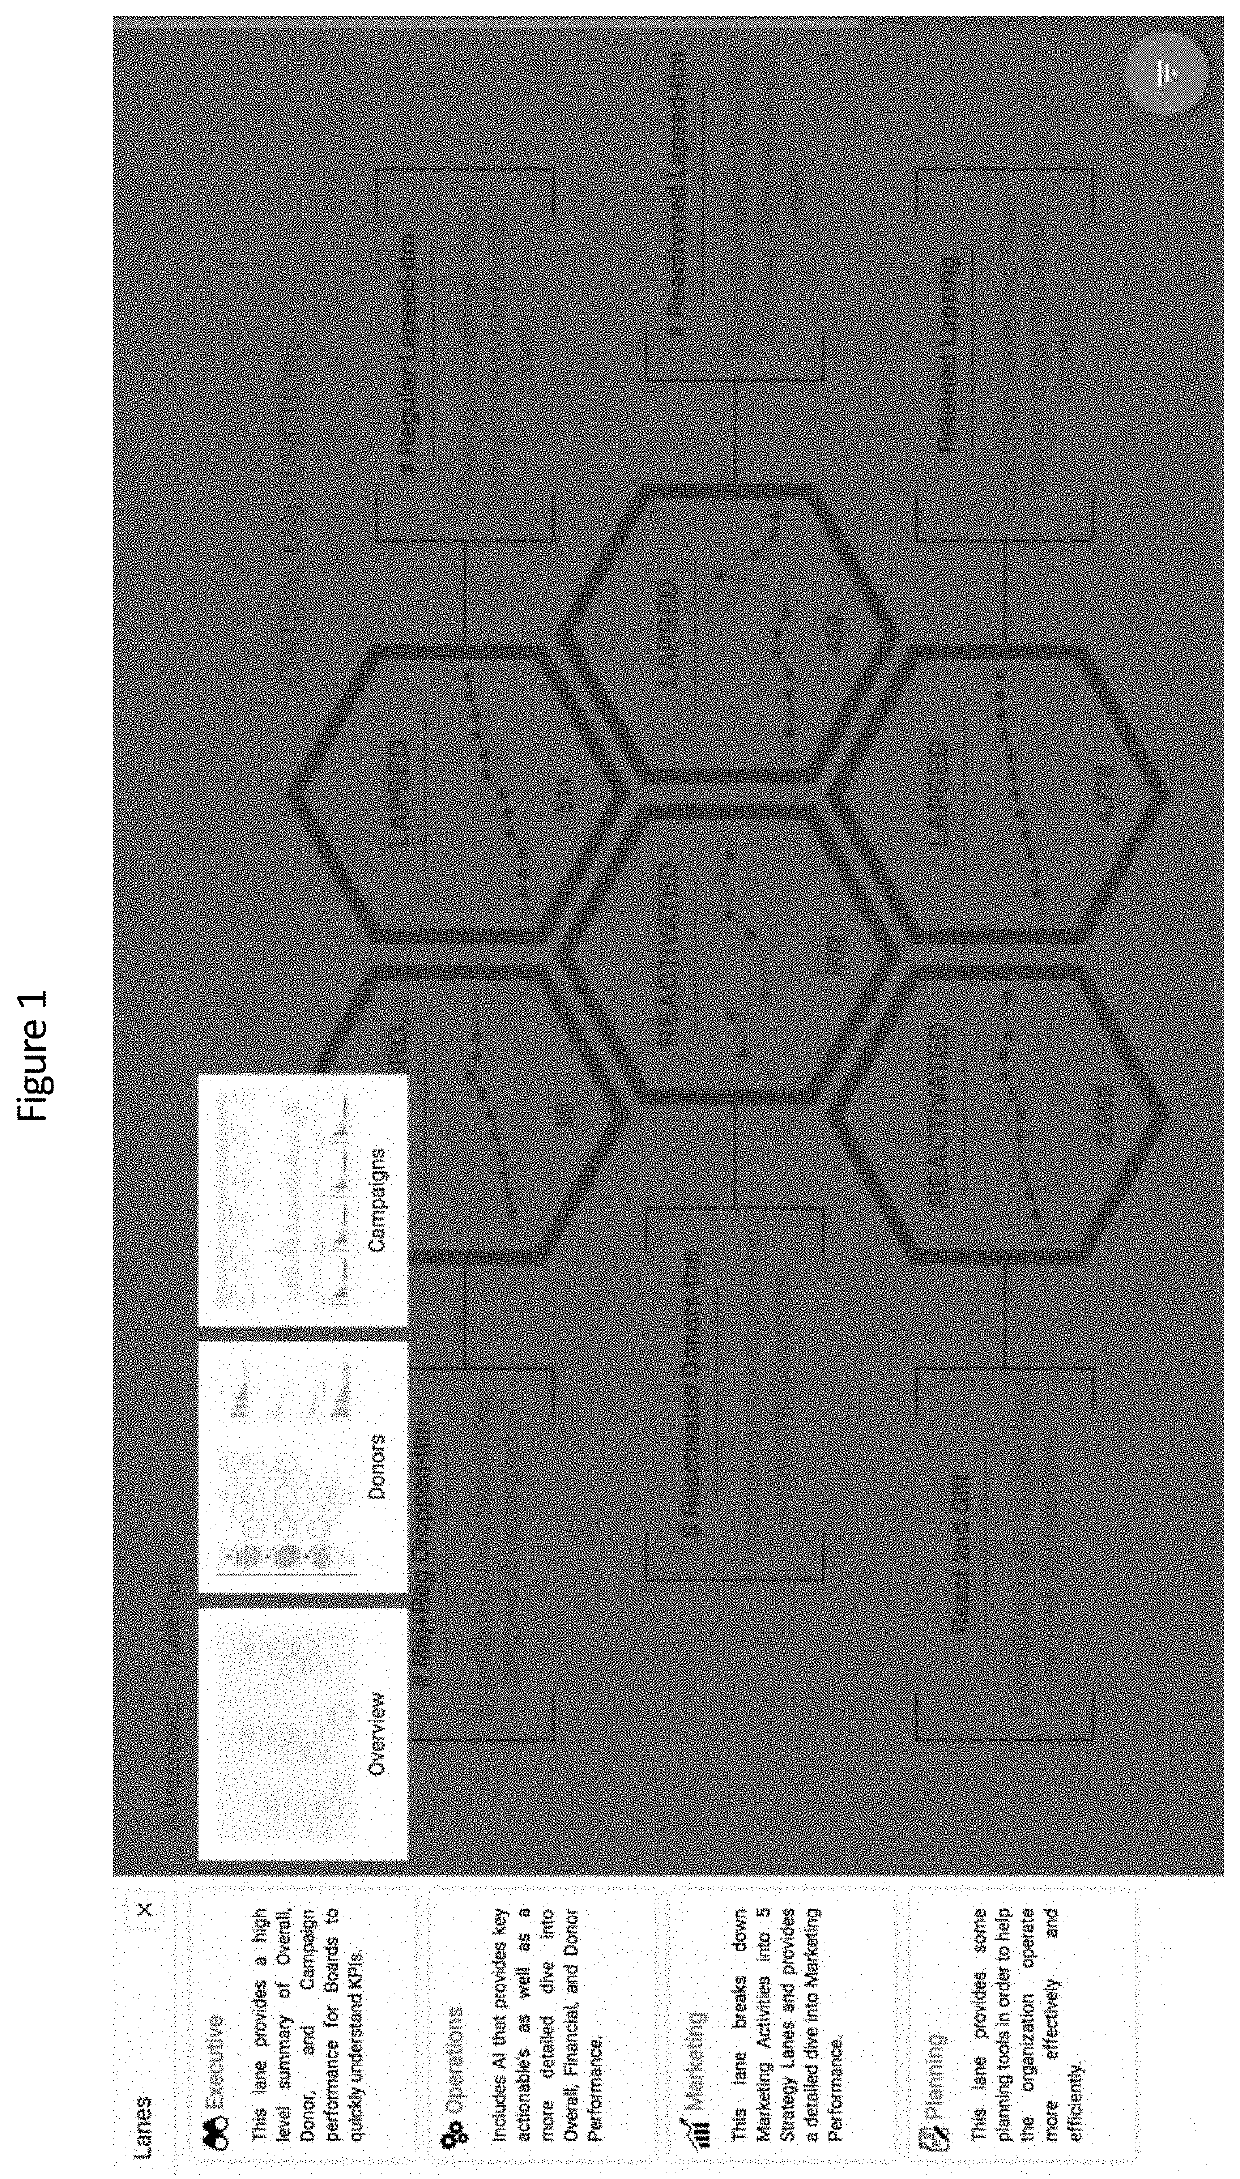
[0084]We remove all work from the customers side and provide an online dashboard where they can login and immediately understand what is important, and then have the ability to dive deeper to see the full picture. We have spent thousands of hours working with the data to design unique methods of framing the organizations performance around the limitations of the computer device screen. See FIG. 1.

[0085]We have divided the Dashboard into three lanes. Each lane has three pages and within each page can be multiple tabs. The Executive Lane provides a high-level summary of Overall, Donor, and Campaign performance for Boards to quickly understand KPIs. The Operations Lane showcases our AI that tells organizations which KPIs are improving and which KPIs are worsening the financial performance the most. This lane also provides a more detailed analysis into overall, financial, and donor performance. The marketing lane showcases our Strategy Lanes which breaks down marketing in...


PUM


Abstract

A system and method are presented showing an improved computer user interface and a method for constructing that interface.

Description

BACKGROUND OF THE INVENTION[0001]All organizations who perform marketing activities have a need to monitor the performance of those activities as well as the overall financial performance of the organization. This is the first step in working towards long term operational optimization. Once they accurately understand the current state of their performance then they can begin to plan what to do next in order to improve. If they can accurately monitor these marketing activities that they undertake, then they can understand whether their strategies are working or it they need to pivot and try something new.[0002]This fosters a cycle of continual improvement that cannot be sustained without clear insights into performance. If the data is not accurate or is difficult to comprehend and produce insights from, then this continual improvement cannot be effectively achieved. Therefore, it is imperative for an organization that performs marketing activities to have access to their data in a fo...

Claims


Application Information

Patent Timeline
Patent Type & Authority Applications(United States)
IPC IPC(8): G06F3/0483G06F3/0482G06F3/0481G06Q10/06G06Q30/02
CPCG06F3/0483G06F3/0482G06Q30/0201G06Q10/0637G06F3/04817G06F3/0481
Inventor RASSAMNI, JERRYRASSAMNI, NATHANIEL JAMES
Owner PULSE-IQ INC
Why Eureka
Try Eureka