Eureka AIR delivers breakthrough ideas for toughest innovation challenges, trusted by R&D personnel around the world.

Method, system, and computer program product for visualizing a data structure

Inactive Publication Date: 2001-10-09
RPX CORP +1
View PDF62 Cites 501 Cited by
  • Summary
  • Abstract
  • Description
  • Claims
  • Application Information

AI Technical Summary

Problems solved by technology

It is a classical problem in many statistical texts.
Neural networks have an arcane structure which is difficult to visualize.
Classification without an explanation reduces the trust a user has in the system.
Some researchers have found that physicians would reject a system that gave insufficient explanation even if the model had good accuracy.
A deficiency common to these related methods of displaying multi-dimensional data is that only a single static scene is used to convey information.
This limits the amount of information which can be shown in a conventional visualization.
Visualizations of complex decision table classifiers with many attributes and many cells cannot be effectively done in a single static scene.
For example, a single static scene is limited to two or three levels of detail before the display gets too large or the cells become too small to be useful.
Thus, the attempts to visualize decision table classifiers have resulted in confusing displays where the user has difficulty in seeing the information he or she desires.
In addition, conventional attempts to visualize decision table classifiers do not provide navigation capability or drill down features.
Finally, the attempts to visualize decision table classifiers do not provide user interaction with the visualized classifiers.
The knowledge contained in these models is hidden, however, without an effective way to convey it to users.
However, decision tables can have a very large number of cells at the lowest level.
Even so, the size is usually far too great to deal with interactively in real time if every cell is to be rendered.
Even building such a scene can take a prohibitively long time.
The data set can often times contain an extremely large amount of raw data.
The visualization does not perform well if one axis has many more values than its pair at a given level.
However, in practice, building a scene graph corresponding to every level of detail of the data structure can take an enormous amount of time even with the fastest of computer processors.
Since there are over 8000 records in this set, running an inducer might take several minutes.
Unfortunately, if that were done the text would obscure other objects or be too small to read.
It is often impractical to display everything in a static scene and have it be comprehensible.
Surprisingly, there are three male wives and one female husband (indicating a possible data quality problem).
Because most records in this data set are labeled race="white," it is difficult to discern what values give evidence for other races.
Such a scene graph would take hours to construct, even using the fastest available graphics processor.
If a stub is encountered during drill down, it alerts the computer system that a geometry has not been created for what the user desires to view.
Otherwise, by displaying all the paths simultaneously, the user would be inundated with a great deal of information, making the prediction sought much more difficult.
Moreover, the time it would take to construct the entire scene graph at one time would be enormous, even with the most sophisticated of computer systems.
The value of the improvement to the accuracy may decrease as the size of the training set increases (this is a case of diminishing returns).
More attributes mean more combinations for the decision table inducer to compute, making the problem more difficult for the inducer and requiring more time.
If future records come from a distribution different from that of the training set, the accuracy will probably be low.
For example, if a user builds a classifier to predict something from a training set containing family cars, it may not be useful to classify records containing many sport cars because the distribution of attributes can be very different.
This method is fast, but since it uses only two-thirds of the data for building the classifier, it does not make efficient use of the data for learning.
A user can increase or decrease k. Reducing it to 3 or 5 shortens the running time, however, estimates are likely to be biased pessimistically because of the smaller training set sizes.
Limiting the number of nodes speeds up the induction process and limits the storage required.
Although restricting the size can decrease the run time, it may increase the error rate.
If the accuracy estimate varies appreciably, the induction process is not stable.

Method used


Image

  • Method, system, and computer program product for visualizing a data structure
  • Method, system, and computer program product for visualizing a data structure
  • Method, system, and computer program product for visualizing a data structure

Examples


example 2

B. Salary Factors

For a data set of working adults, a user may choose the following query: what factors affect salary. Using the method of the present invention, a user can first bin gross_income into two bins, those that earn less that 50,000, and those earning over 50,000. Then, the user can run a MineSet.TM. classifier to help determine what factors influence salary. The file / usr / lib / MineSet / dtabviz / examples / adult-salary-dtab.dtableviz shows the decision table classifier induced for this query. This file was generated by running the inducer on / usr / lib / MineSet / data / adult.schema with gross_income divided into five bins using user-specified thresholds.

Since the "salary" label is numeric, a continuous spectrum is used to assign colors to each class. Also the classes in the probability pane on the right are not sorted by slice size because they have a numeric order. A color, such as red can be assigned to the highest bin (50,000+).

The two attributes chosen at the top level of the de...

example 3

C. Breast Cancer Diagnosis

The breast cancer data set contains information about females undergoing breast cancer diagnosis. Each record represents a patient with attributes such as cell size, lump thickness, and marginal adhesion. The query (label) is whether the diagnosis is malignant or benign. The file / usr / lib / MineSet / dtableviz / examples / breast-dtab.diableviz shows the structure of the Decision Table Classifier induced for this problem. This file was generated by running the inducer on / usr / lib / MineSet / data / breast.schema.

In the decision table classifier visualizer, mitosis and uniformity of cell shape are shown at the top of the decision table hierarchy. If both attributes have low values at the same time the given sample is 99% likely to be benign. On the other hand, 100% of the training records that had high values for both, were malignant.

When a user drills-down on the four cake, that are ambiguous, the attributes marginal adhesion and bare-nuclei are used to discriminate. Th...


PUM


Abstract

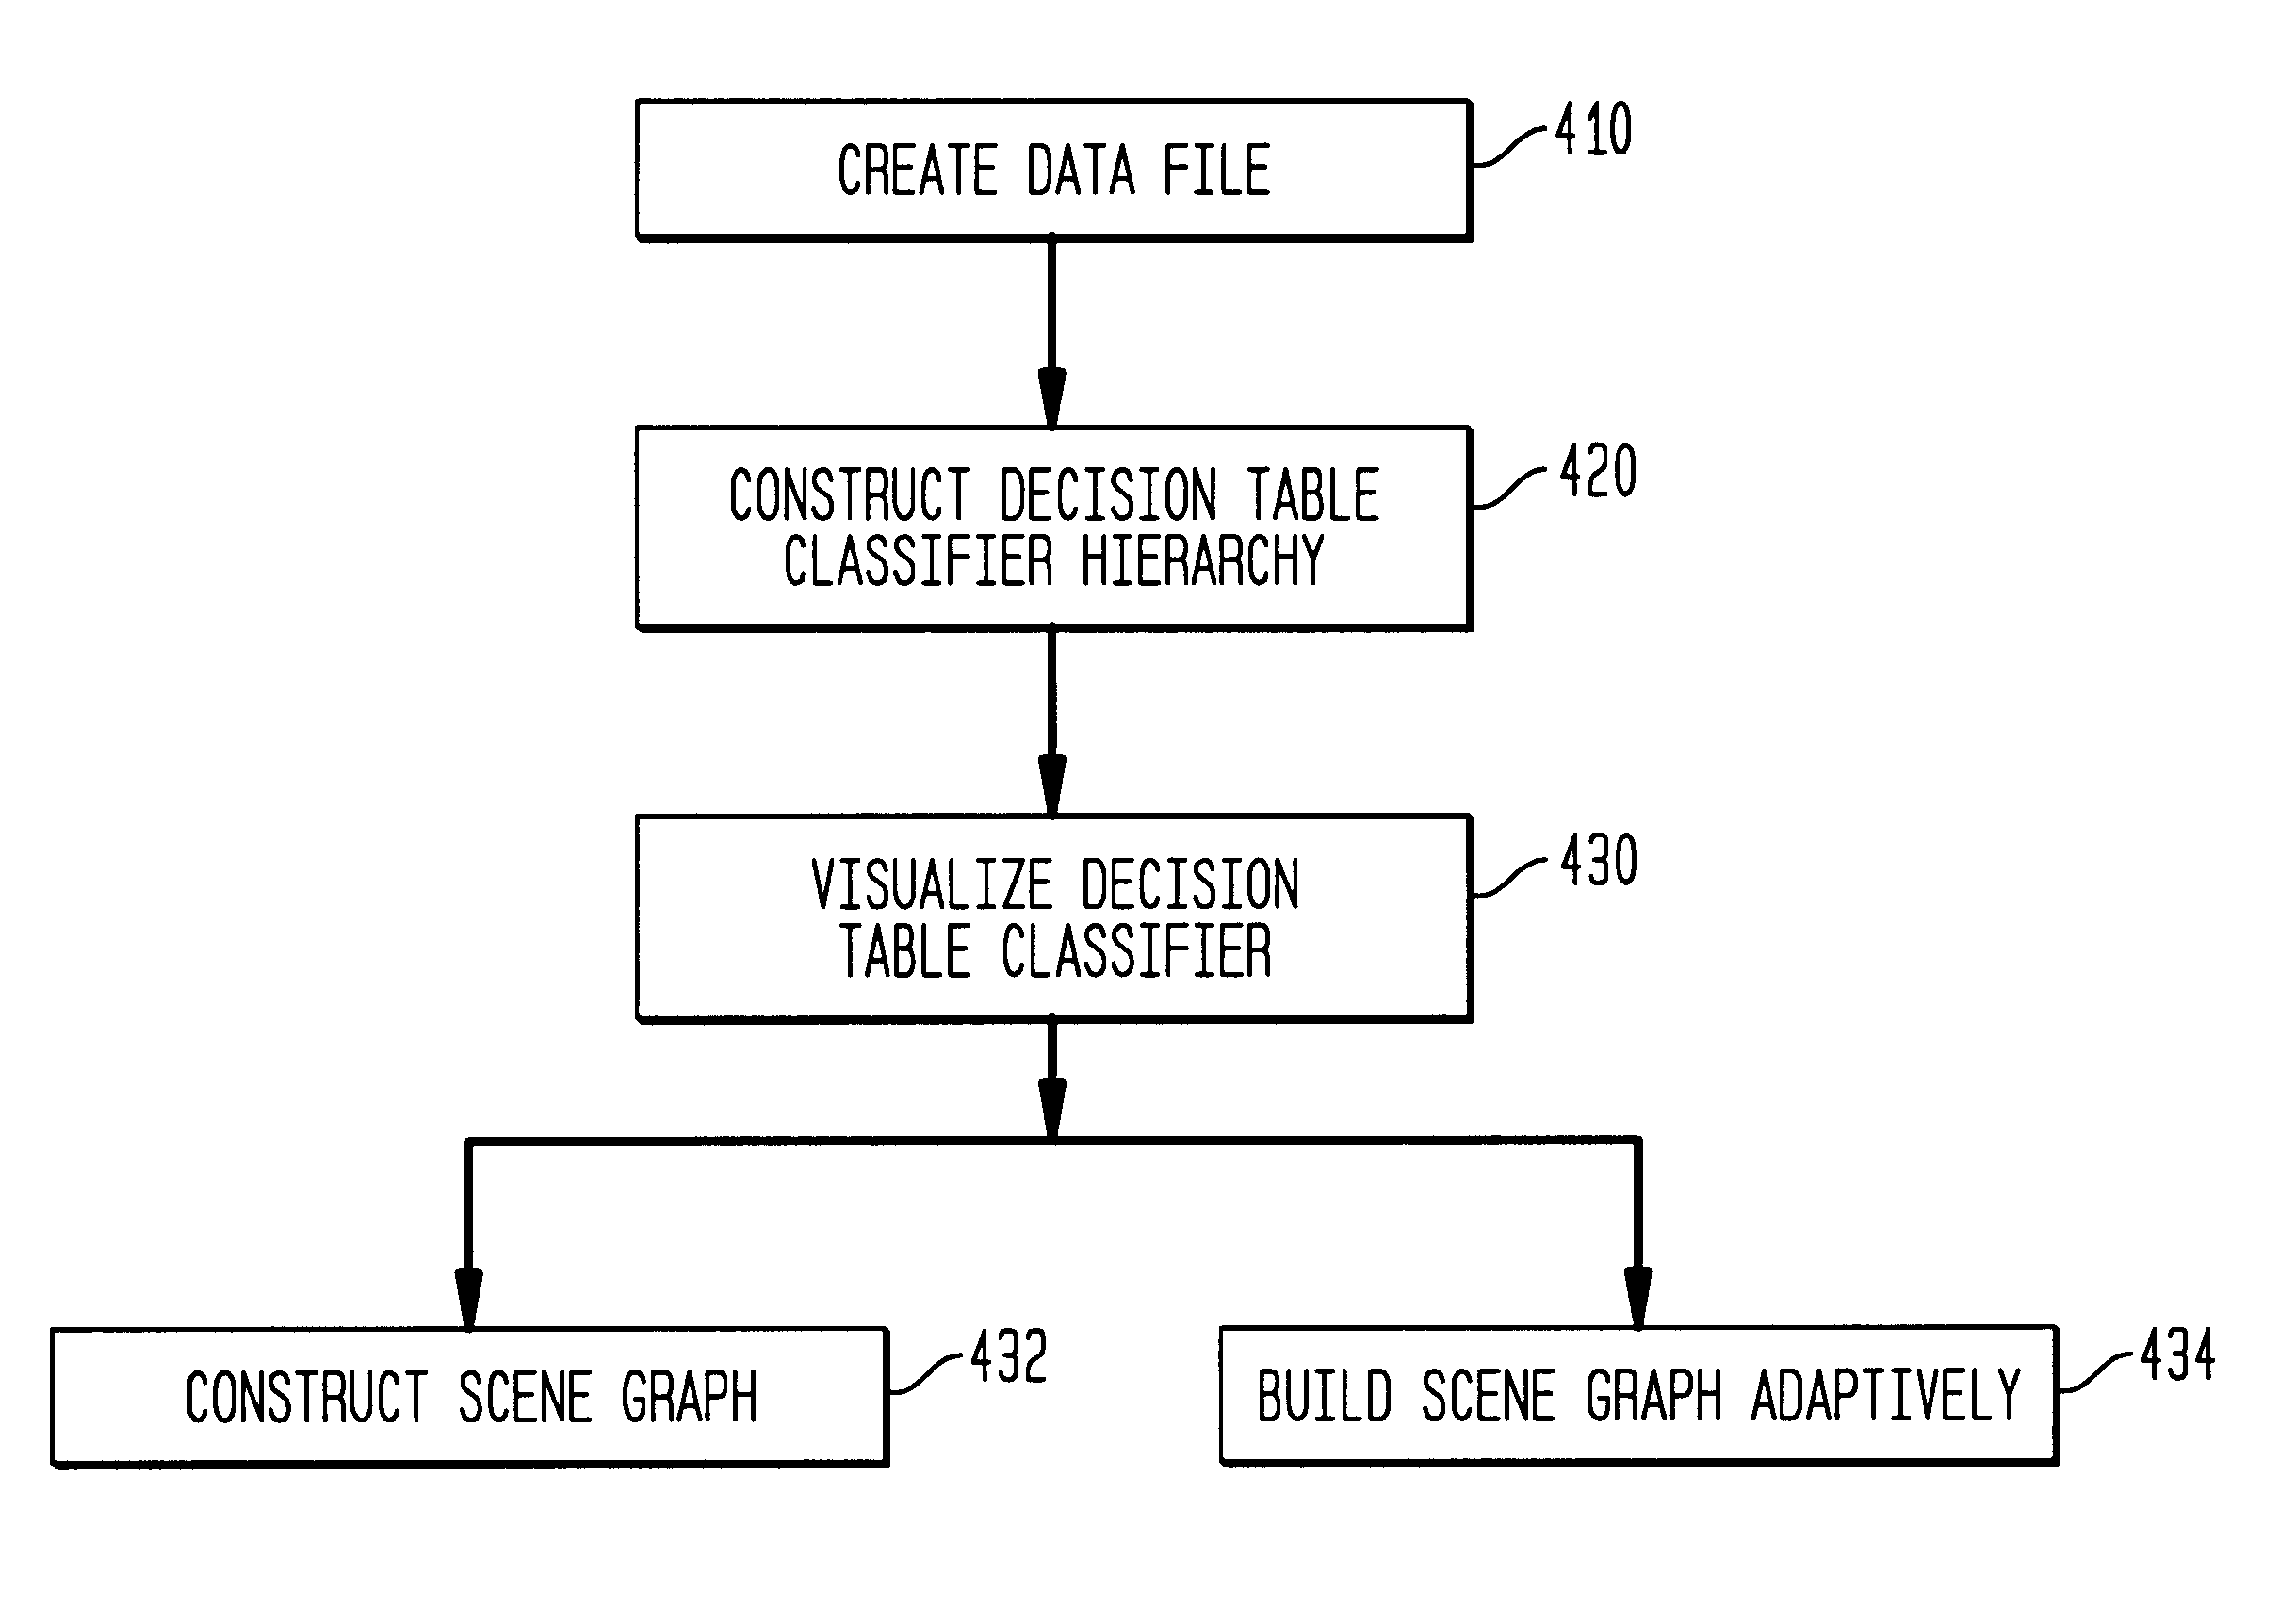
A data structure visualization tool visualizes a data structure such as a decision table classifier. A data file based on a data set of relational data is stored as a relational table, where each row represents an aggregate of all the records for each combination of values of the attributes used. Once loaded into memory, an inducer is used to construct a hierarchy of levels, called a decision table classifier, where each successive level in the hierarchy has two fewer attributes. Besides a column for each attribute, there is a column for the record count (or more generally, sum of record weights), and a column containing a vector of probabilities (each probability gives the proportion of records in each class). Finally, at the top-most level, a single row represents all the data. The decision table classifier is then passed to the visualization tool for display and the decision table classifier is visualized. By building a representative scene graph adaptively, the visualization application never loads the whole data set into memory. Interactive techniques, such as drill-down and drill-through are used view further levels of detail or to retrieve some subset of the original data. The decision table visualizer helps a user understand the importance of specific attribute values for classification.

Description

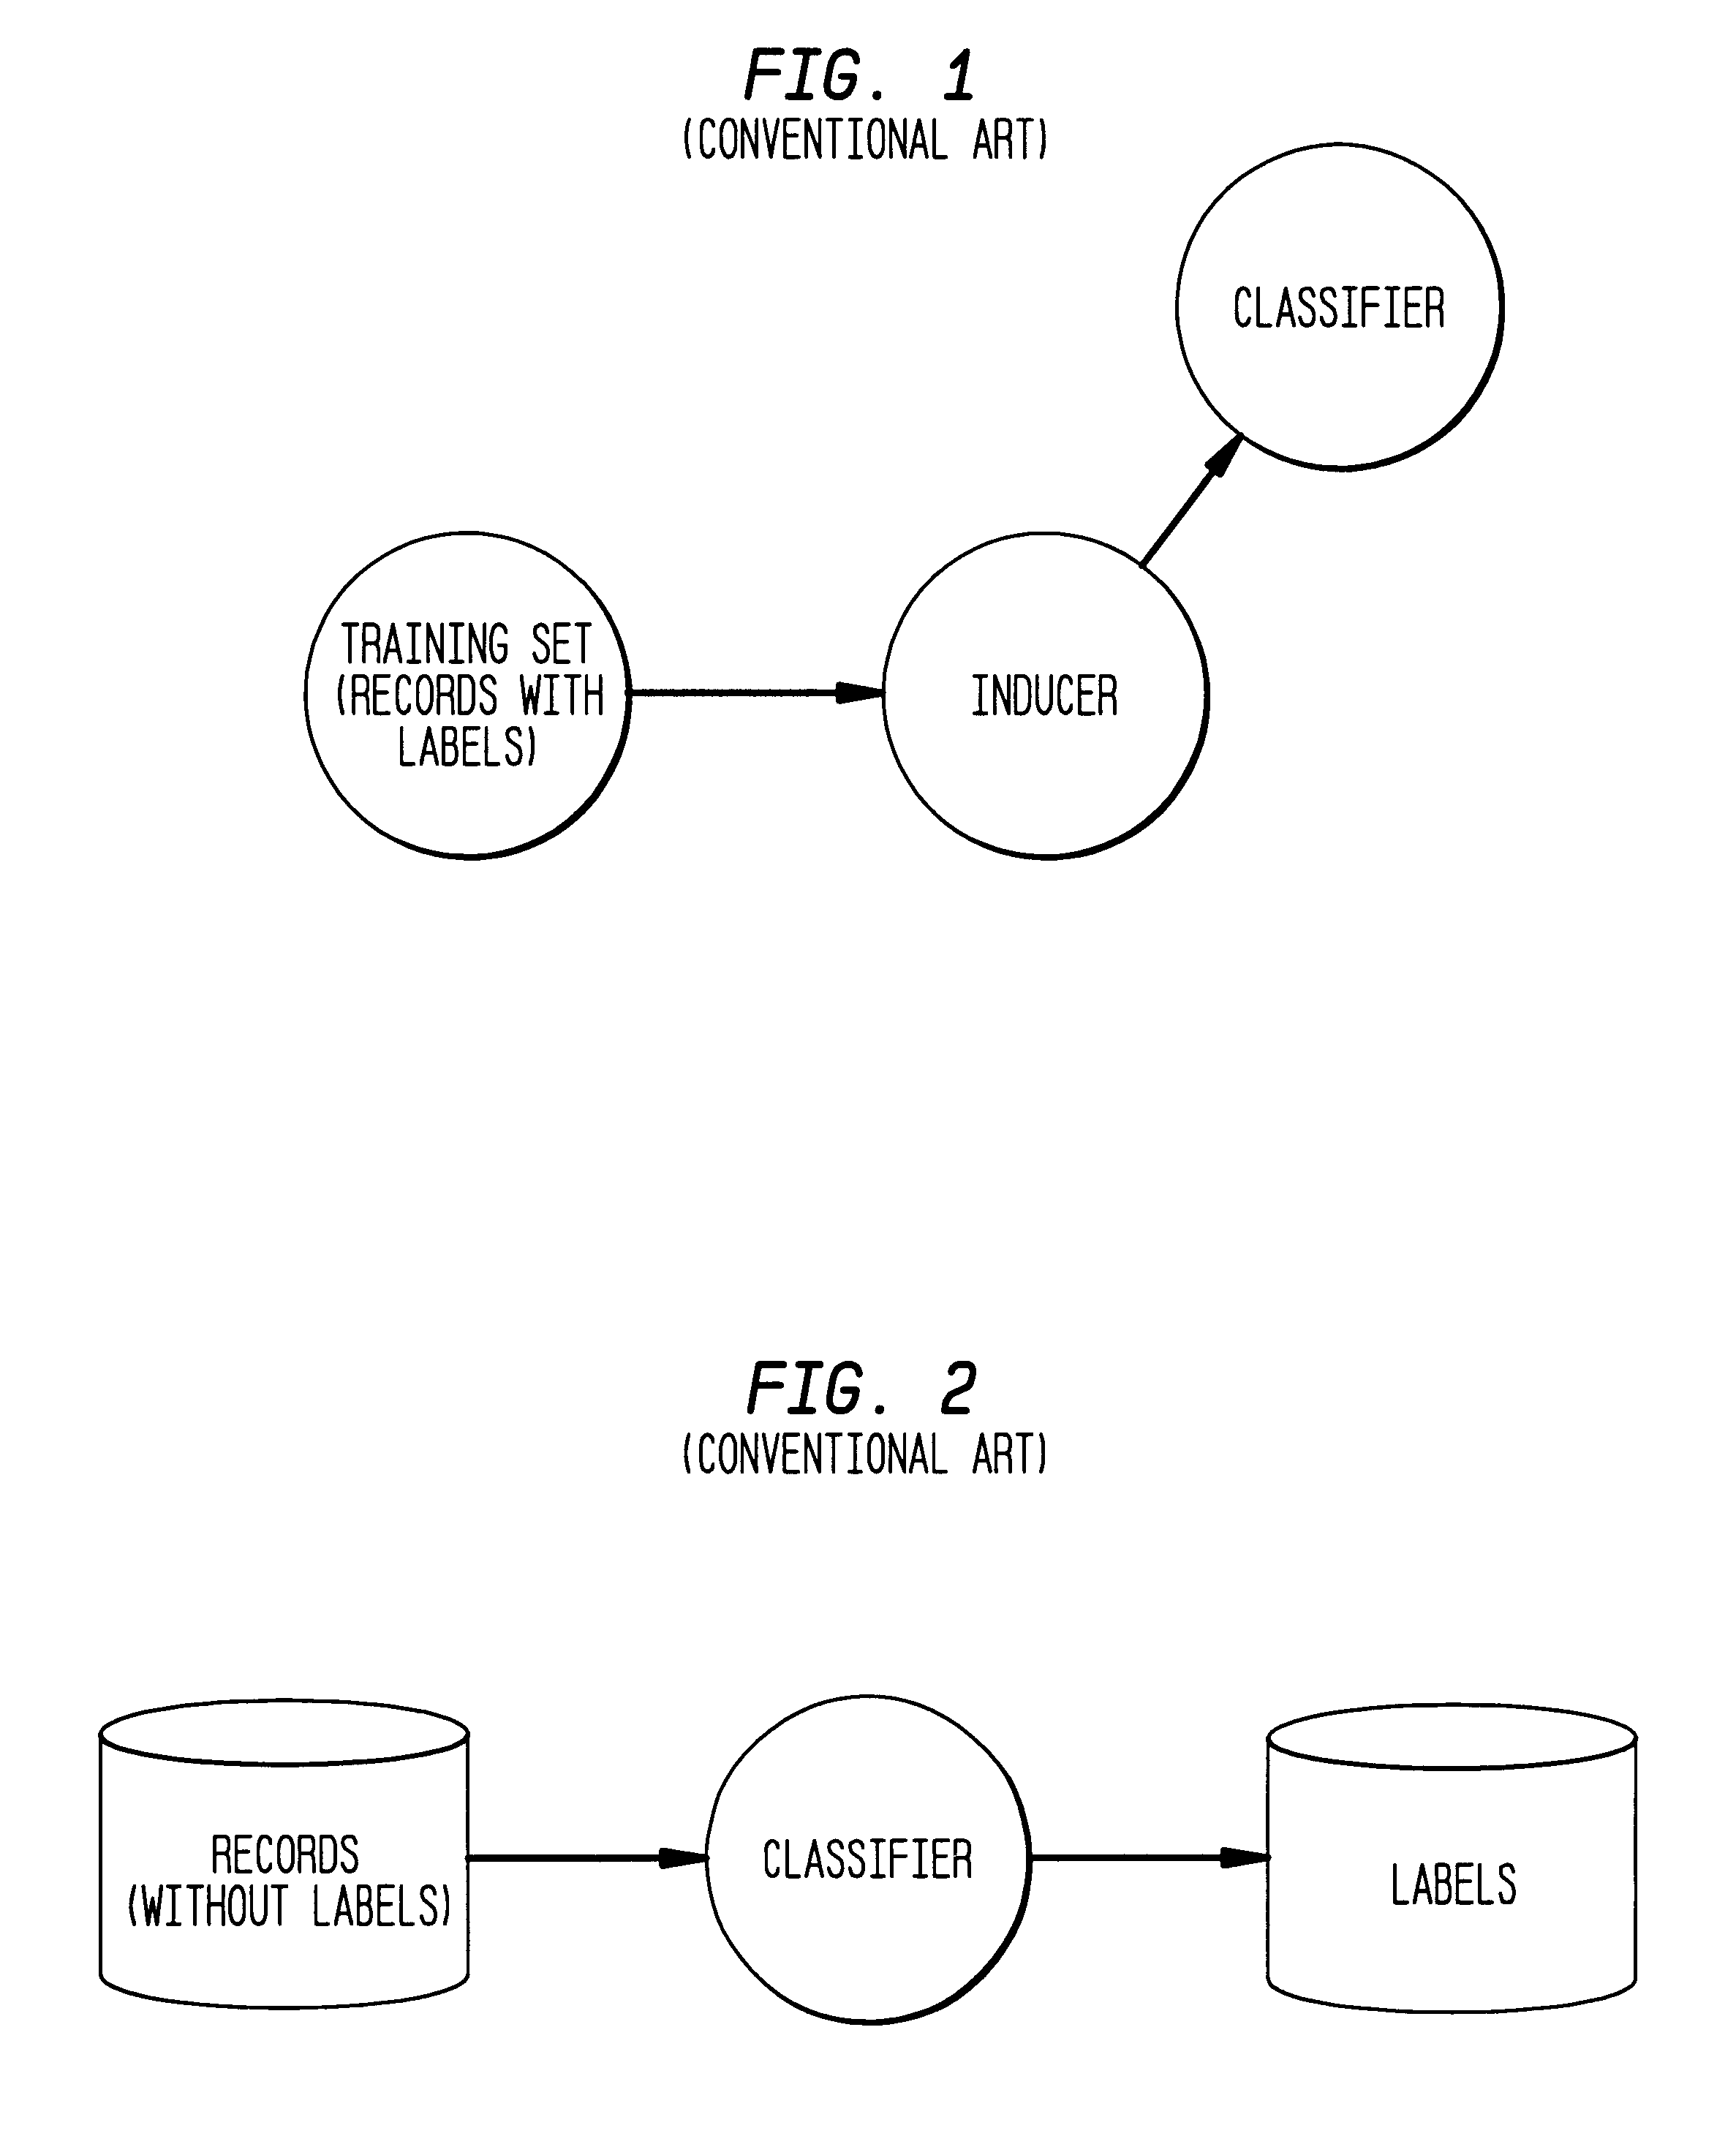
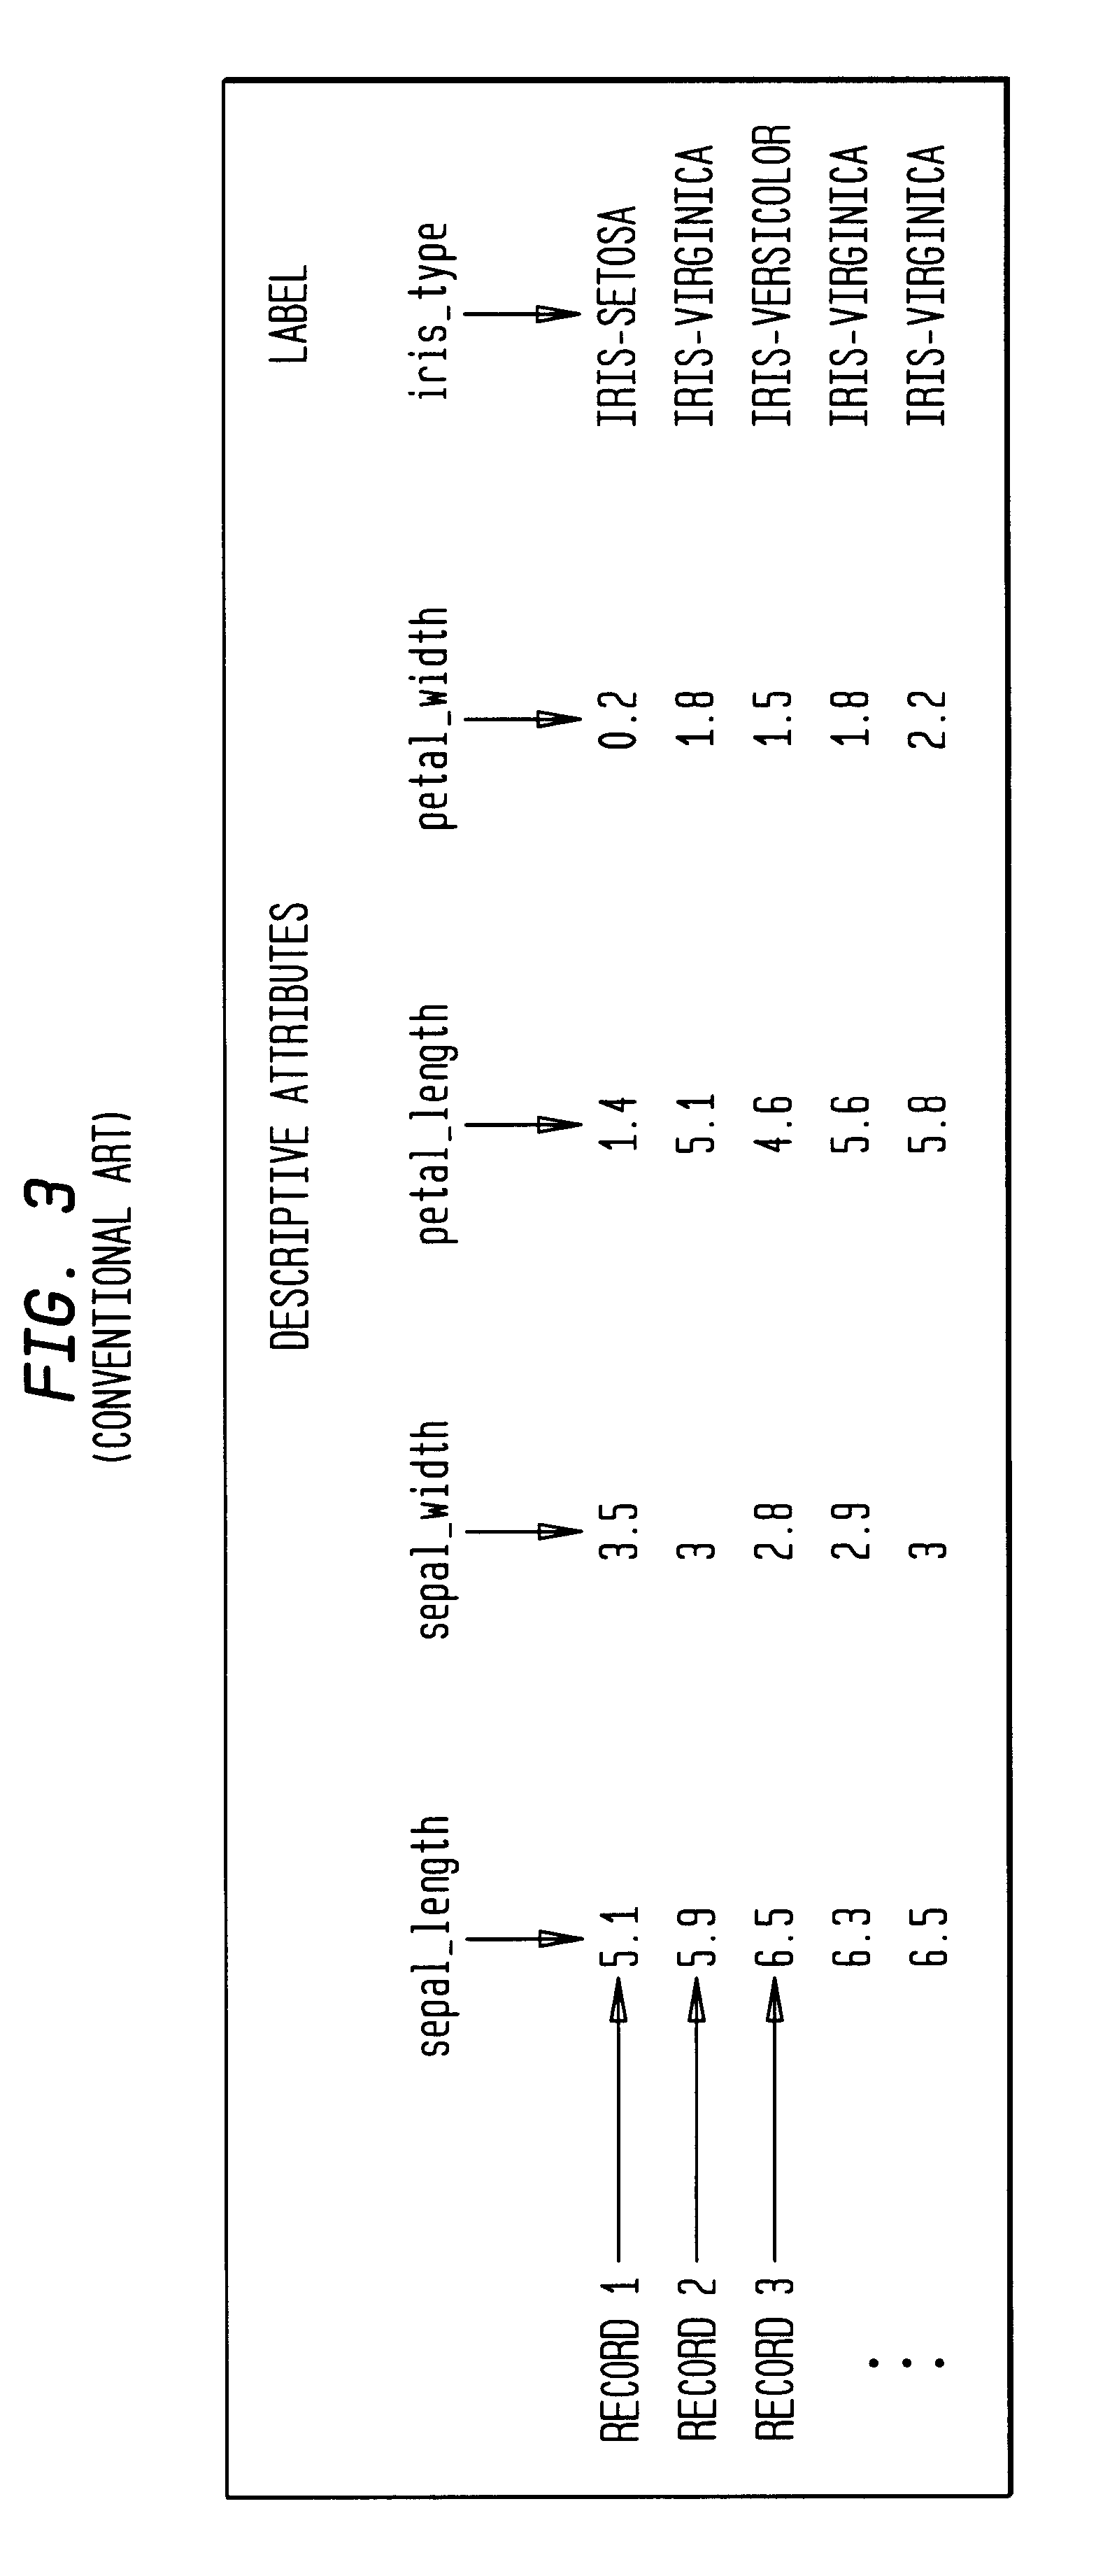
1. Field of the InventionThe present invention relates generally to machine learning, data mining, and data structure visualization.2. Related ArtIn supervised classification learning, an induction algorithm (or inducer) produces a model from a labeled set of training data. For example, many data mining tasks require classification of data into classes. Typically, a classifier classifies data into classes. The classifier provides a function that maps (classifies) a data item (instance) into one of several predefined classes (labels). The resulting classification model is capable of predicting labels for a new set of unlabeled records that have the same attributes as the training data. The attribute being predicted is called the label, and the attributes used for prediction are called the descriptive attributes. The word attribute is also used here to refer to a column in a relational data set. Thus, given a data set of labeled instances, supervised machine learning algorithms seek a...

Claims


Application Information

Patent Timeline
IPC IPC(8): G06F17/30
CPCG06F17/30592G06F17/30601Y10S707/99943Y10S707/99945G06F16/287G06F16/283
Inventor BECKER, BARRY G.
Owner RPX CORP
Why Eureka
Eureka Blog
Learn More