

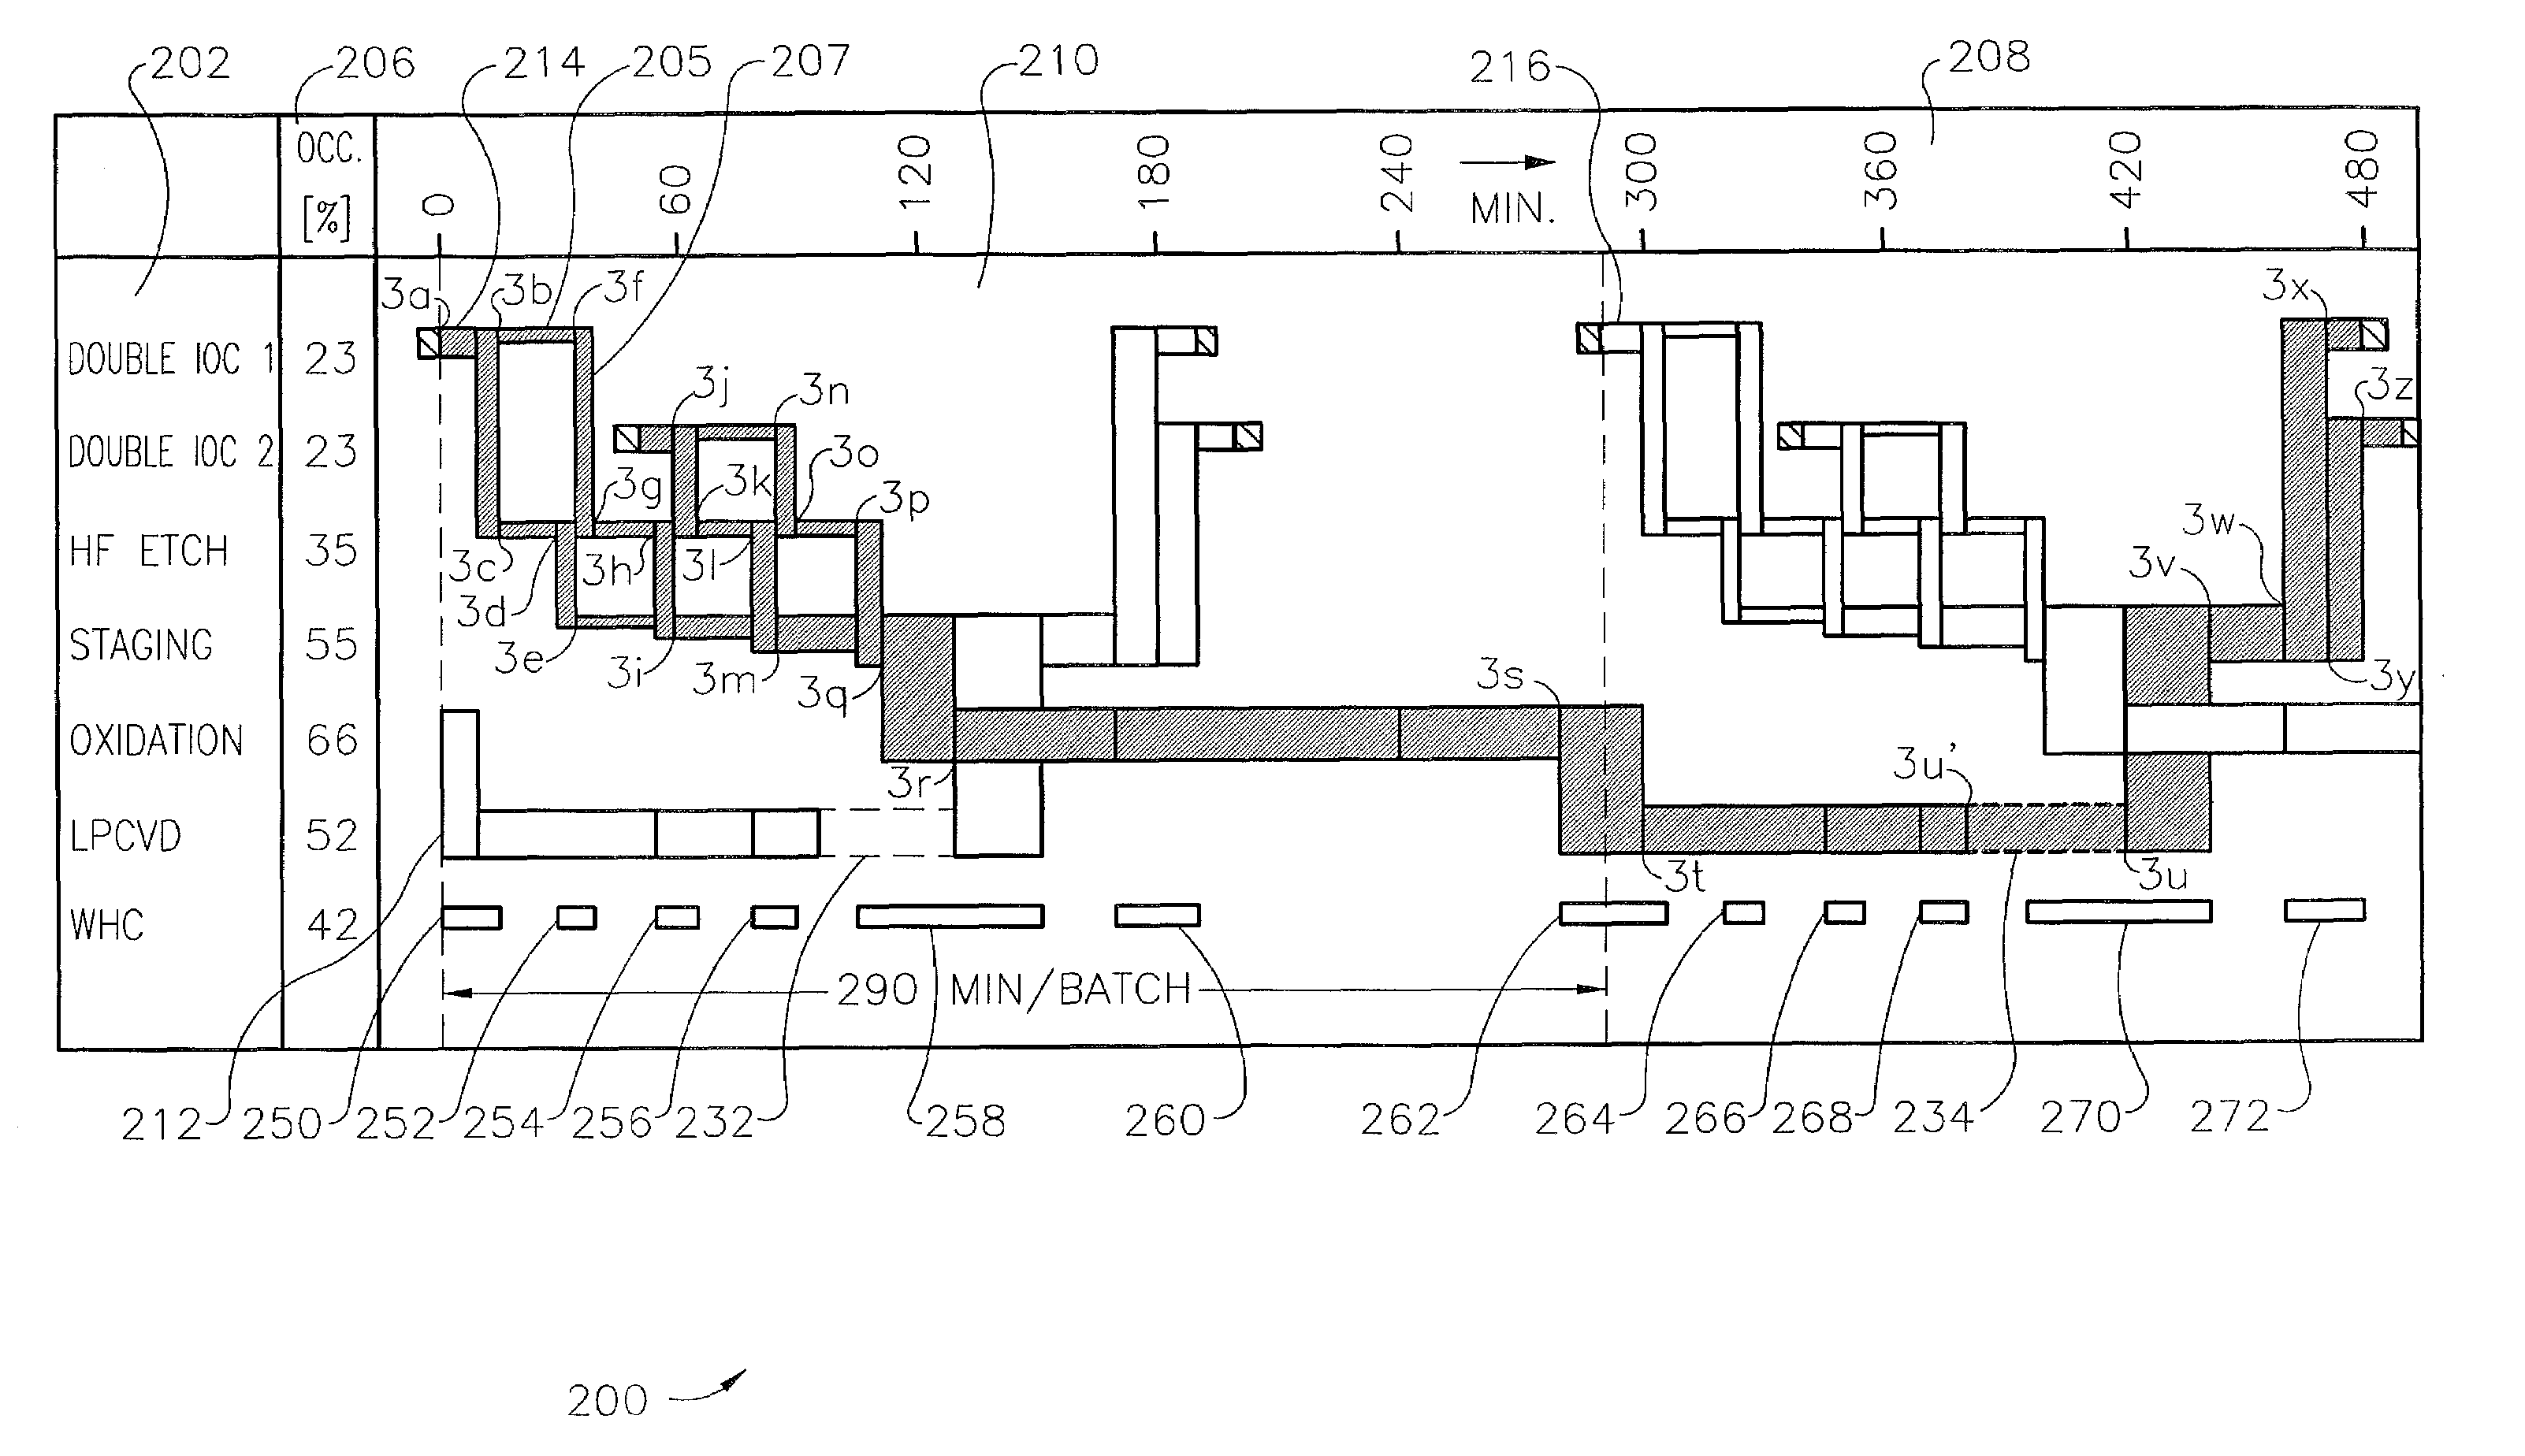
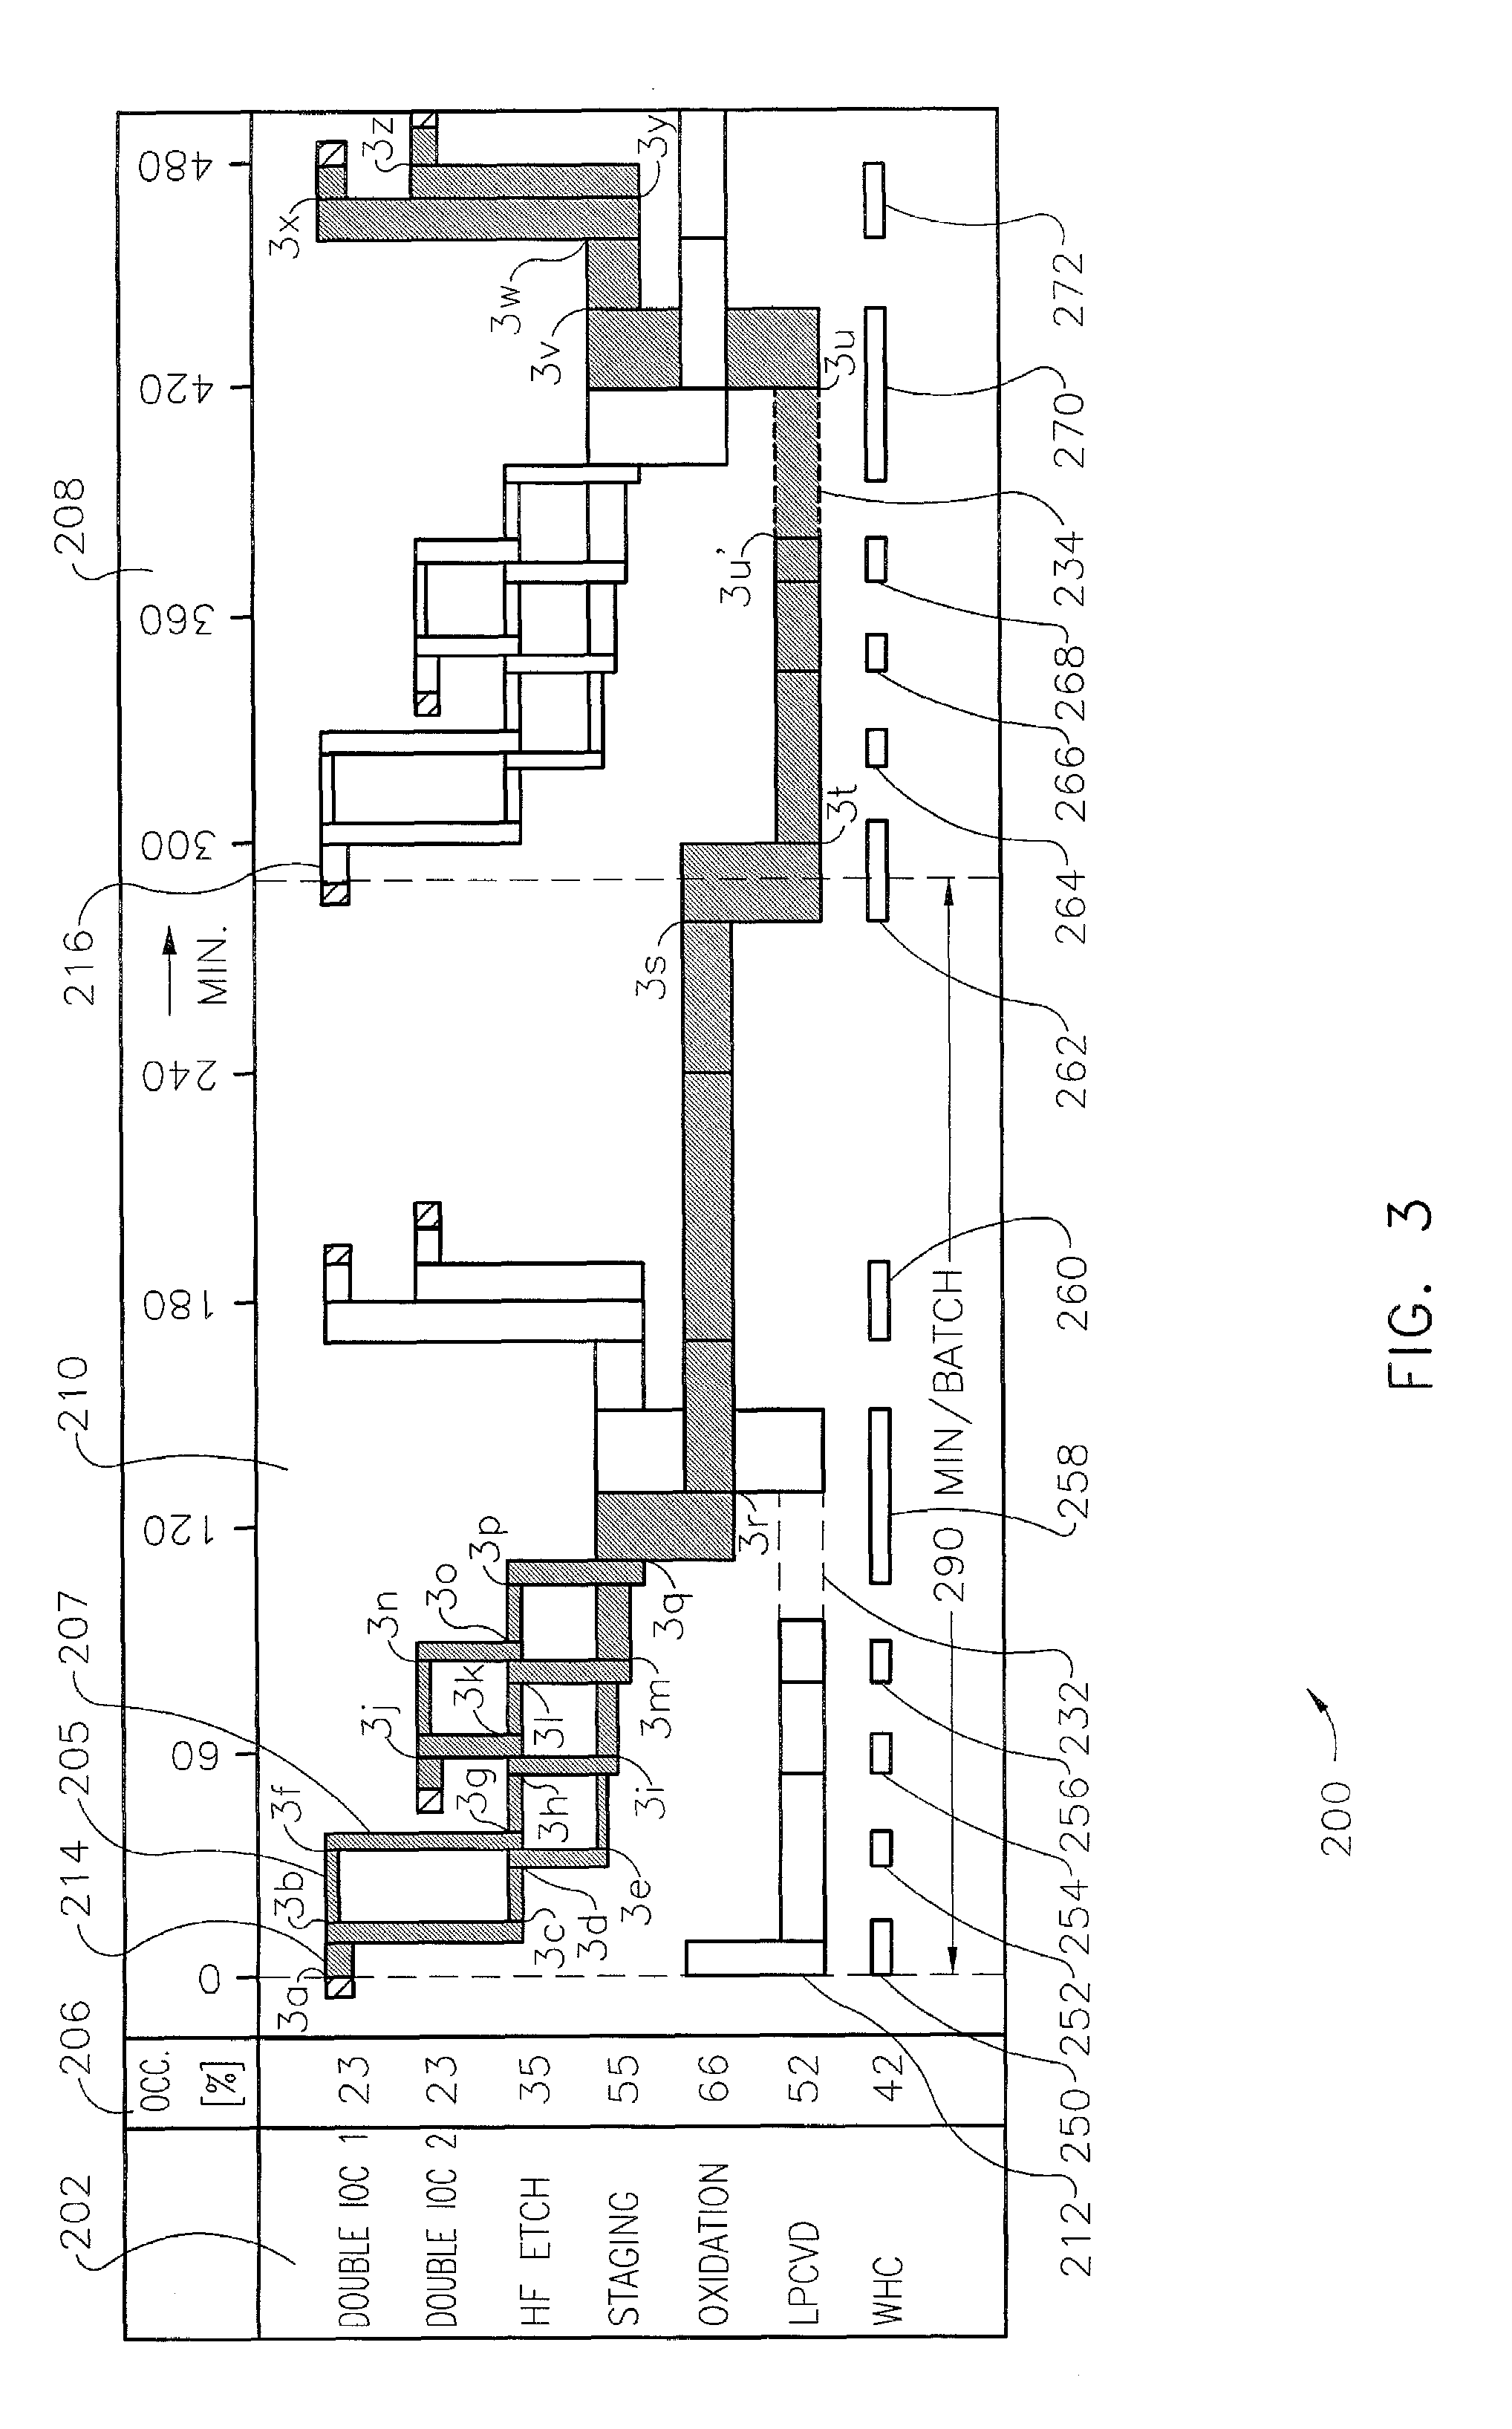
Graphical representation of a wafer processing process
a processing process and graphical representation technology, applied in image data processing, pile separation, programme control, etc., can solve the problems of difficult to see which process station the wafer is at, no information involving plant processes provided, and no simple way to use simulated data
- Summary
- Abstract
- Description
- Claims
- Application Information
AI Technical Summary
Benefits of technology
Problems solved by technology
Method used
Image

Examples
Embodiment Construction
[0017]A method of the present invention includes a method to display data from a system in which one or more work pieces undergo different processing steps in a number of different processing stations. The method can be used in any one of a number of systems where work pieces are processed in different processing stations. The example presented in the following figures are for illustrative purposes only and are not intended to limit the application of the present invention to such examples.
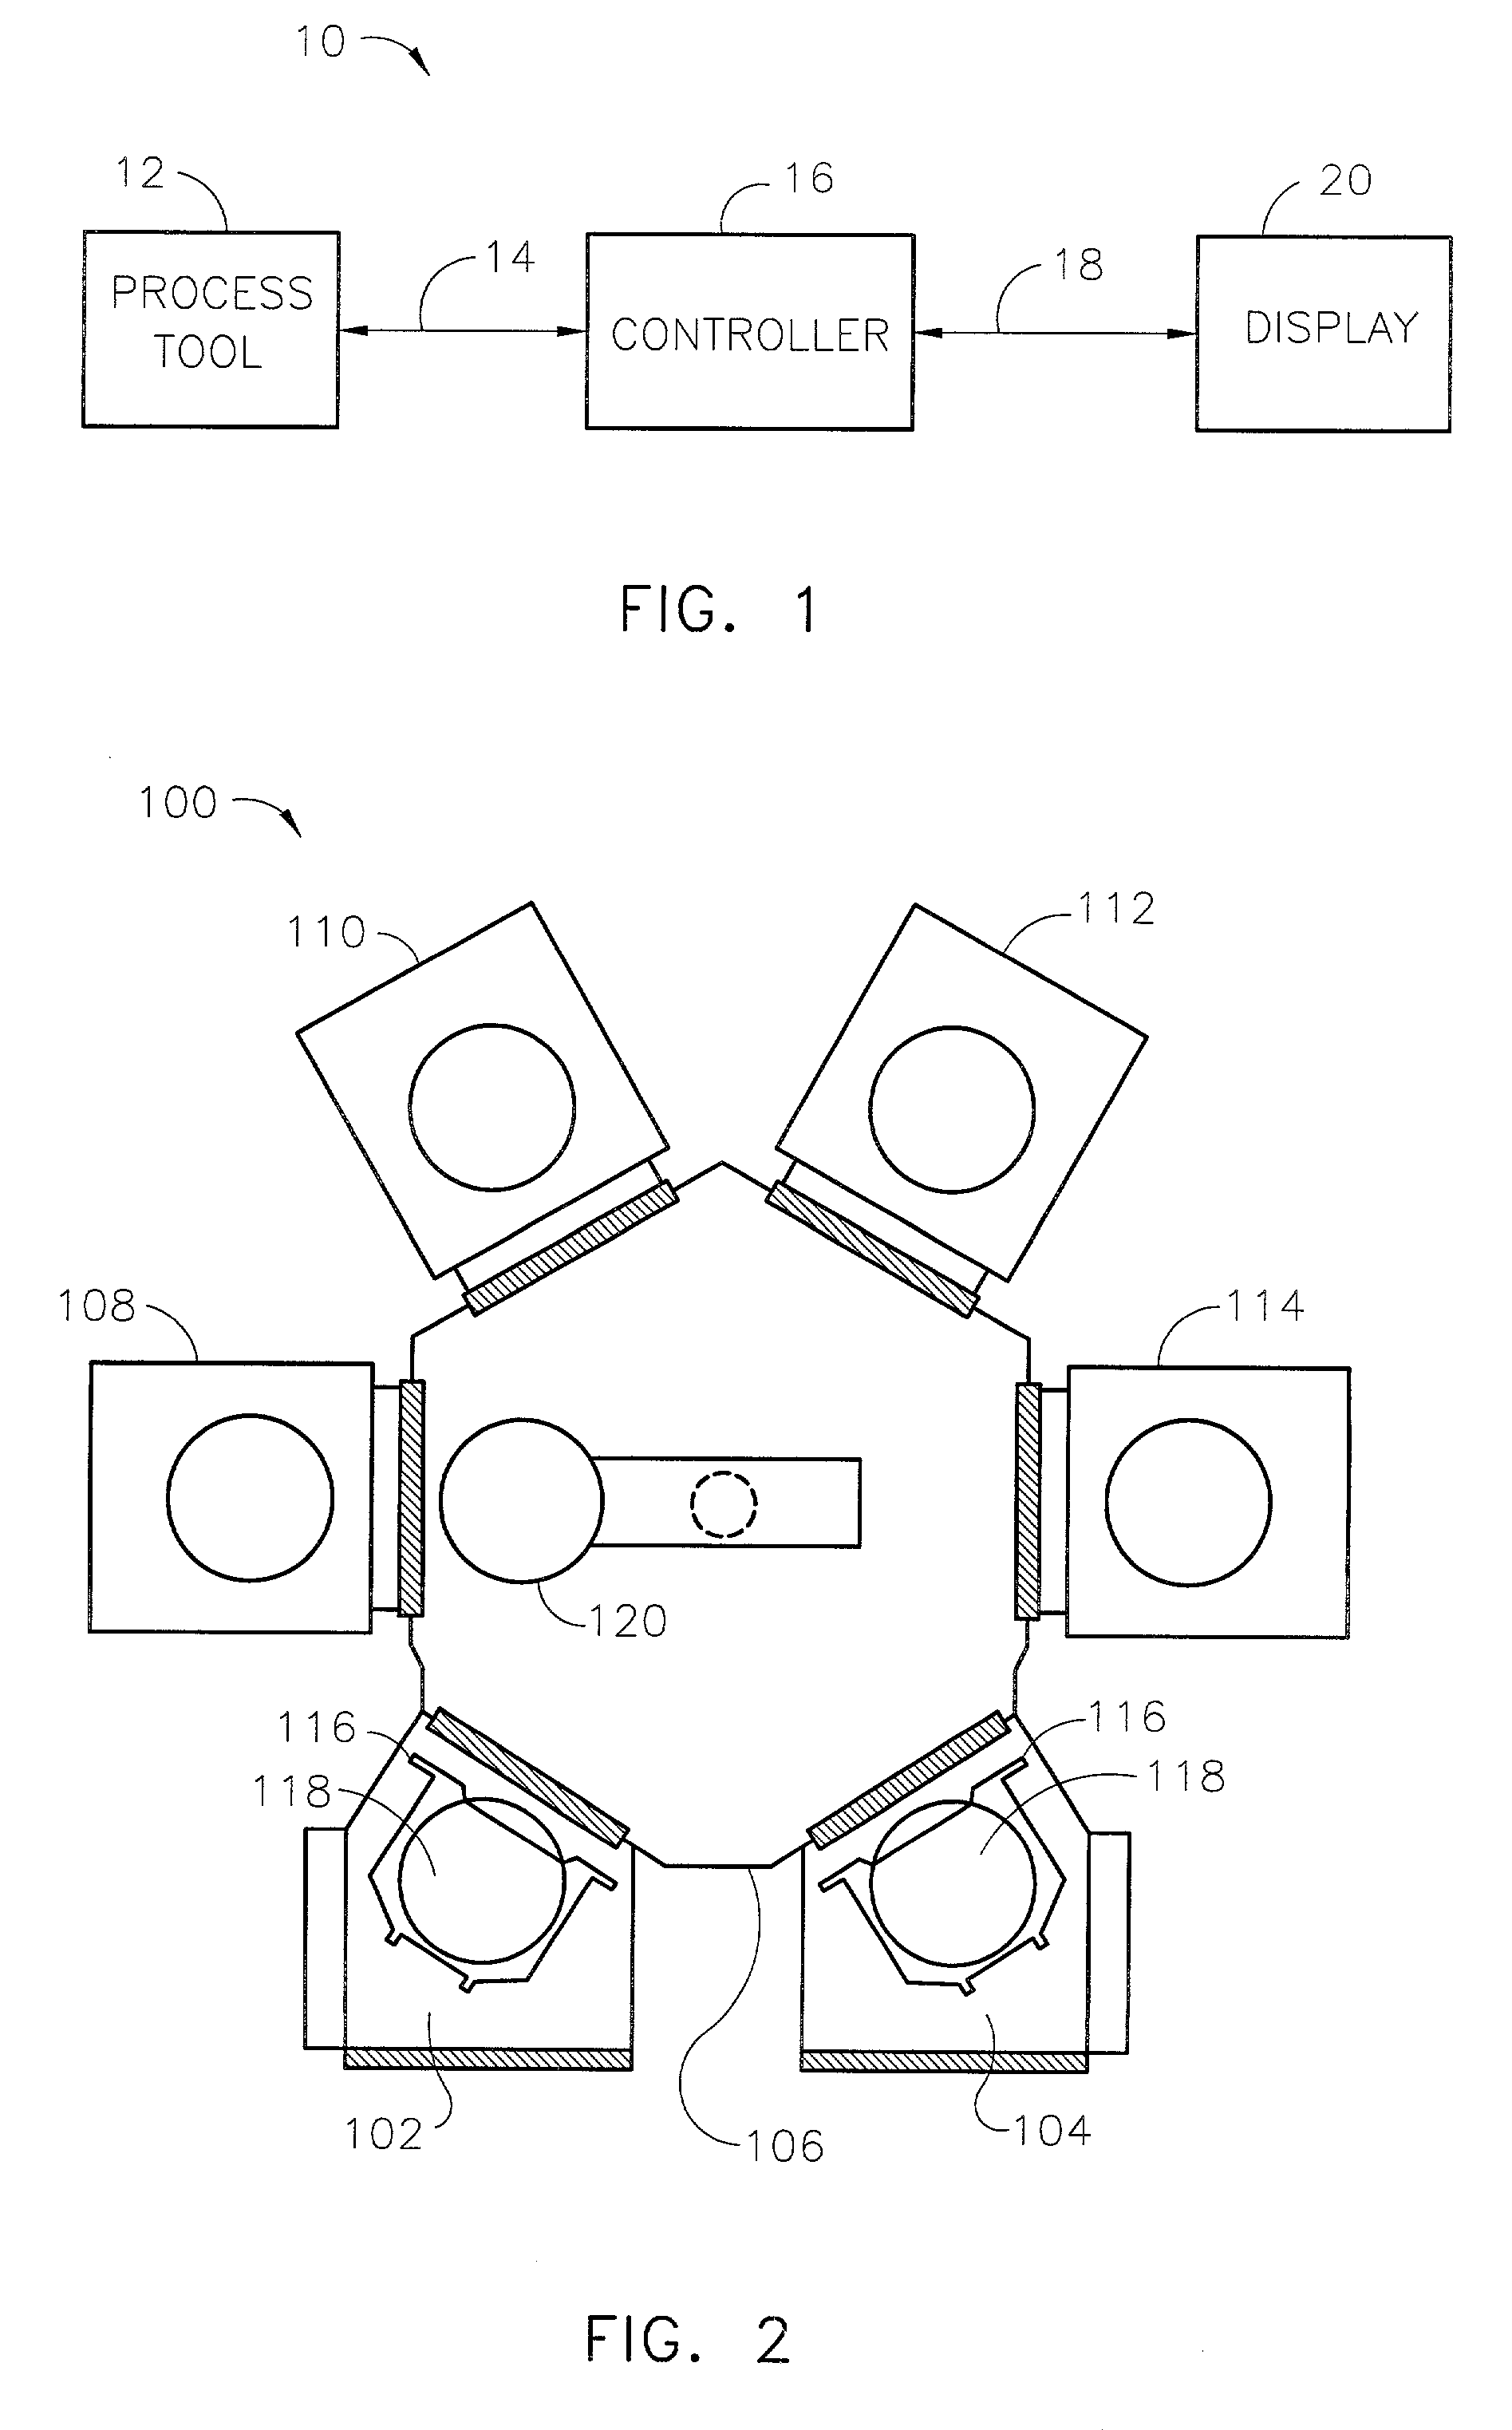
[0018]For example, FIG. 1 is a block diagram of a manufacturing system 10 in accordance with the teachings of the present invention. Manufacturing system 10 includes a process tool 12 coupled to a controller 16 via input / output line 14 and a display 20 coupled to the controller 16 via input / output line 18.
[0019]Processing tool 12 may be any tool wherein a work piece, such as a semiconductor wafer, undergoes multiple processing steps. Each of the processing steps performed by processing tool 12 wil...
PUM
 Abstract
Description
Claims
Application Information