Monitoring system and method implementing test result display logic

a monitoring system and display logic technology, applied in the field of telecommunications and test equipment, can solve the problems of prior art systems without any inherent knowledge of the signal characteristics associated with any service within the return path spectrum, and achieve the effect of efficient monitoring

Inactive Publication Date: 2006-05-23
VIAVI SOLUTIONS INC
View PDF14 Cites 10 Cited by
  • Summary
  • Abstract
  • Description
  • Claims
  • Application Information

AI Technical Summary

Benefits of technology

The present invention introduces an effective way to monitor communication signals on multiple lines simultaneously. This makes it easy for users to check the status of devices connected within a cable TV network. Additionally, the invention offers intuitive ways to show test results from different angles, making testing more convenient than before.

Problems solved by technology

The technical problem addressed in this patent is the need for a system to monitor and improve the signal-to-noise ratio of the return path in cable TV networks, which can impact performance and affect the quality of service provided to end users. Prior art systems for monitoring signal channels on the various nodes or paths of the network have limitations, such as not being able to test individual channels or measure signal parameters like carrier-to-noise ratio. Additionally, these systems do not provide a measure of total node power, which is useful for ensuring proper power levels for the transmission lasers. The signal characteristics of different channels can also vary from node to node, making it difficult to design and implement automated testing systems.

Method used


Image

  • Monitoring system and method implementing test result display logic
  • Monitoring system and method implementing test result display logic
  • Monitoring system and method implementing test result display logic

Examples


first embodiment

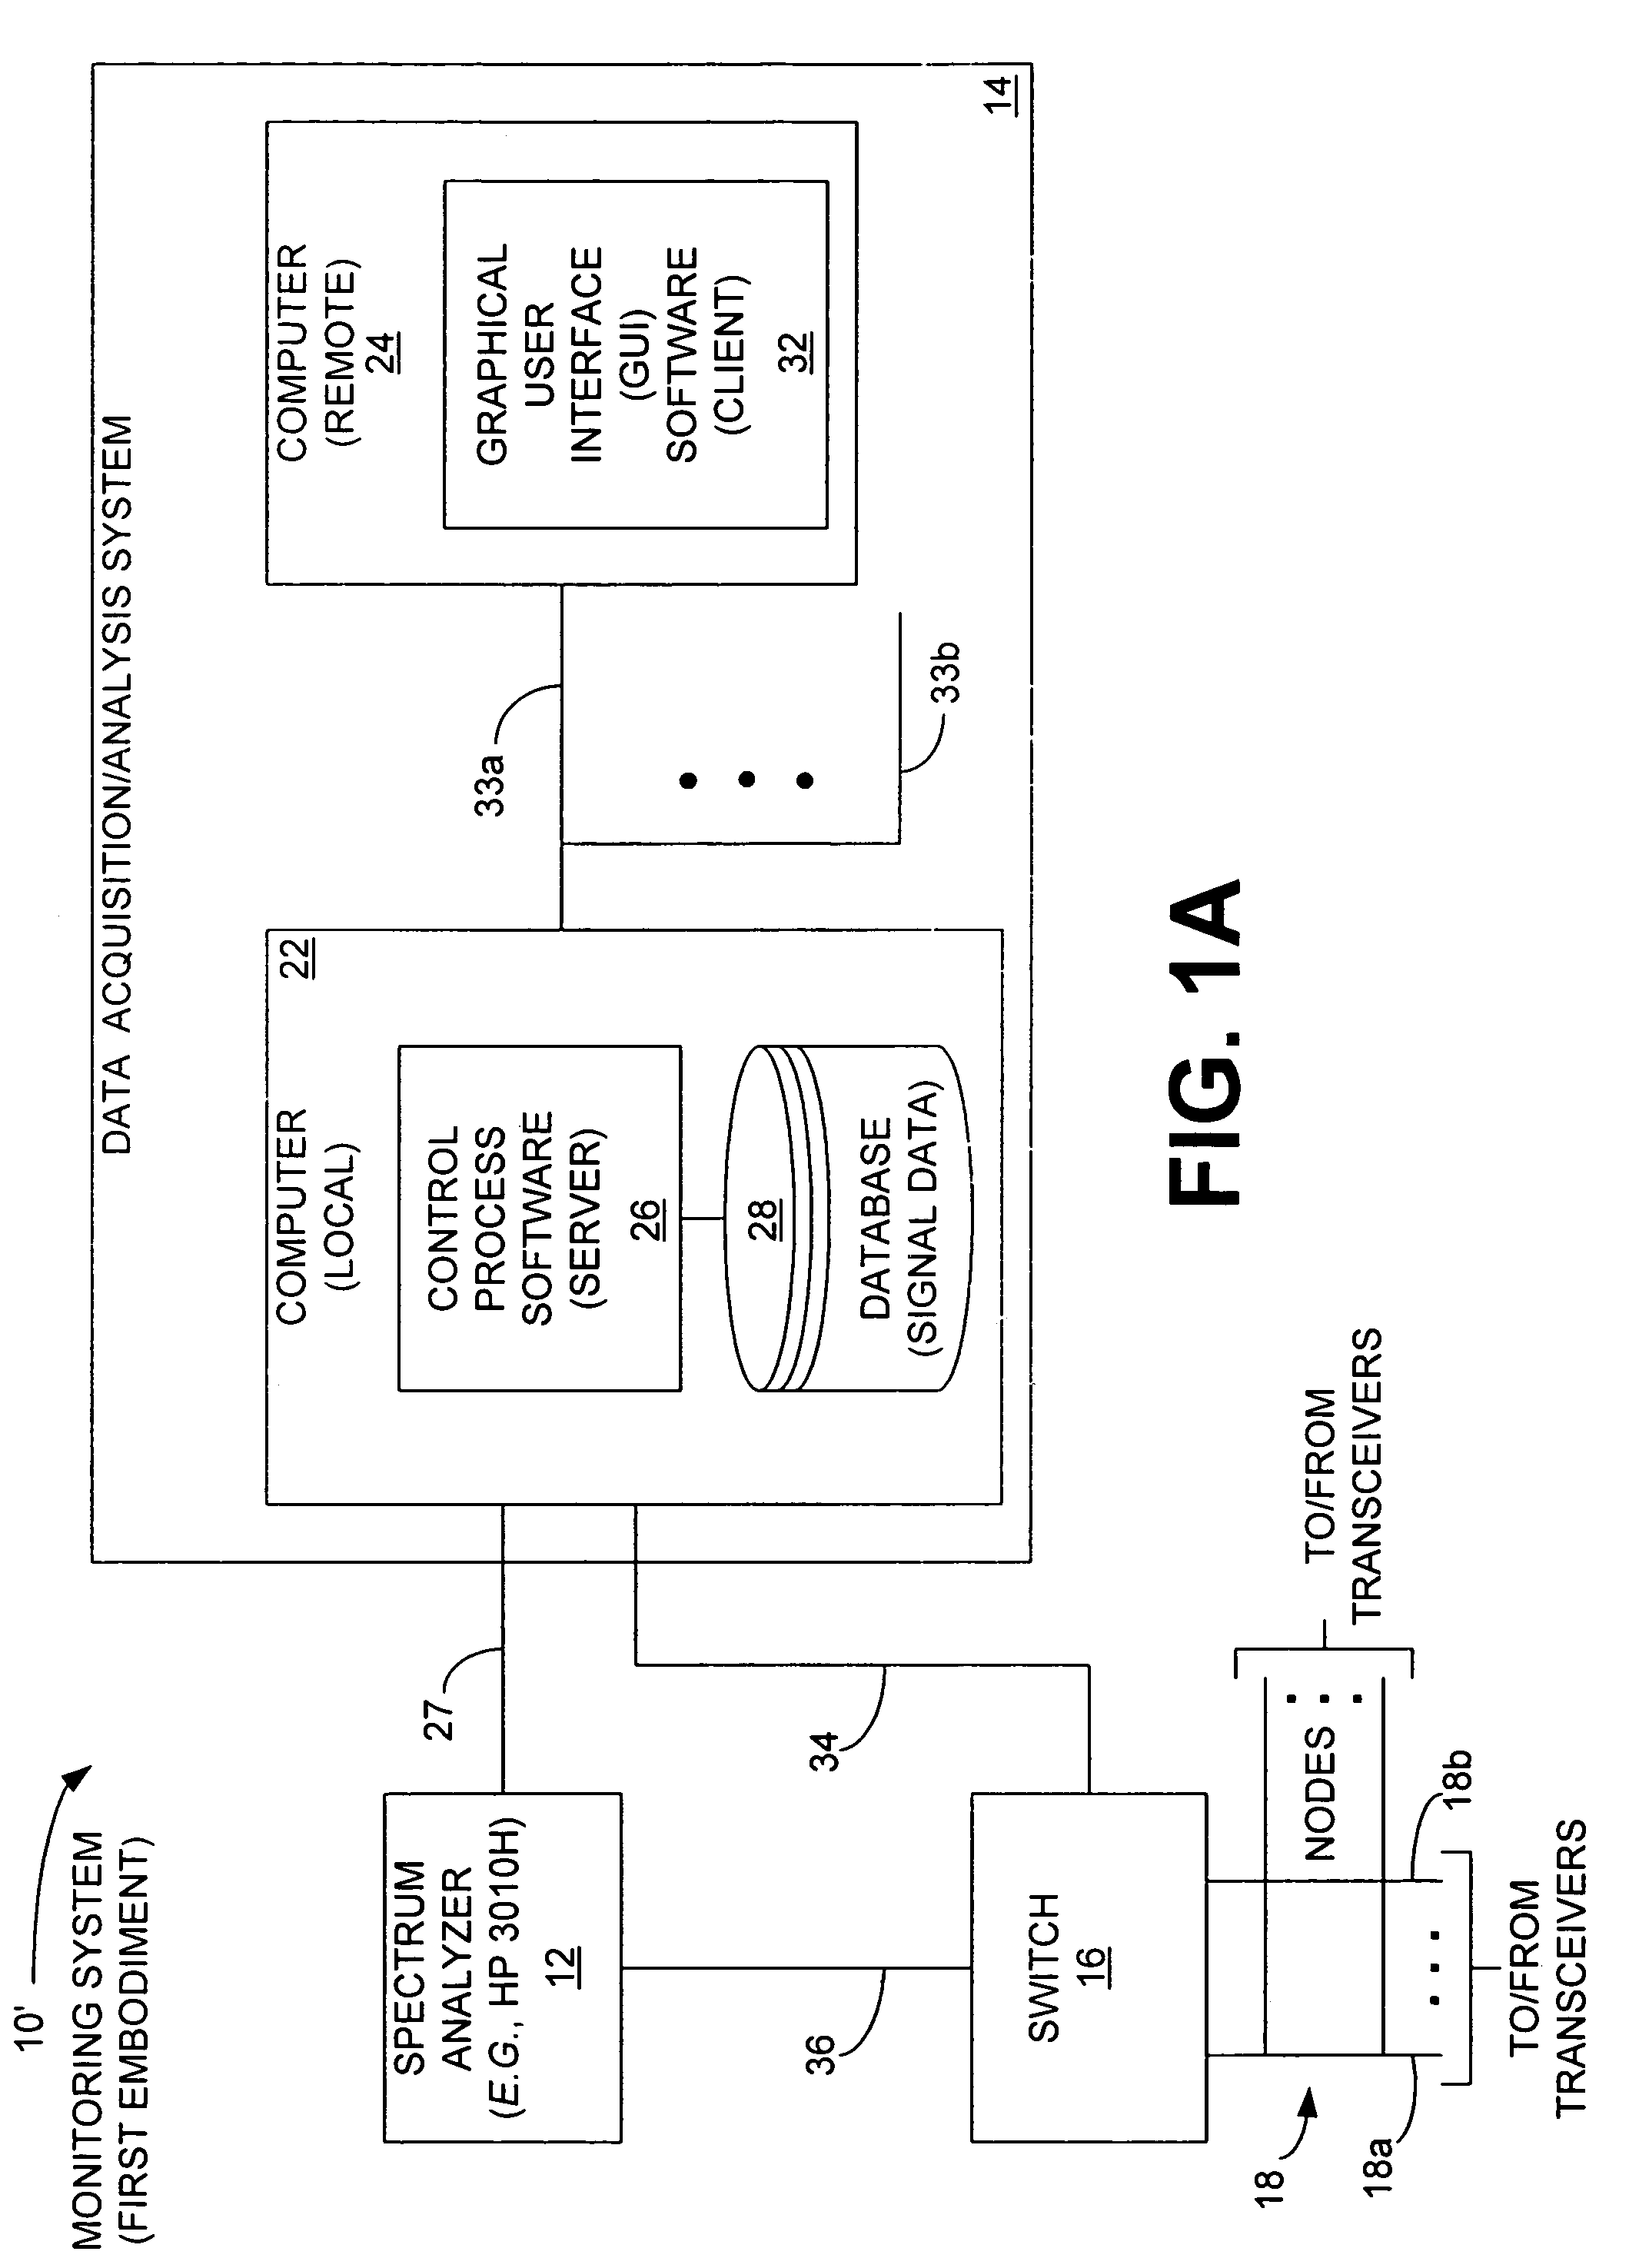
[0069]In this first embodiment, the remote computer 24 includes a graphical user interface (GUI) 32, which is also implemented in software and is essentially a client process relative to the server control process software 26 of the computer 22. Preferably, the GUI software 32 is stored in a memory(ies) (not shown) associated with the computer 24 and is executed by a suitable processor (not shown) associated therewith. In the preferred embodiment, the source code of the GUI software 32 is written in Visual Basic programming language and is executed on a Windows NT operating system (O / S). The remote computer 24, when used in the context of a cable television network, could be situated at a corporate office, network operations office, or a field office. The GUI software 32 enables, among other things, remote access to the signal data in the database 28 and the ability to control the spectrum analyzer 12 and switch 16.

[0070]It should be noted that the programs associated with the GUI s...
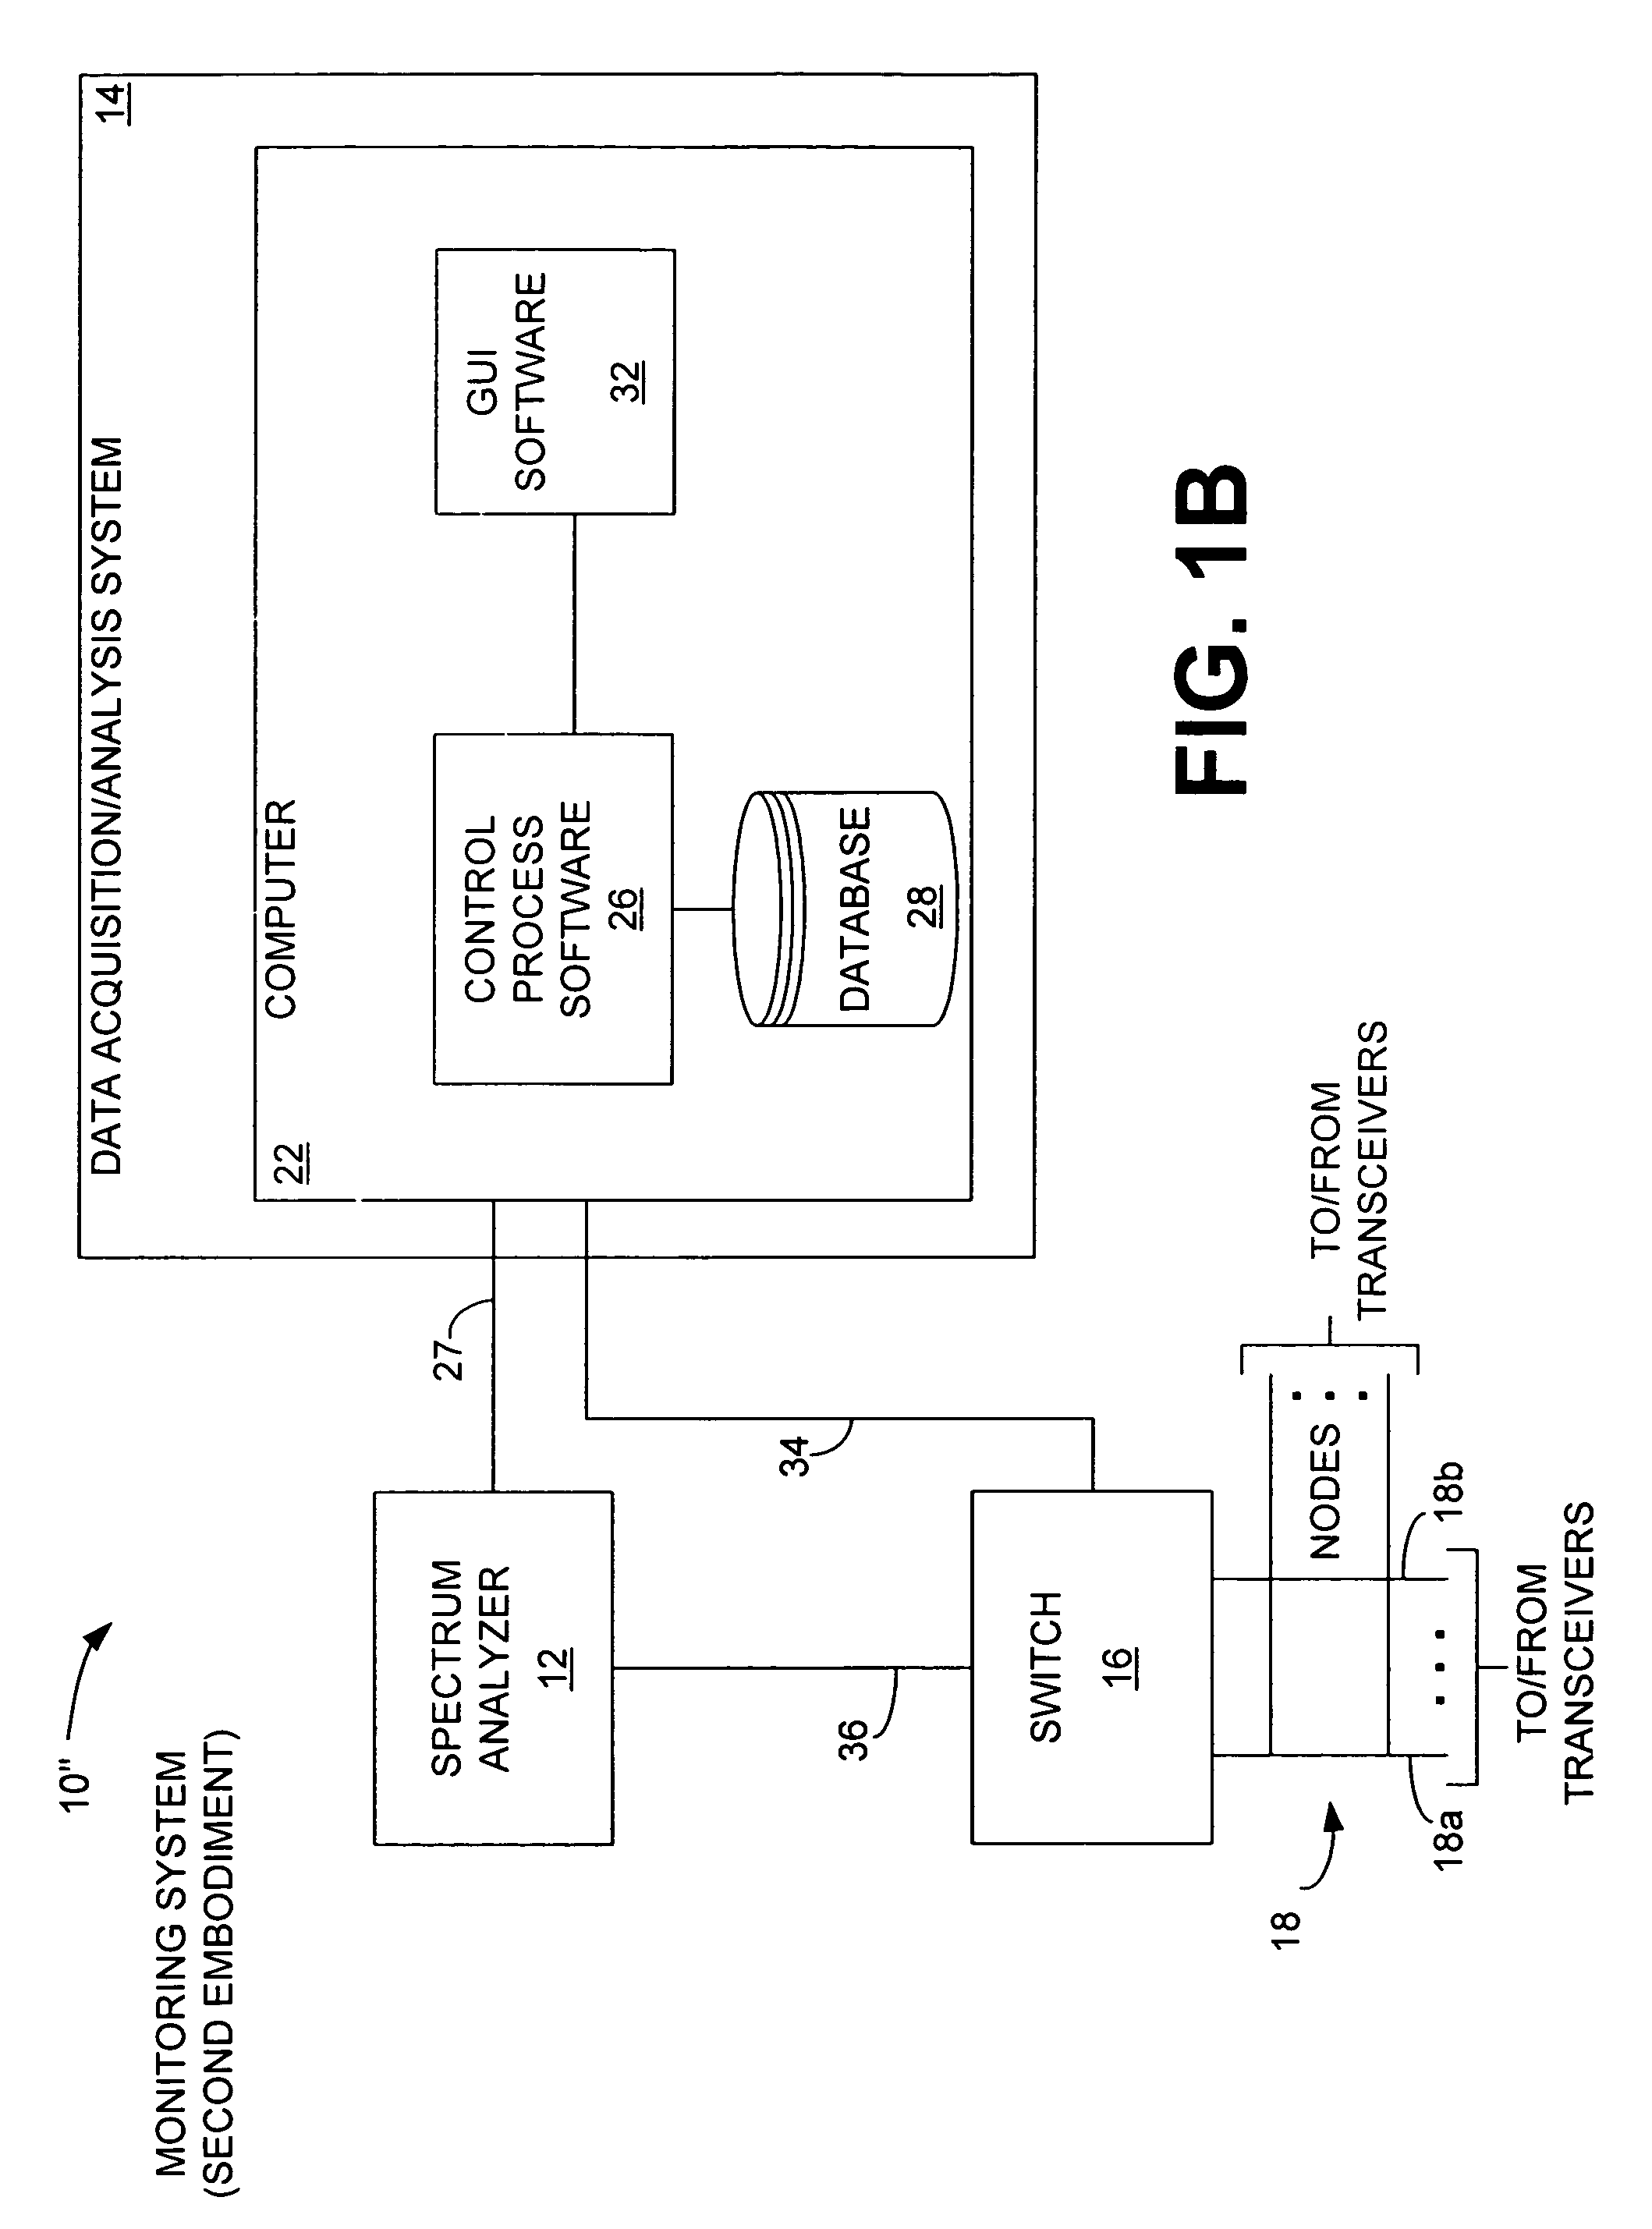
second embodiment

[0072]FIG. 1B is a block diagram of the monitoring system of the present invention and is generally denoted by reference numeral 10″. The monitoring system 10″ is architected so that a single computer 22 executes both the control process software 26 and the GUI software 32. In this embodiment, the data acquisition / analysis system 14 can be situated locally or remotely relative to the spectrum analyzer 12. Furthermore, in this embodiment and the others, it is envisioned that the spectrum analyzer 12 could be situated locally or remotely relative to the switch 16.

third embodiment

[0073]FIG. 1C is the monitoring system of the present invention and is generally denoted by reference numeral 10′″. In the monitoring system 10′″, the control process software 26 and the GUI software 32 are implemented within or as part of the spectrum analyzer 12.

II. Data Structure of Database

[0074]FIG. 2 is a diagram illustrating the data structure of the object-oriented database 28 (FIGS. 1A–1C) for storing signal data. Essentially, the data structure 52 of FIG. 3 illustrates the content of and the linking of objects within the database 28, which is preferably a suitable object oriented database. As illustrated in FIG. 2, a channel plan 56 is associated, or linked, to a node 54. The channel plan 56 specifies the signal characteristics of one or more signal channels 58 (labeled “A” to “D” in FIG. 2) associated with the corresponding node 18 (FIGS. 1A–1C). Each channel 58 specifies the signal characteristics of a particular type of communications device 62 from a particular vendor....


PUM


Abstract

A channel plan with a corresponding test plan are implemented in connection with a plurality of nodes that communicate signals. The channel plan has one or more predefined specifications for each of one or more signal channels on each of the nodes. The channel plan may comprise a specification of the following, for example, for each of the channels: a label describing use of the corresponding channel, a center frequency, a bandwidth, a power level, information regarding the carrier roll-off, a default status indicator identifying whether the corresponding channel is currently allocated or reserved for future use, one or more default threshold levels for various tests, and an alternate center frequency that may be utilized by the corresponding channel. The channel plan enables a monitoring system to, among other things, conduct automatic periodic test plans, comprising tests, on the nodes, based upon the predefined data specified in the channel plan. Each test plan prescribes measurement of at least one signal parameter, pertaining to one or more nodes as a whole and/or to one or more channels contained within the nodes. The monitoring system includes a spectrum analyzer, a switch enabling the spectrum analyzer to interface with the nodes, and a controller controlling the switch and the spectrum analyzer. The controller is configured to enable creation of and display the channel plan and test plan, based upon user inputs. Notably, the controller also implements user friendly test result display logic that enables a user to quickly and efficiently view test results associated with a system under test at various hierarchical conceptual levels.

Description


Claims


Application Information

Patent Timeline
Owner VIAVI SOLUTIONS INC
Why Eureka
Try Eureka