Method and apparatus for monitoring power quality in an electric power distribution system

a technology of power distribution system and power quality, applied in the direction of electric devices, instruments, measurement using digital techniques, etc., can solve the problems of inability to tell the power quality level of the state-of-the-art power quality meter lacks a means of telling the user whether the existing power quality is normal, and the user still does not know whether conditions are normal, etc., to achieve the goal of predefiniting acceptable power quality levels, and the unique attributes

Active Publication Date: 2006-05-23
EATON INTELLIGENT POWER LTD
View PDF12 Cites 28 Cited by
  • Summary
  • Abstract
  • Description
  • Claims
  • Application Information

AI Technical Summary

Problems solved by technology

However, the state-of-the-art power quality meters lack a means for telling the user whether the existing power quality is normal.
Nevertheless, until there is a triggered event, the user still does not know whether conditions are normal.
Furthermore, attempts to predefine acceptable power quality levels fail to acknowledge unique attributes of a particular electrical system.
However, the user still does not know whether the present values of the monitored parameters are normal.

Method used


Image

  • Method and apparatus for monitoring power quality in an electric power distribution system
  • Method and apparatus for monitoring power quality in an electric power distribution system
  • Method and apparatus for monitoring power quality in an electric power distribution system

Examples


example

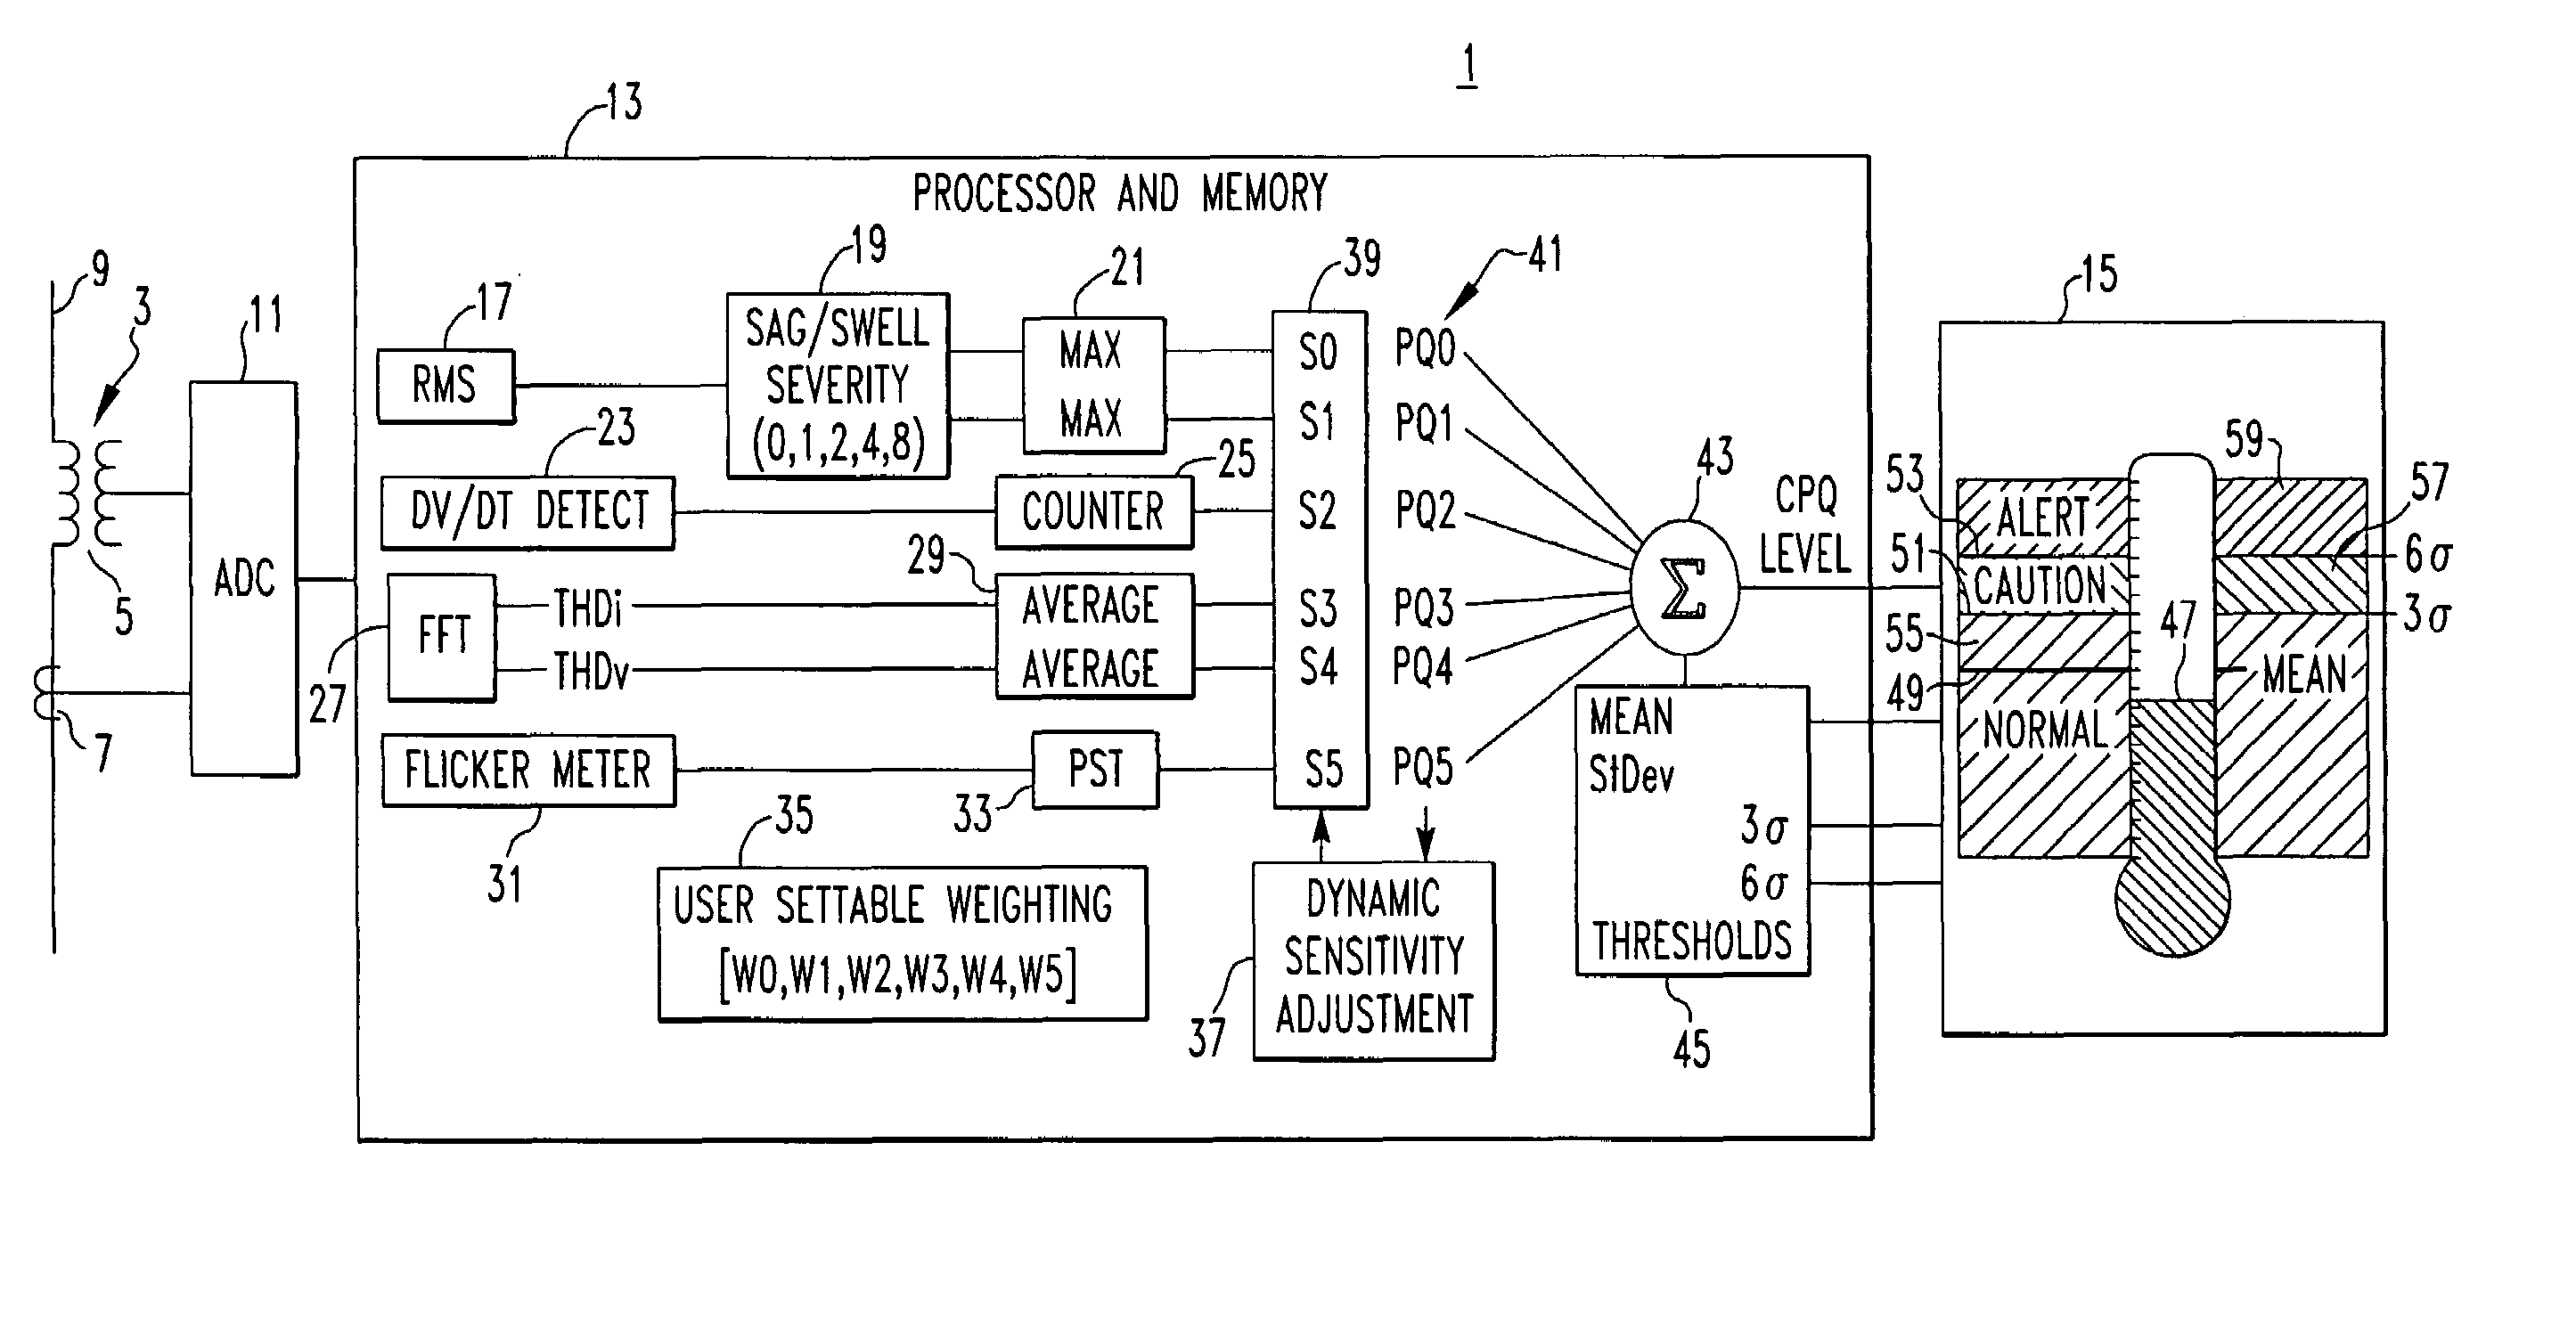
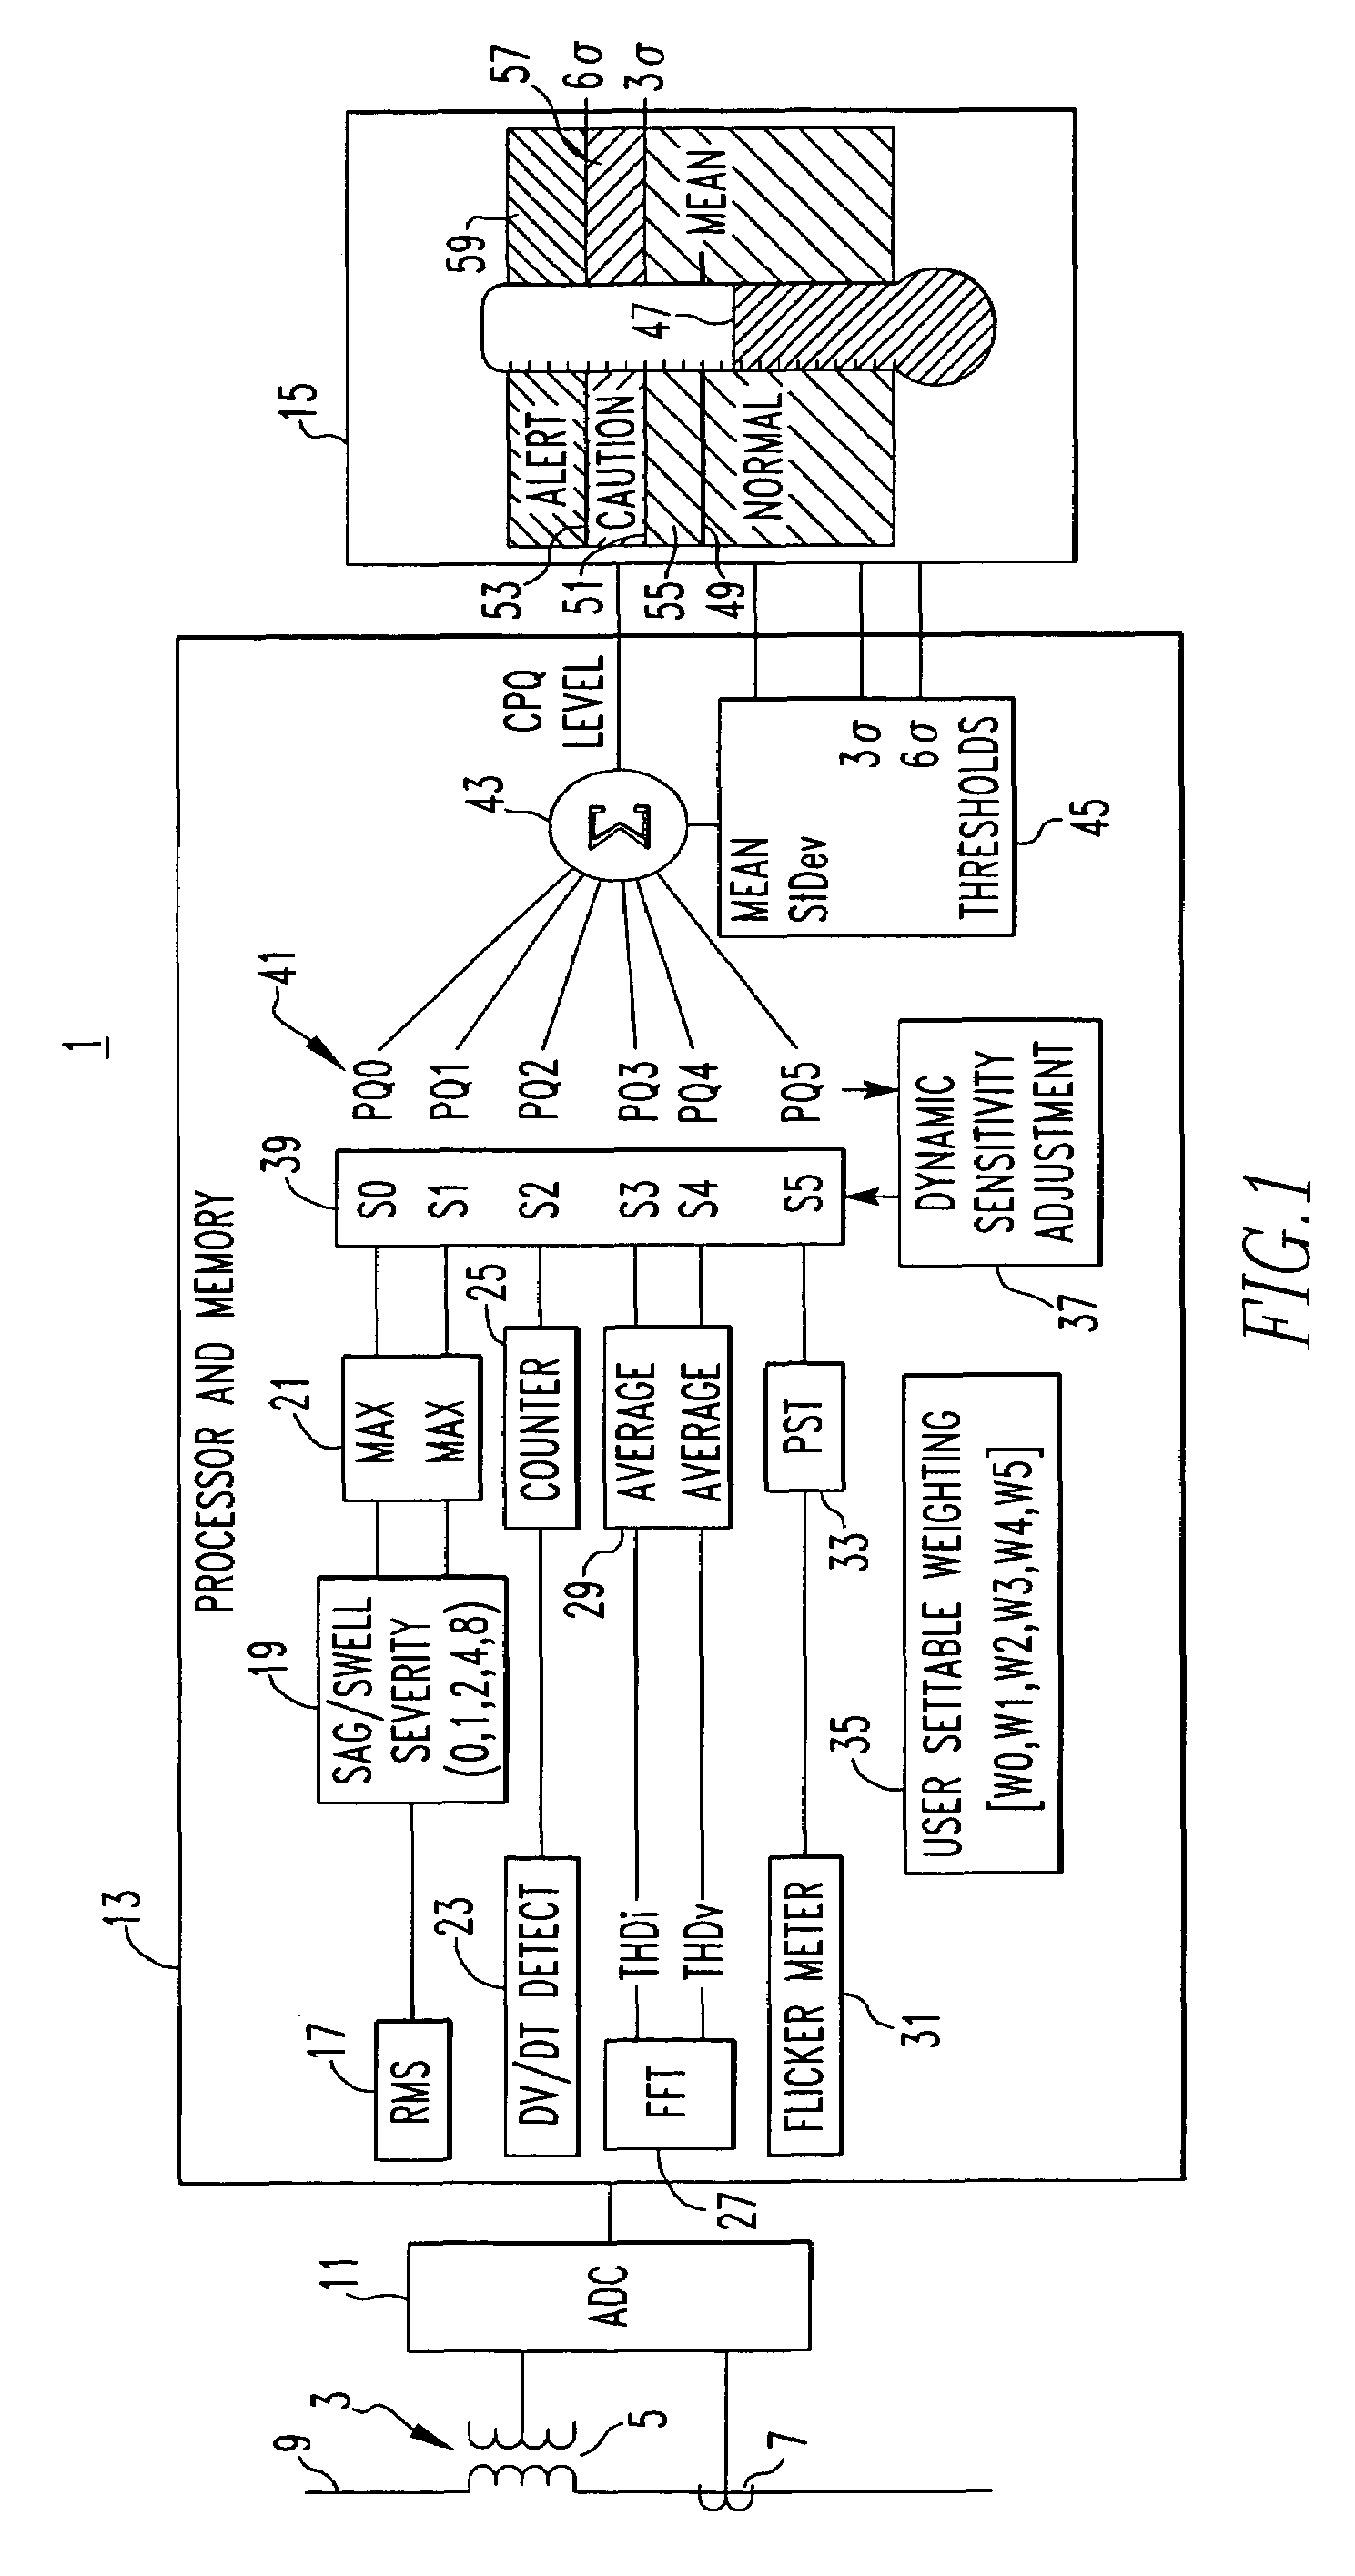
[0028]In order to establish a statistical basis for normal conditions in an electric power distribution system, data must be collected over the long term. In the exemplary system, a moving average of the composite power quality is maintained over a one-year period. Because this would require the collection of data for one year before the system could be fully utilized, initial calculations of the composite power quality are generated using a one-week moving average. When 52 weeks of data have been accumulated, then the one-year moving average is used. Thus, a first, one-week, long-term moving average is utilized until enough data has been collected for a second long-term moving average, e.g., one year, has been accumulated. In the example, the following Equation 1 is used to calculate the one-week moving average:

[0029]μw=11008⁡[1007⁢⁢μw-1+PQ]Eq.⁢(1)

Data is calculated for ten-minute intervals, there being 1008 ten-minute intervals in a week.

[0030]The weekly averages are then utilized...


PUM


Abstract

A composite power quality indication generated from user weighted statistical contributions of selected system parameters provides an overall indication of power quality in an electric power distribution system. The user defined weightings are maintained over time by continually updating sensitivities that normalize the component contributions to the composite power quality indication. The current composite power quality indication is displayed in relation to its long-term mean and to dynamic thresholds determined as multiples of the standard deviation of the long-term mean.

Description

BACKGROUND OF THE INVENTION[0001]1. Field of the Invention[0002]The invention relates to a system and method for monitoring the performance of an electric power distribution system, and as one aspect, to the generation and presentation of a composite power quality indicator generated from user weighted statistical contributions of various system parameters.[0003]2. Background Information[0004]Various techniques have been employed for monitoring the performance of electric power distribution systems. State-of-the-art monitors calculate various electrical parameters such as RMS currents and voltages, peak currents and voltages, power, energy, power factor and the like. Waveform analyzers are used for oscillographic analysis of system waveforms. Numerous methods have been developed to measure and capture power quality events, such as current and voltage sags and swells, voltage surges and excessive harmonic distortion and flicker. However, the state-of-the-art power quality meters lack...

Claims


Application Information

Patent Timeline
Patent Type & Authority Patents(United States)
IPC IPC(8): G01R21/00G01R13/02G01R19/25G01R21/133
CPCG01R13/0209G01R21/133G01R19/2513G01R21/006
Inventor COX, ROGER W.
Owner EATON INTELLIGENT POWER LTD
Why Eureka
Try Eureka