Transistor performance analysis system

a technology of performance analysis and transistor, applied in the field of semiconductor production, can solve the problems of difficult to effectively difficult to analyze the large volume of data, and prone to large variations in data collected

Inactive Publication Date: 2006-06-13
INTEL CORP
View PDF5 Cites 15 Cited by
  • Summary
  • Abstract
  • Description
  • Claims
  • Application Information

AI Technical Summary

Problems solved by technology

A primary challenge within each technology is to ascertain the optimal transistor architecture within the ranges of the electrical and physical constraints that produces the best combination of performance and manufacturability.
In the early phases of technology development, the data collected is prone to large variations, both within the wafer and across other wafers in the lot.
The significant variations in data make it difficult to effectively analyze the large volume of data.
During transistor optimization, there exist several challenges in analyzing the data.
First, it is difficult to efficiently extract, filter, and align the large volume of data, which includes both electrical and physical characteristics.
A highly trained engineer visually inspects each graph and manually correlates key parameters between graphs, a time-consuming procedure.
This expert-driven and time-consuming aspect of the analysis traditionally impedes automation.
Without being able to change parametric models and key parameters efficiently, the analysis quickly becomes stale.
When a change in the parametric model occurs, the current data analysis paradigm is not capable of adapting automatically.
Statistical algorithms that lack the capability to adjust with engineering judgment are not typically used for such data analysis because of the variation in the data obtained during technology development.
The process does not easily adapt to changes in data or in the desired analysis methodology.
Further, the process is not automatic, as it includes a significant amount of manual interaction with the software programs.

Method used


Image

  • Transistor performance analysis system
  • Transistor performance analysis system
  • Transistor performance analysis system

Examples


Embodiment Construction

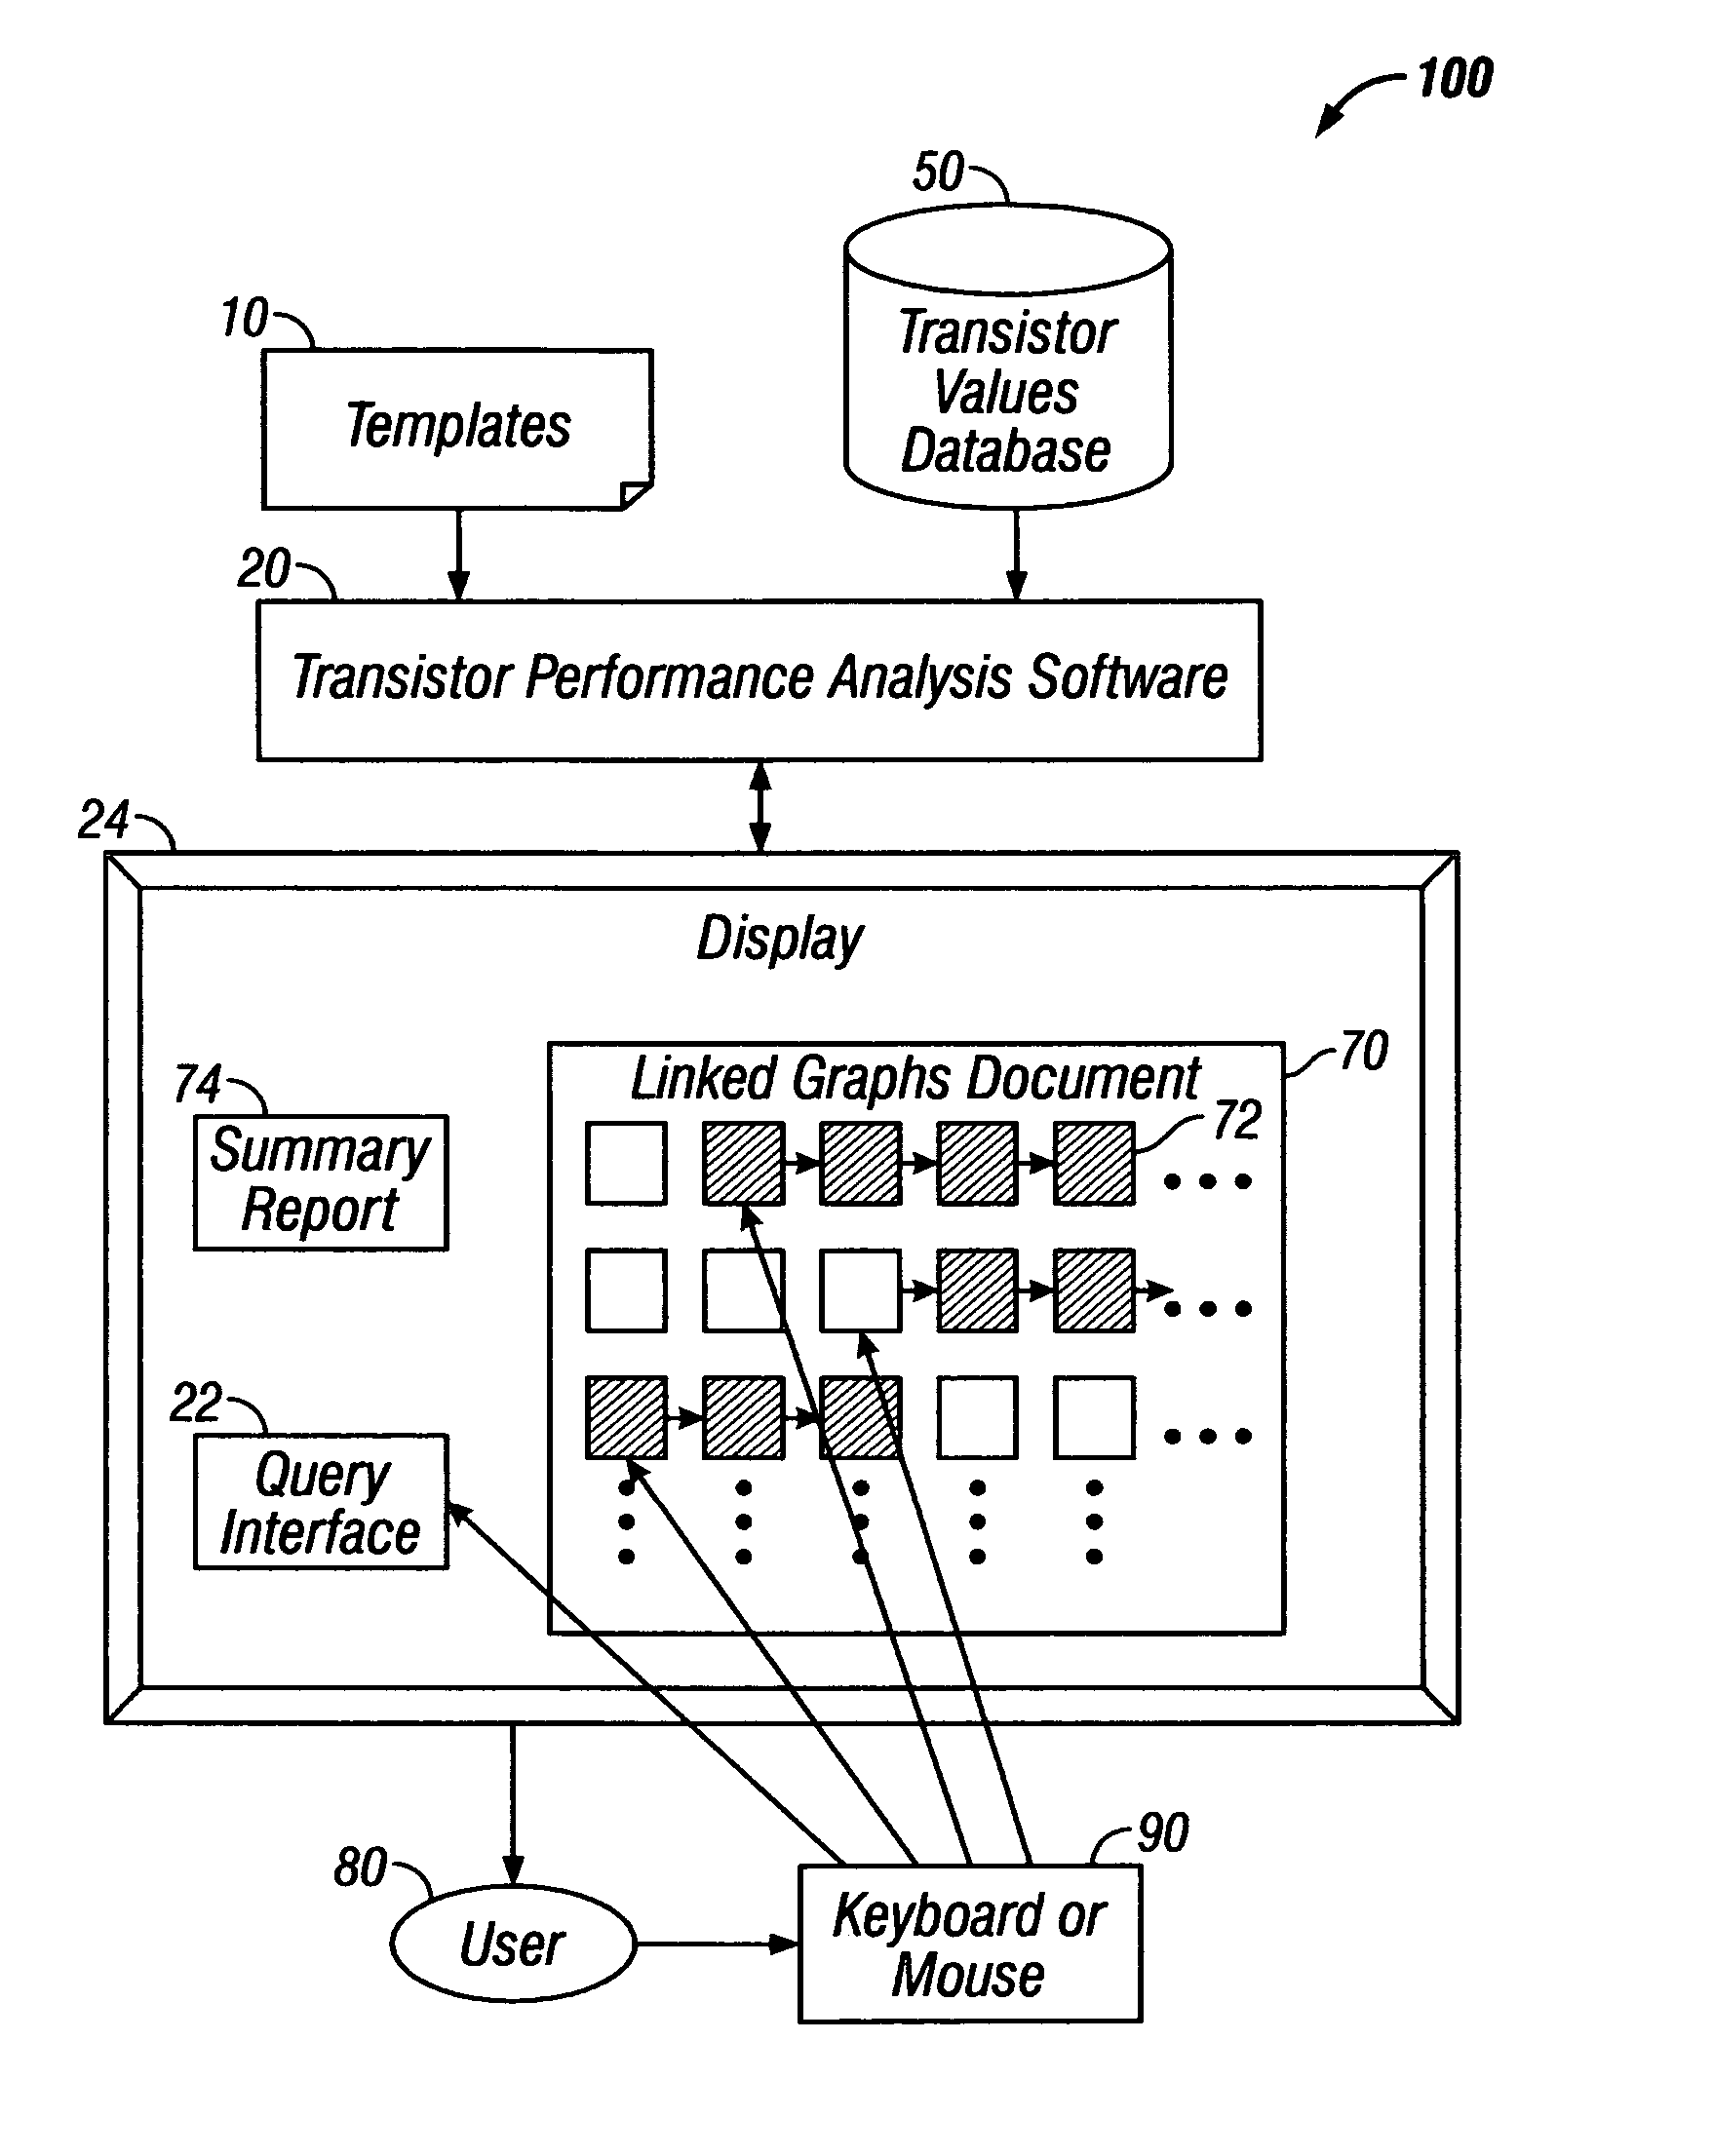
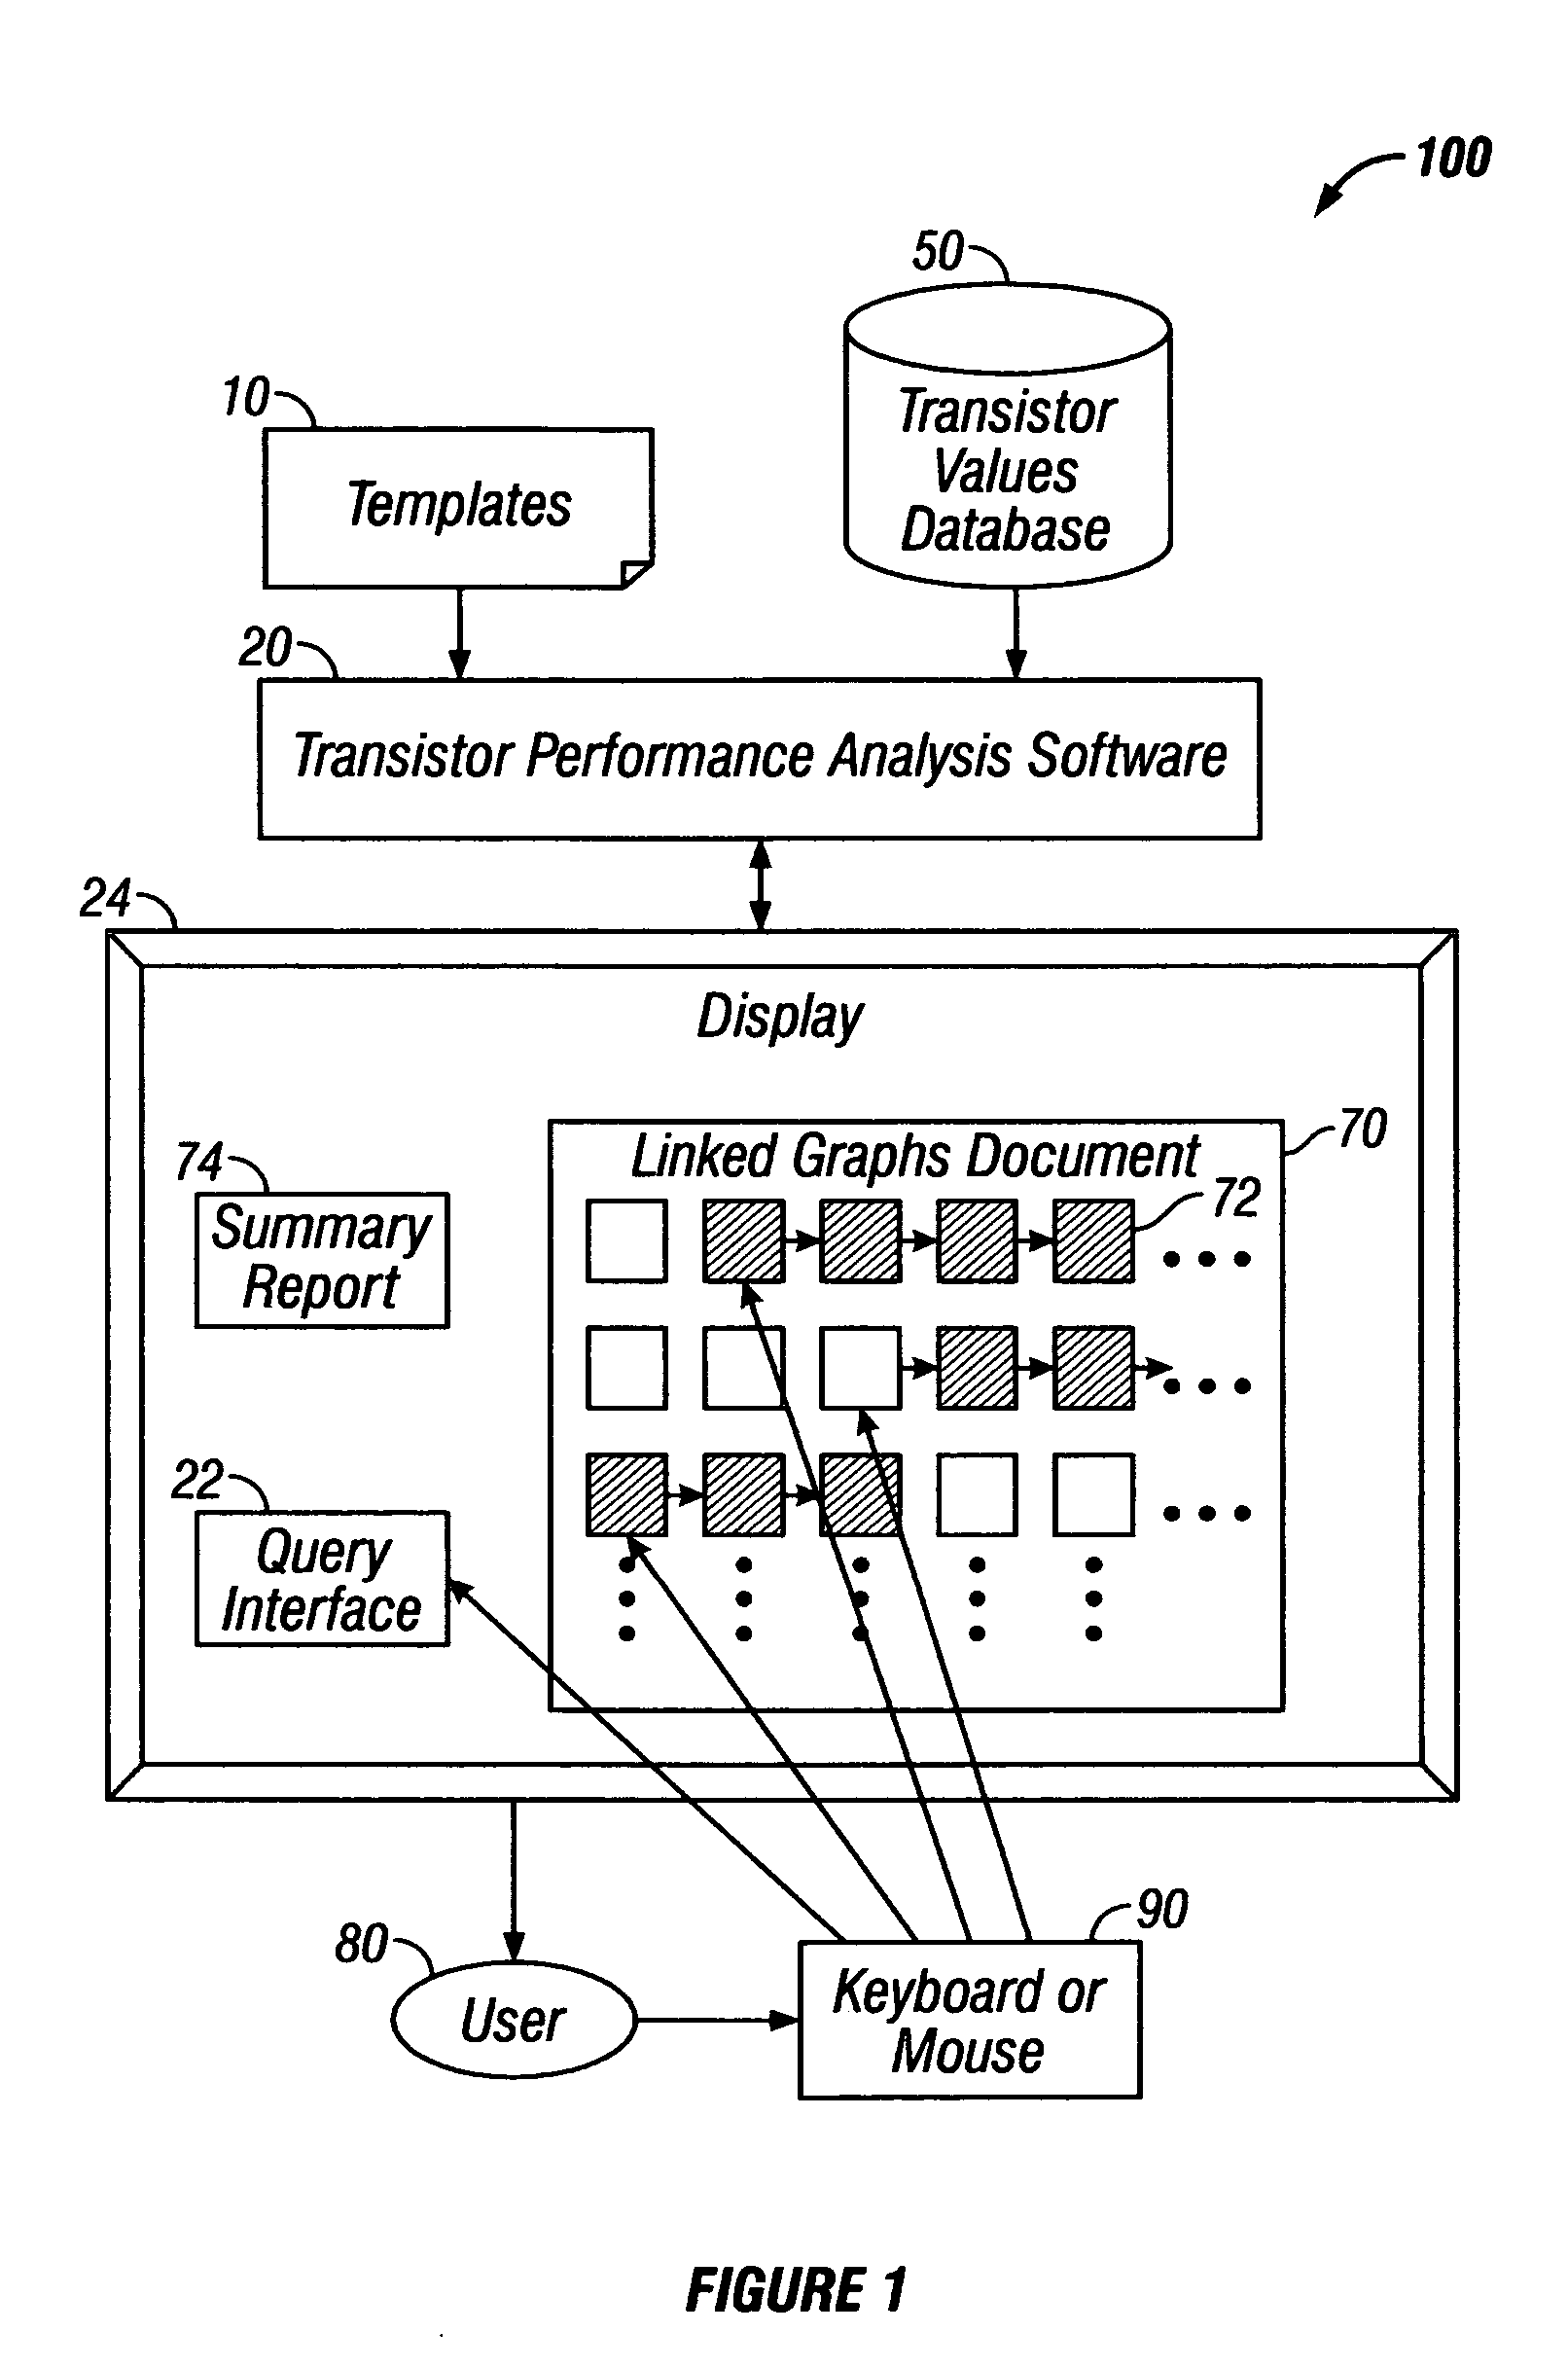
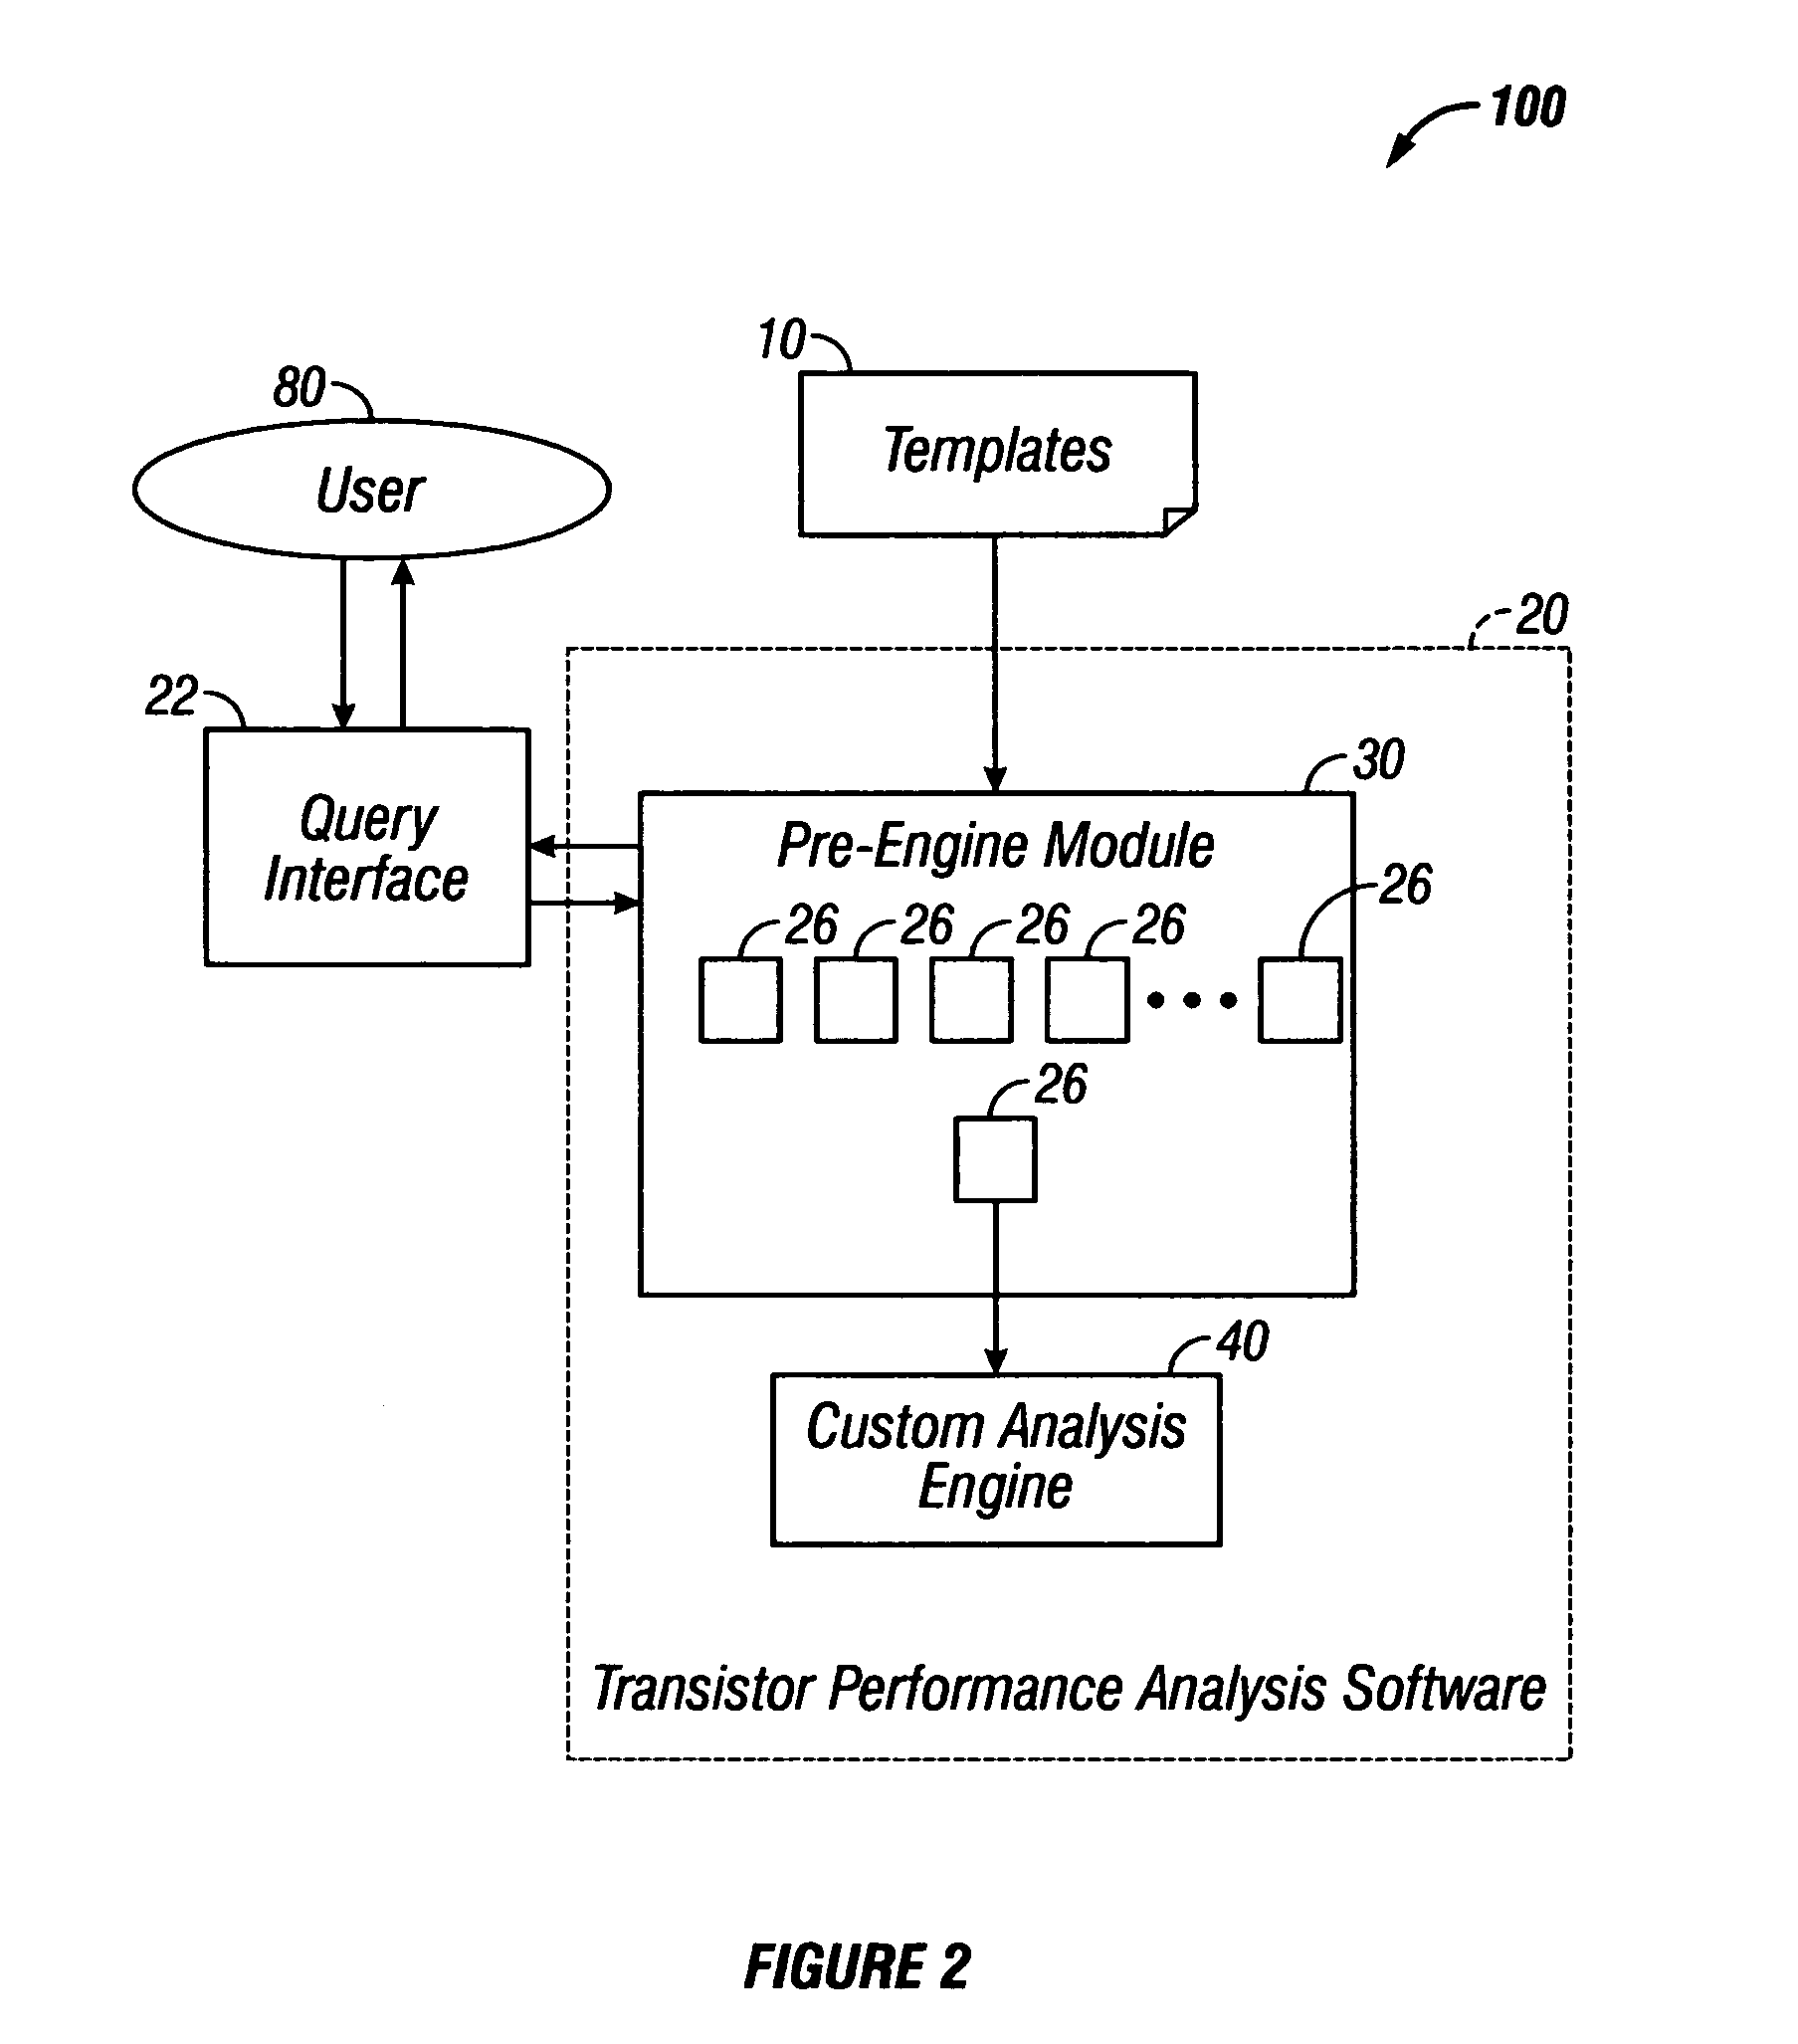
[0026]In accordance with the embodiments described herein, a system is disclosed for efficiently and automatically conducting transistor performance analysis. The system includes a transistor performance analysis software program, which takes as inputs a specification from the user of an analysis template and the material to be analyzed. The analysis template describes the parameters to be extracted and the analyses to be performed. The software extracts the values of the parameters obtained during testing of the transistors, and produces an output document with linked graphs that is suitable for performing interactive analysis, as well as a summary document following the analysis.

[0027]The transistor performance analysis software produces hundreds of linked, interactive graphs based on the chosen template, which specifies parameters, charting options, and algorithms used to generate the graphs. In some embodiments, 500 sets of data, including 500 graphs, are generated from 100,000 ...


PUM


Abstract

A system for conducting transistor performance analysis is disclosed, in which automatic graph plotting is interactively enhanced with human judgment. The system includes executing transistor performance analysis software, which receives templates specifying parameters, graph charting options, and algorithms, as well as a database of transistor values, as its inputs. The software produces an output document with linked graphs and a summary report. The software extracts, filters and applies statistical regression to large quantities of data. The software also applies statistical filtering to the data and automatically plots hundreds of charts and graphs based on the data. Graphs are color-coded to highlight relationships that suffer from unusually high noise in the data. Users can manually adjust lines on the graphs, which are automatically reflected in dependent graphs and the summary report. Changes to program methodology can be achieved by changing the template rather than by modifying the software.

Description

FIELD OF THE INVENTION[0001]This invention relates to semiconductor production, and, more particularly, to a software program that automates transistor performance analysis.BACKGROUND OF THE INVENTION[0002]Typically, every process generation of semiconductor technology development involves a shrink in the physical dimensions of the manufacturing process and a redesign of the base architecture of the transistor. At the onset of a new technology, electrical and physical constraints are determined, to which the entire manufacturing process conforms.[0003]A primary challenge within each technology is to ascertain the optimal transistor architecture within the ranges of the electrical and physical constraints that produces the best combination of performance and manufacturability. In addition to shrinking the transistors (replacing a 0.15-micron process with a 0.10-micron process, for example), improvements in transistor switching performance, improved drive current, and reduced leakage ...

Claims


Application Information

Patent Timeline
Patent Type & Authority Patents(United States)
IPC IPC(8): G06F11/30G06F17/50
CPCG01R31/2837G01R31/2601
Inventor WINSTEAD, CHARLES H.ZHOU, YIQINGAUYEUNG, CARRIE
Owner INTEL CORP
Why Eureka
Try Eureka