Method and apparatus for visualizing metrics in a data space

a data space and data visualization technology, applied in the field of data monitoring and presentation, can solve the problems of increasing the complexity of monitoring various metrics, difficult to collect and analyze various metrics, and extremely difficult to perform real-time analysis

Inactive Publication Date: 2006-09-05
IBM CORP
View PDF15 Cites 48 Cited by
  • Summary
  • Abstract
  • Description
  • Claims
  • Application Information

AI Technical Summary

Benefits of technology

[0016]A further aspect of the invention disclosed a machine readable storage having stored thereon, a computer program having a plurality of code sections for visualizing metrics for at least one component in a complex heterogeneous CDN. The code sections are executable by a machine for causing the machine to perform the steps of defining metrics characterizing the performance of the component in the CDN and computing values for said defined metrics. A graphical display can be utilized to display selected ones of the computed values and the graphical display can change in response to changes in the computed values and components or entities. This change can be dynamic.
[0017]Another aspect of the invention discloses a machine readable storage having stored thereon, a computer program having a plurality of code sections for monitoring a component in a CDN. The code sections are executable by a machine for causing the machine to perform the steps of selecting one or more monitored metric corresponding to a component in the CDN and determining a value for the selected metric. A display indicator can be calculated based on the determined value. The display indicator which can be visual representation of the monitored metric for a specified component in the CDN, can be displayed on a graphical display.

Problems solved by technology

As the size of complex heterogeneous systems increase, so does the complexity of monitoring various metrics.
Moreover, as complex heterogeneous systems become more diverse, it can become progressively more difficult to collect and analyze the various metrics collected.
Since the CDN can consist of entities and diverse components, the size and heterogeneous characteristics of these CDNs can make it extremely difficult to perform real time analysis.
This post analysis monitoring can be time extremely consuming and very expensive.
A similar problem can exist in other complex heterogeneous systems such as computing system environments.
However, as the size and complexity of the software, related databases, and the number of users accessing such systems increases, the collection and analysis of metrics becomes more difficult.

Method used


Image

  • Method and apparatus for visualizing metrics in a data space
  • Method and apparatus for visualizing metrics in a data space
  • Method and apparatus for visualizing metrics in a data space

Examples


Embodiment Construction

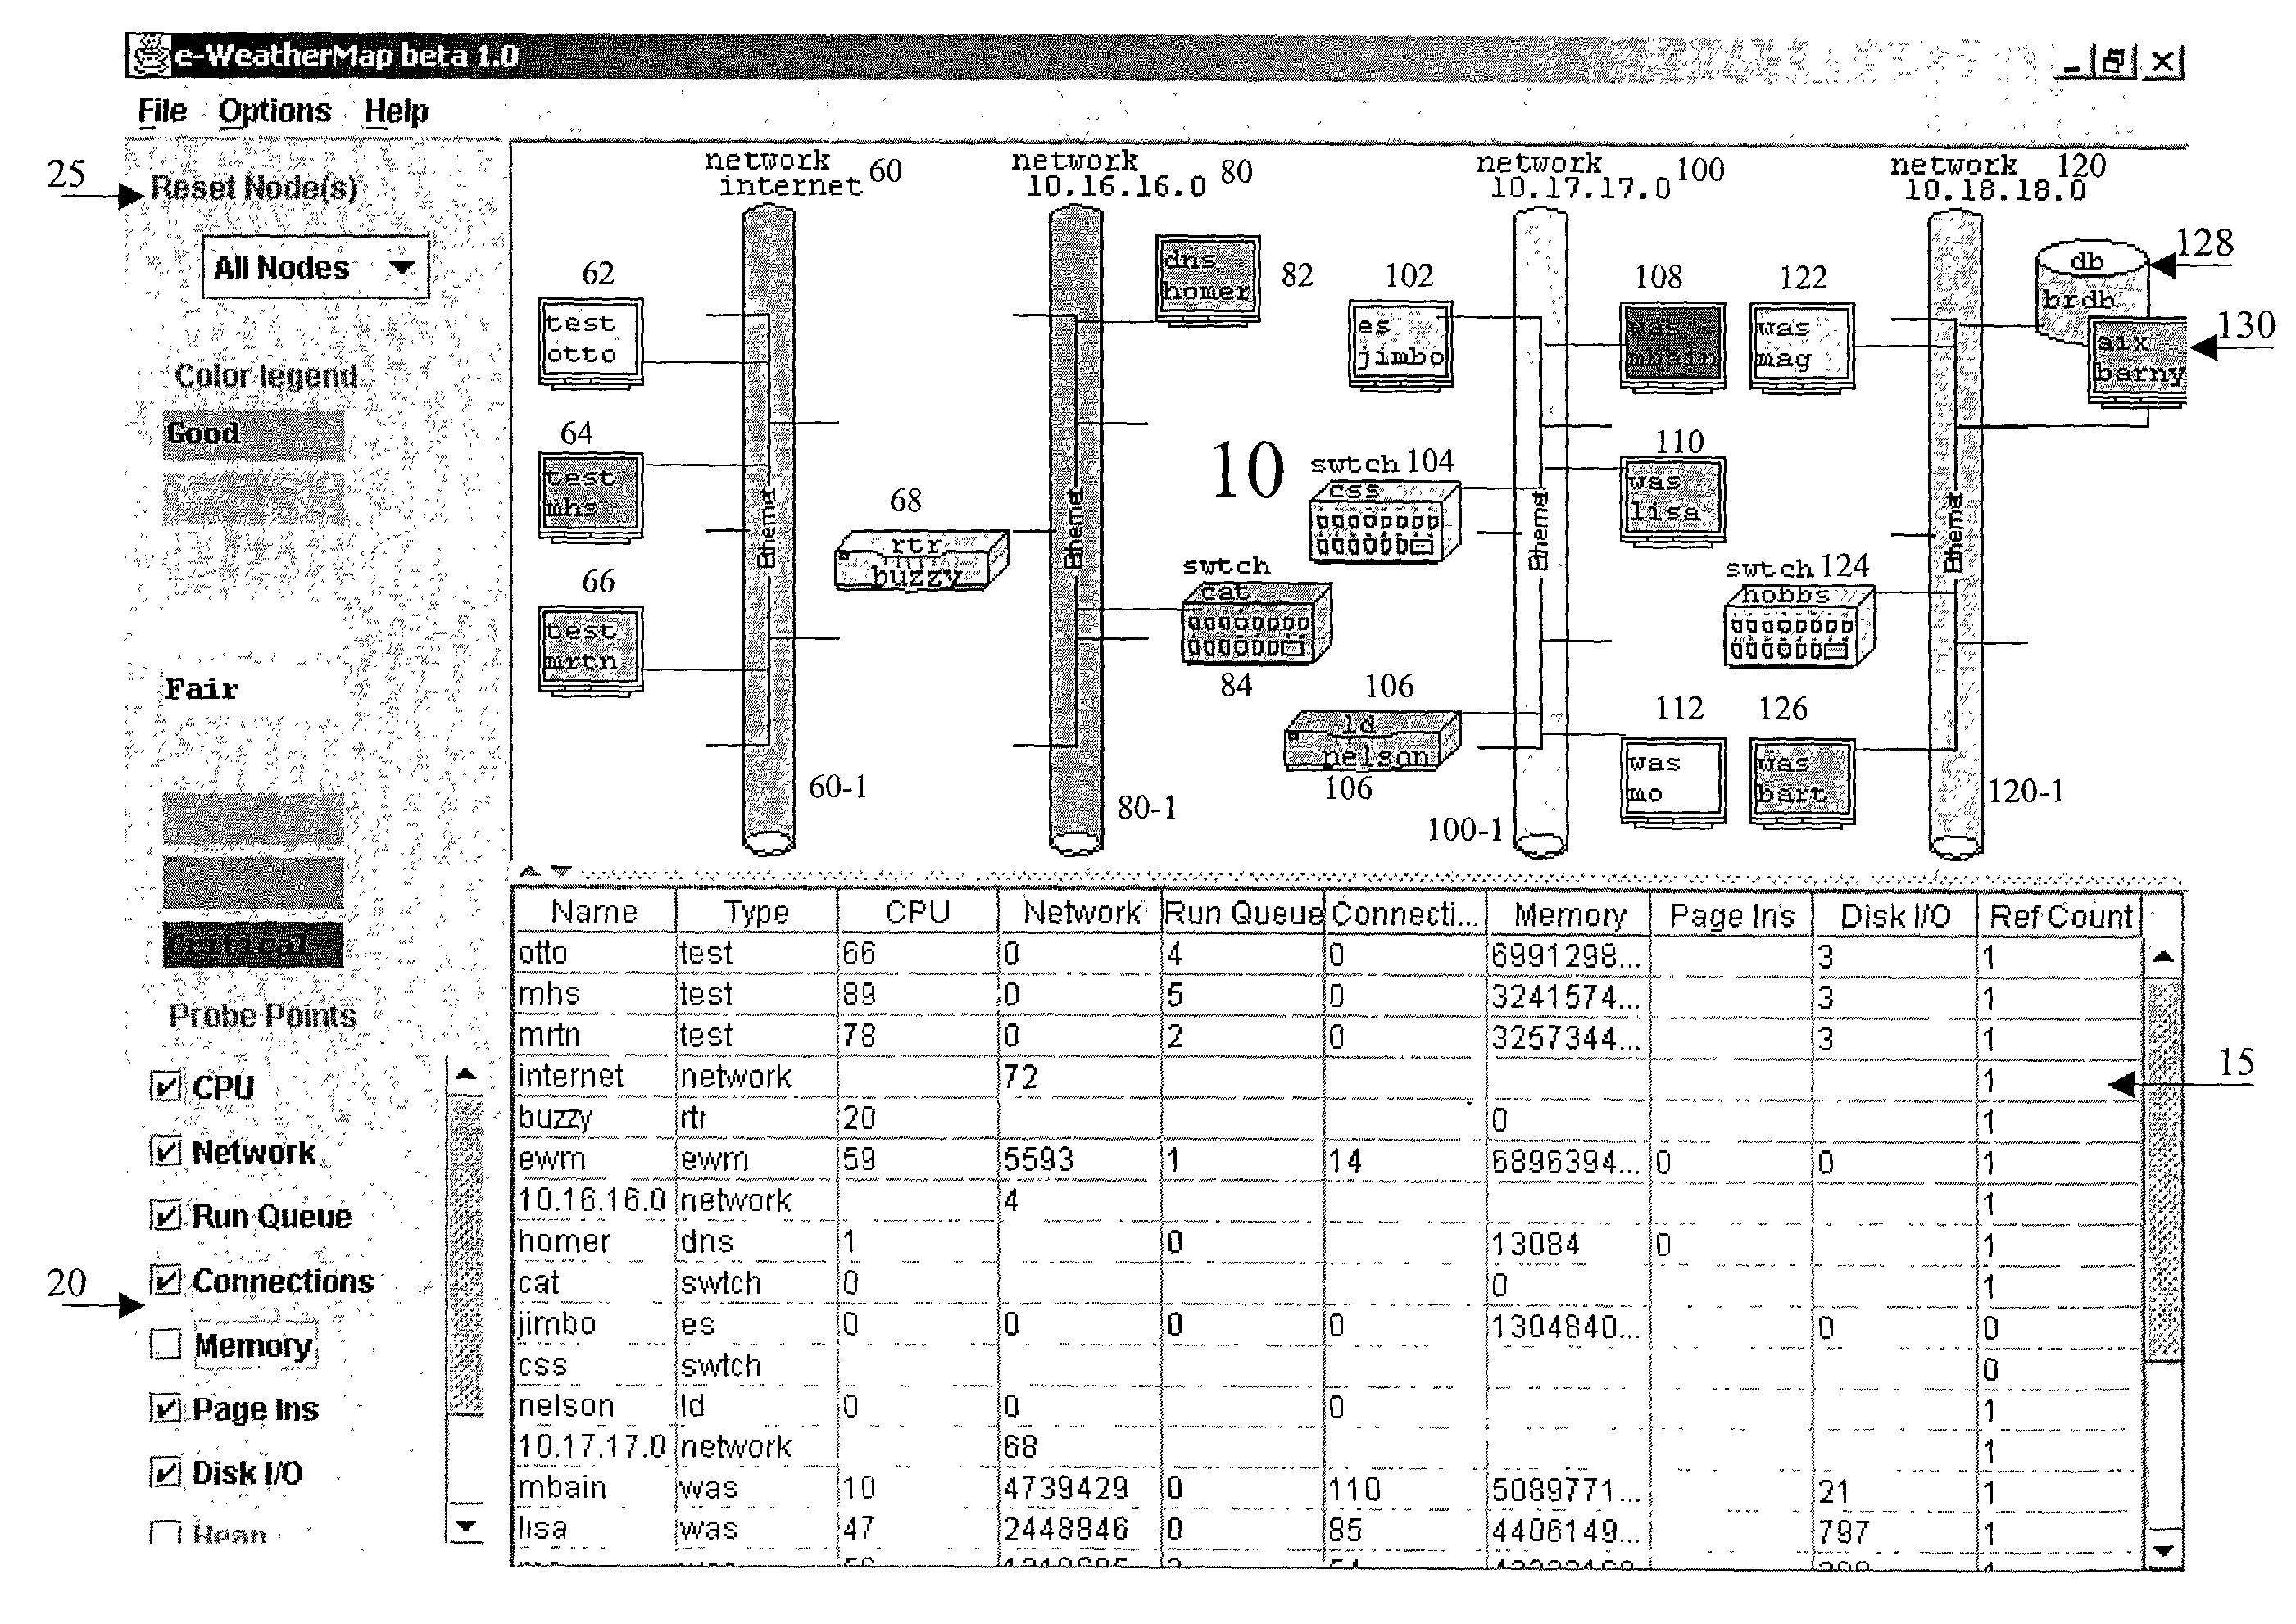
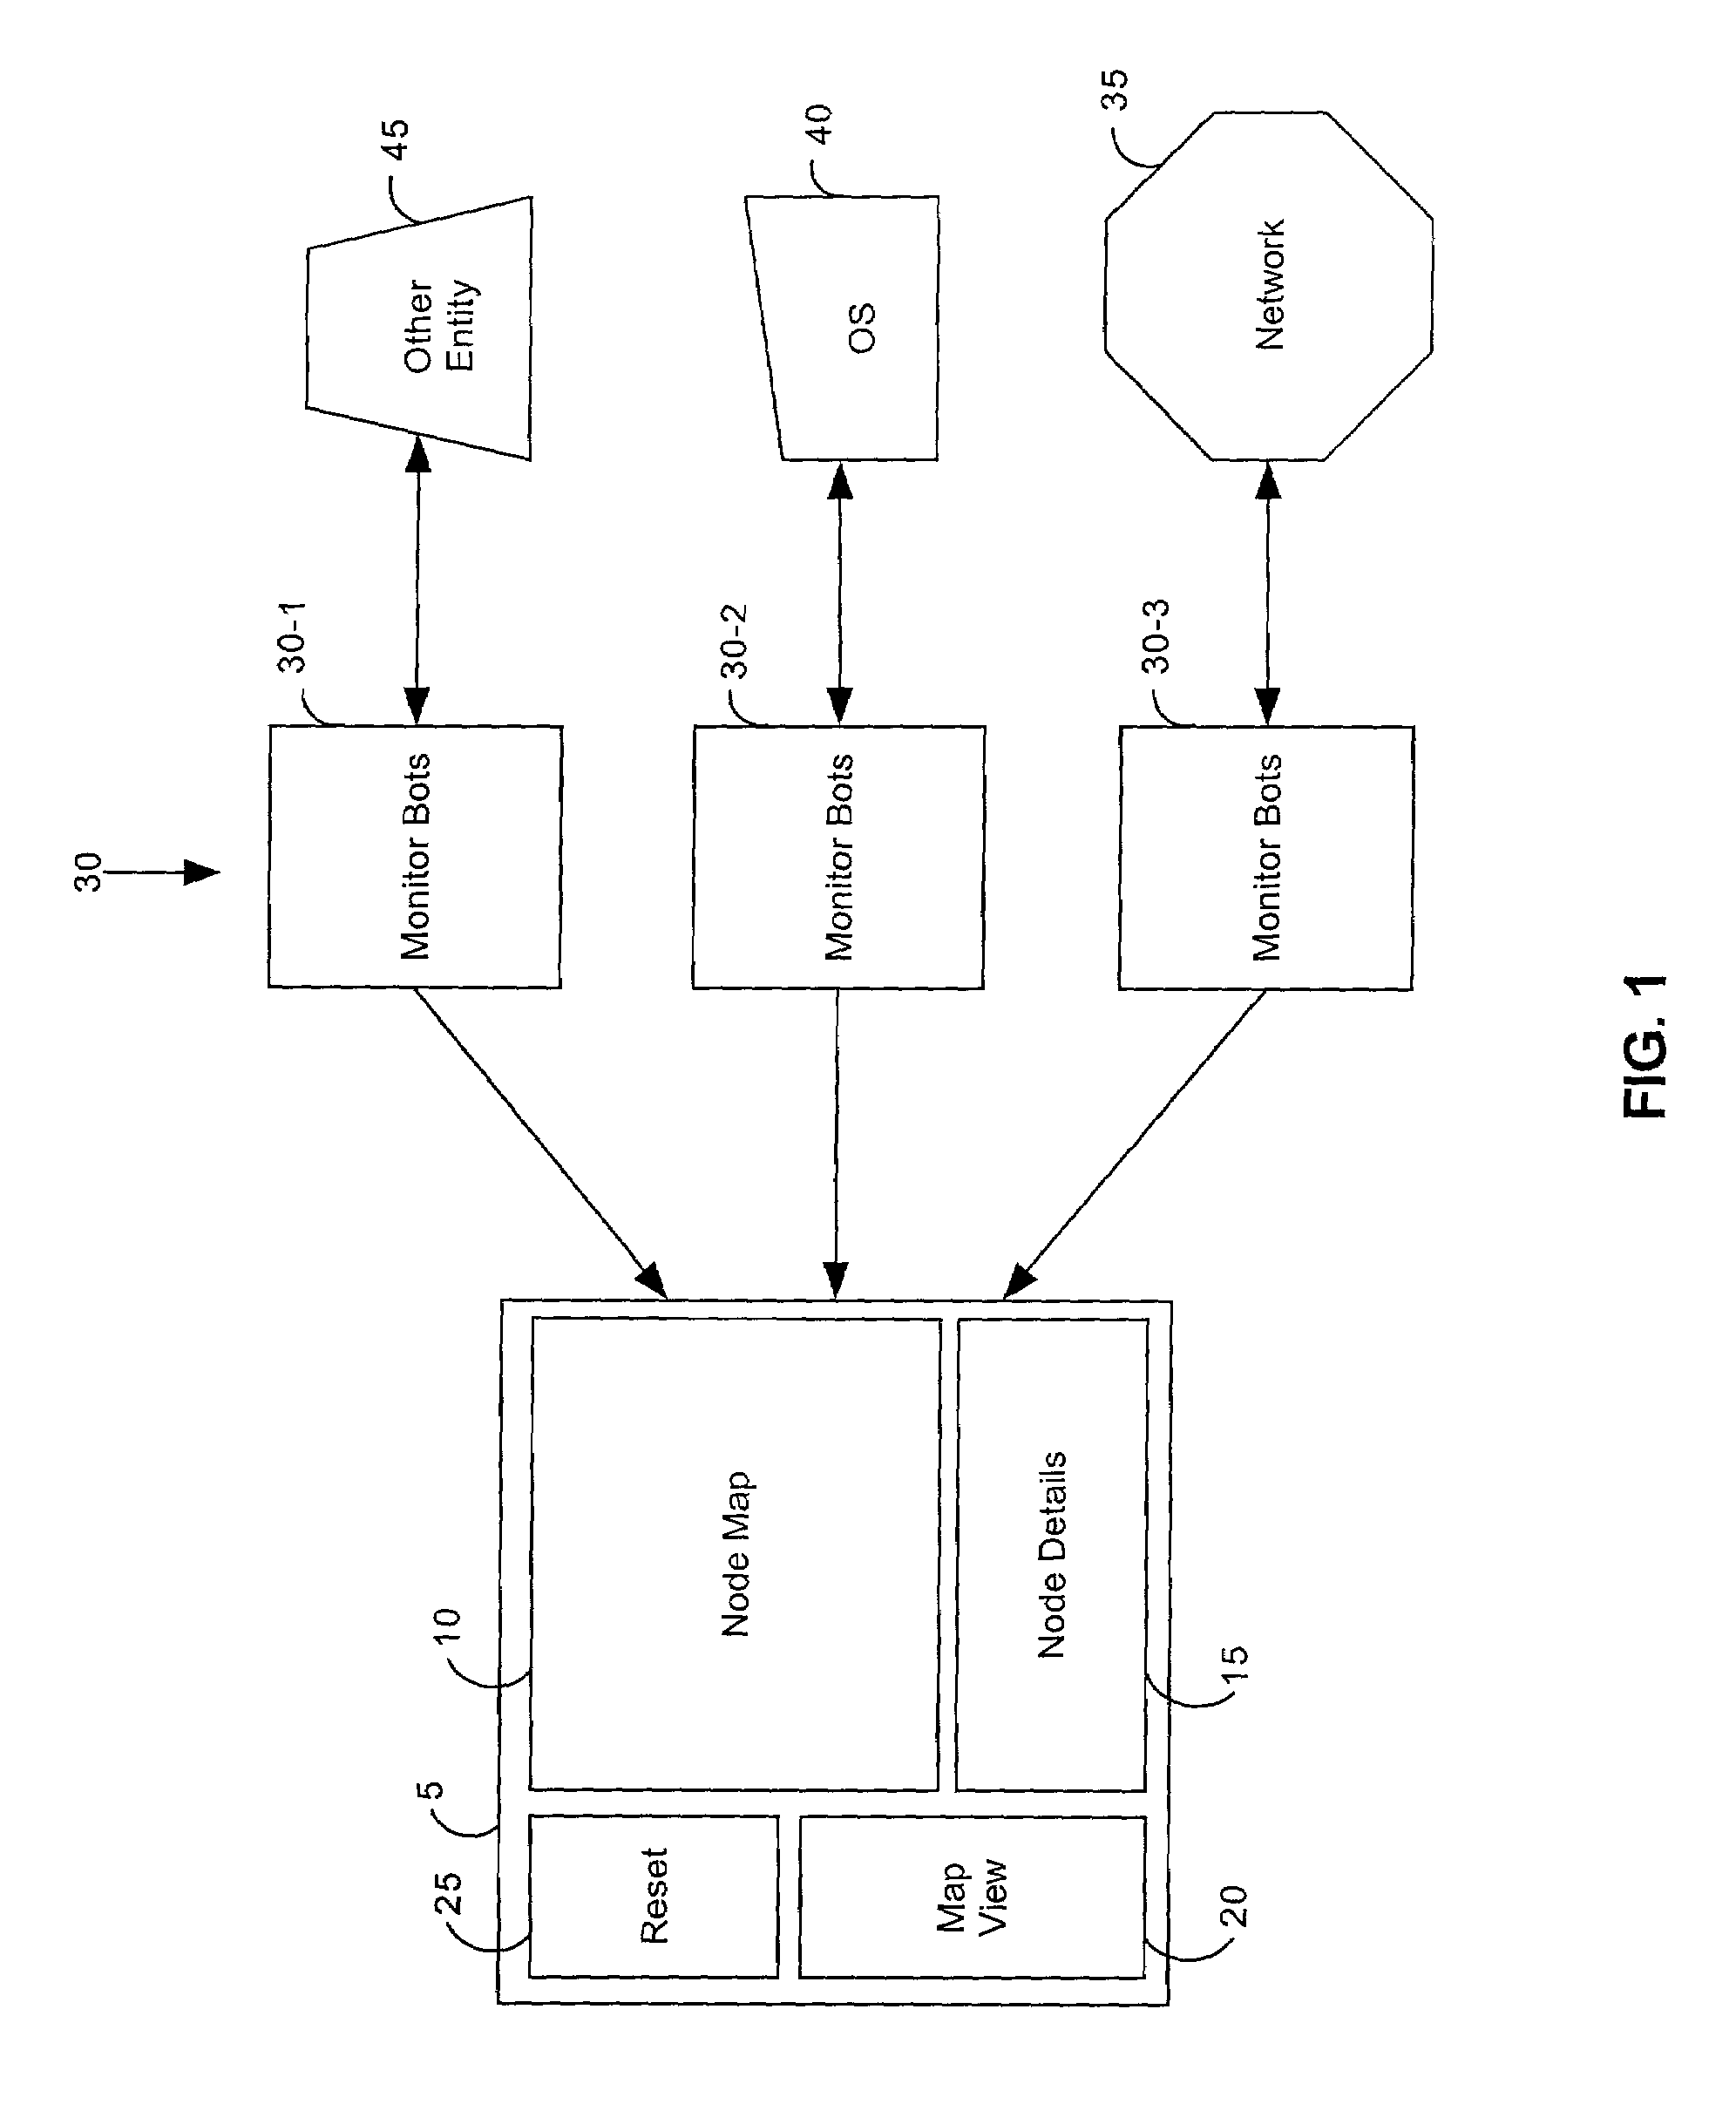
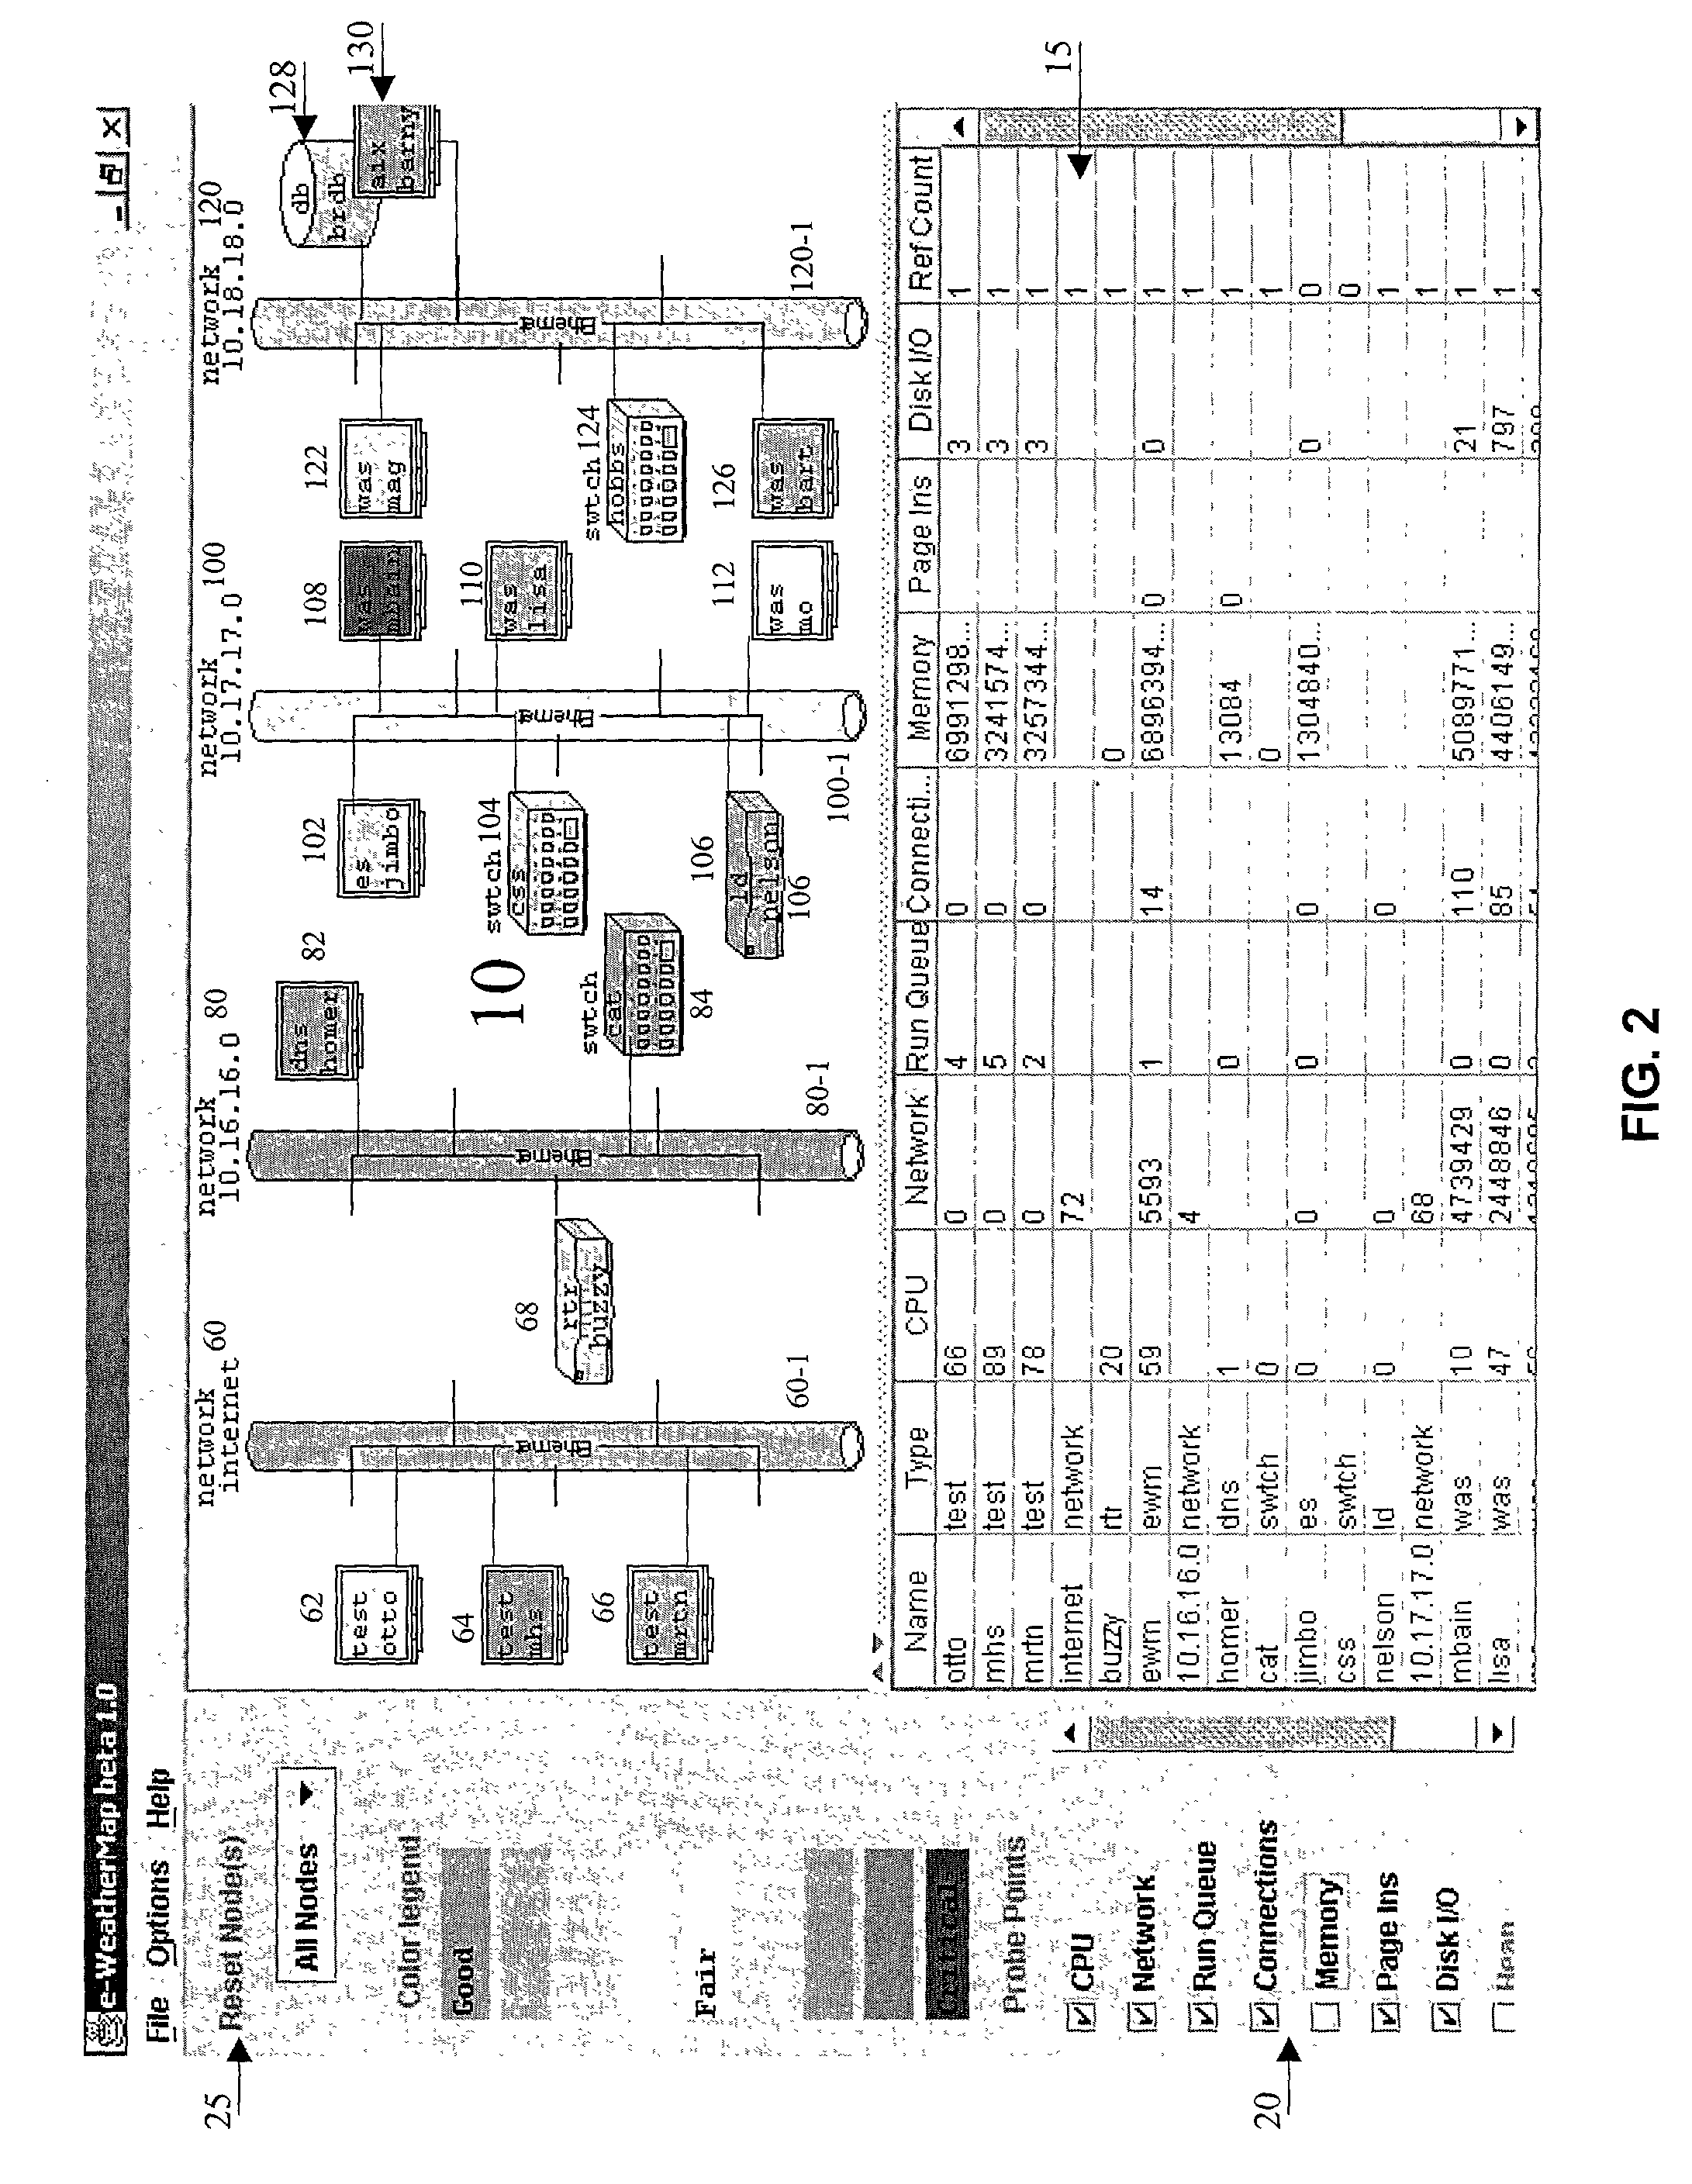
[0022]The invention discloses a method and system for dynamically monitoring and visualizing realtime data metrics in complex heterogeneous systems. The performance of entities or components in a complex heterogeneous system can be monitored and visualized by collecting and displaying performance metrics in realtime on a graphical display map. Complex heterogeneous systems are systems that contain numerous diverse components and entities and seamlessly interoperate to provide one or more functions. Complex heterogeneous systems can include, but is not limited to, any combination of CDNs, computer networks, operating systems, databases, and communication systems. Data metrics are standards of measurements that can be used for mathematical or statistical analysis of these types of systems. Within a complex heterogeneous system, attributes of the metrics can be defined for the various components and entities within the system.

[0023]An attribute can be a specific type of data metric. Th...


PUM


Abstract

The present invention discloses a method and apparatus for dynamically monitoring and visualizing metrics within a system that has values which change over time. The values associated with these metrics can be specific to entities within the system or they can be common system-wide metrics. Various attributes can be defined for the metrics to be visualized. The values can then be determined in conformance with these defined data attributes. The values can be mapped to appropriate unique indicators which can be used to represent a visual indication of the determined value. The graphical representation of the entities within the system can be displayed along with unique indicator used to represent the value associated with the metric to be displayed. The metrics to be displayed can be selected from a list. Additionally, the measurements can be periodically made and the display accordingly updated.

Description

BACKGROUND OF THE INVENTION[0001]1. Technical Field[0002]The present invention relates to the field of data monitoring and presentation, and more particularly, to a method and apparatus for visualizing metrics within a system on a single map display.[0003]2. Description of the Related Art[0004]Monitoring system performance can provide engineers and system operators with time critical information that can often help to alleviate or avert catastrophe and also design better systems. This is especially true for complex heterogeneous systems. Complex heterogenous systems are systems that can have entities and components that are diverse in their functionality and operability. In these complex heterogenous systems, it can often be necessary to monitor metrics defined for these systems in order to ensure that the components or entities in the system are functioning optimally. A metric is a standard of measurement that can be used for mathematical or statistical analysis. Metrics can includ...

Claims


Application Information

Patent Timeline
Patent Type & Authority Patents(United States)
IPC IPC(8): G06F3/00G06F15/173G06F11/32
CPCG06F11/323
Inventor HAND, LEONARD S.WASHBURN, JEFFERY R.
Owner IBM CORP
Why Eureka
Try Eureka