

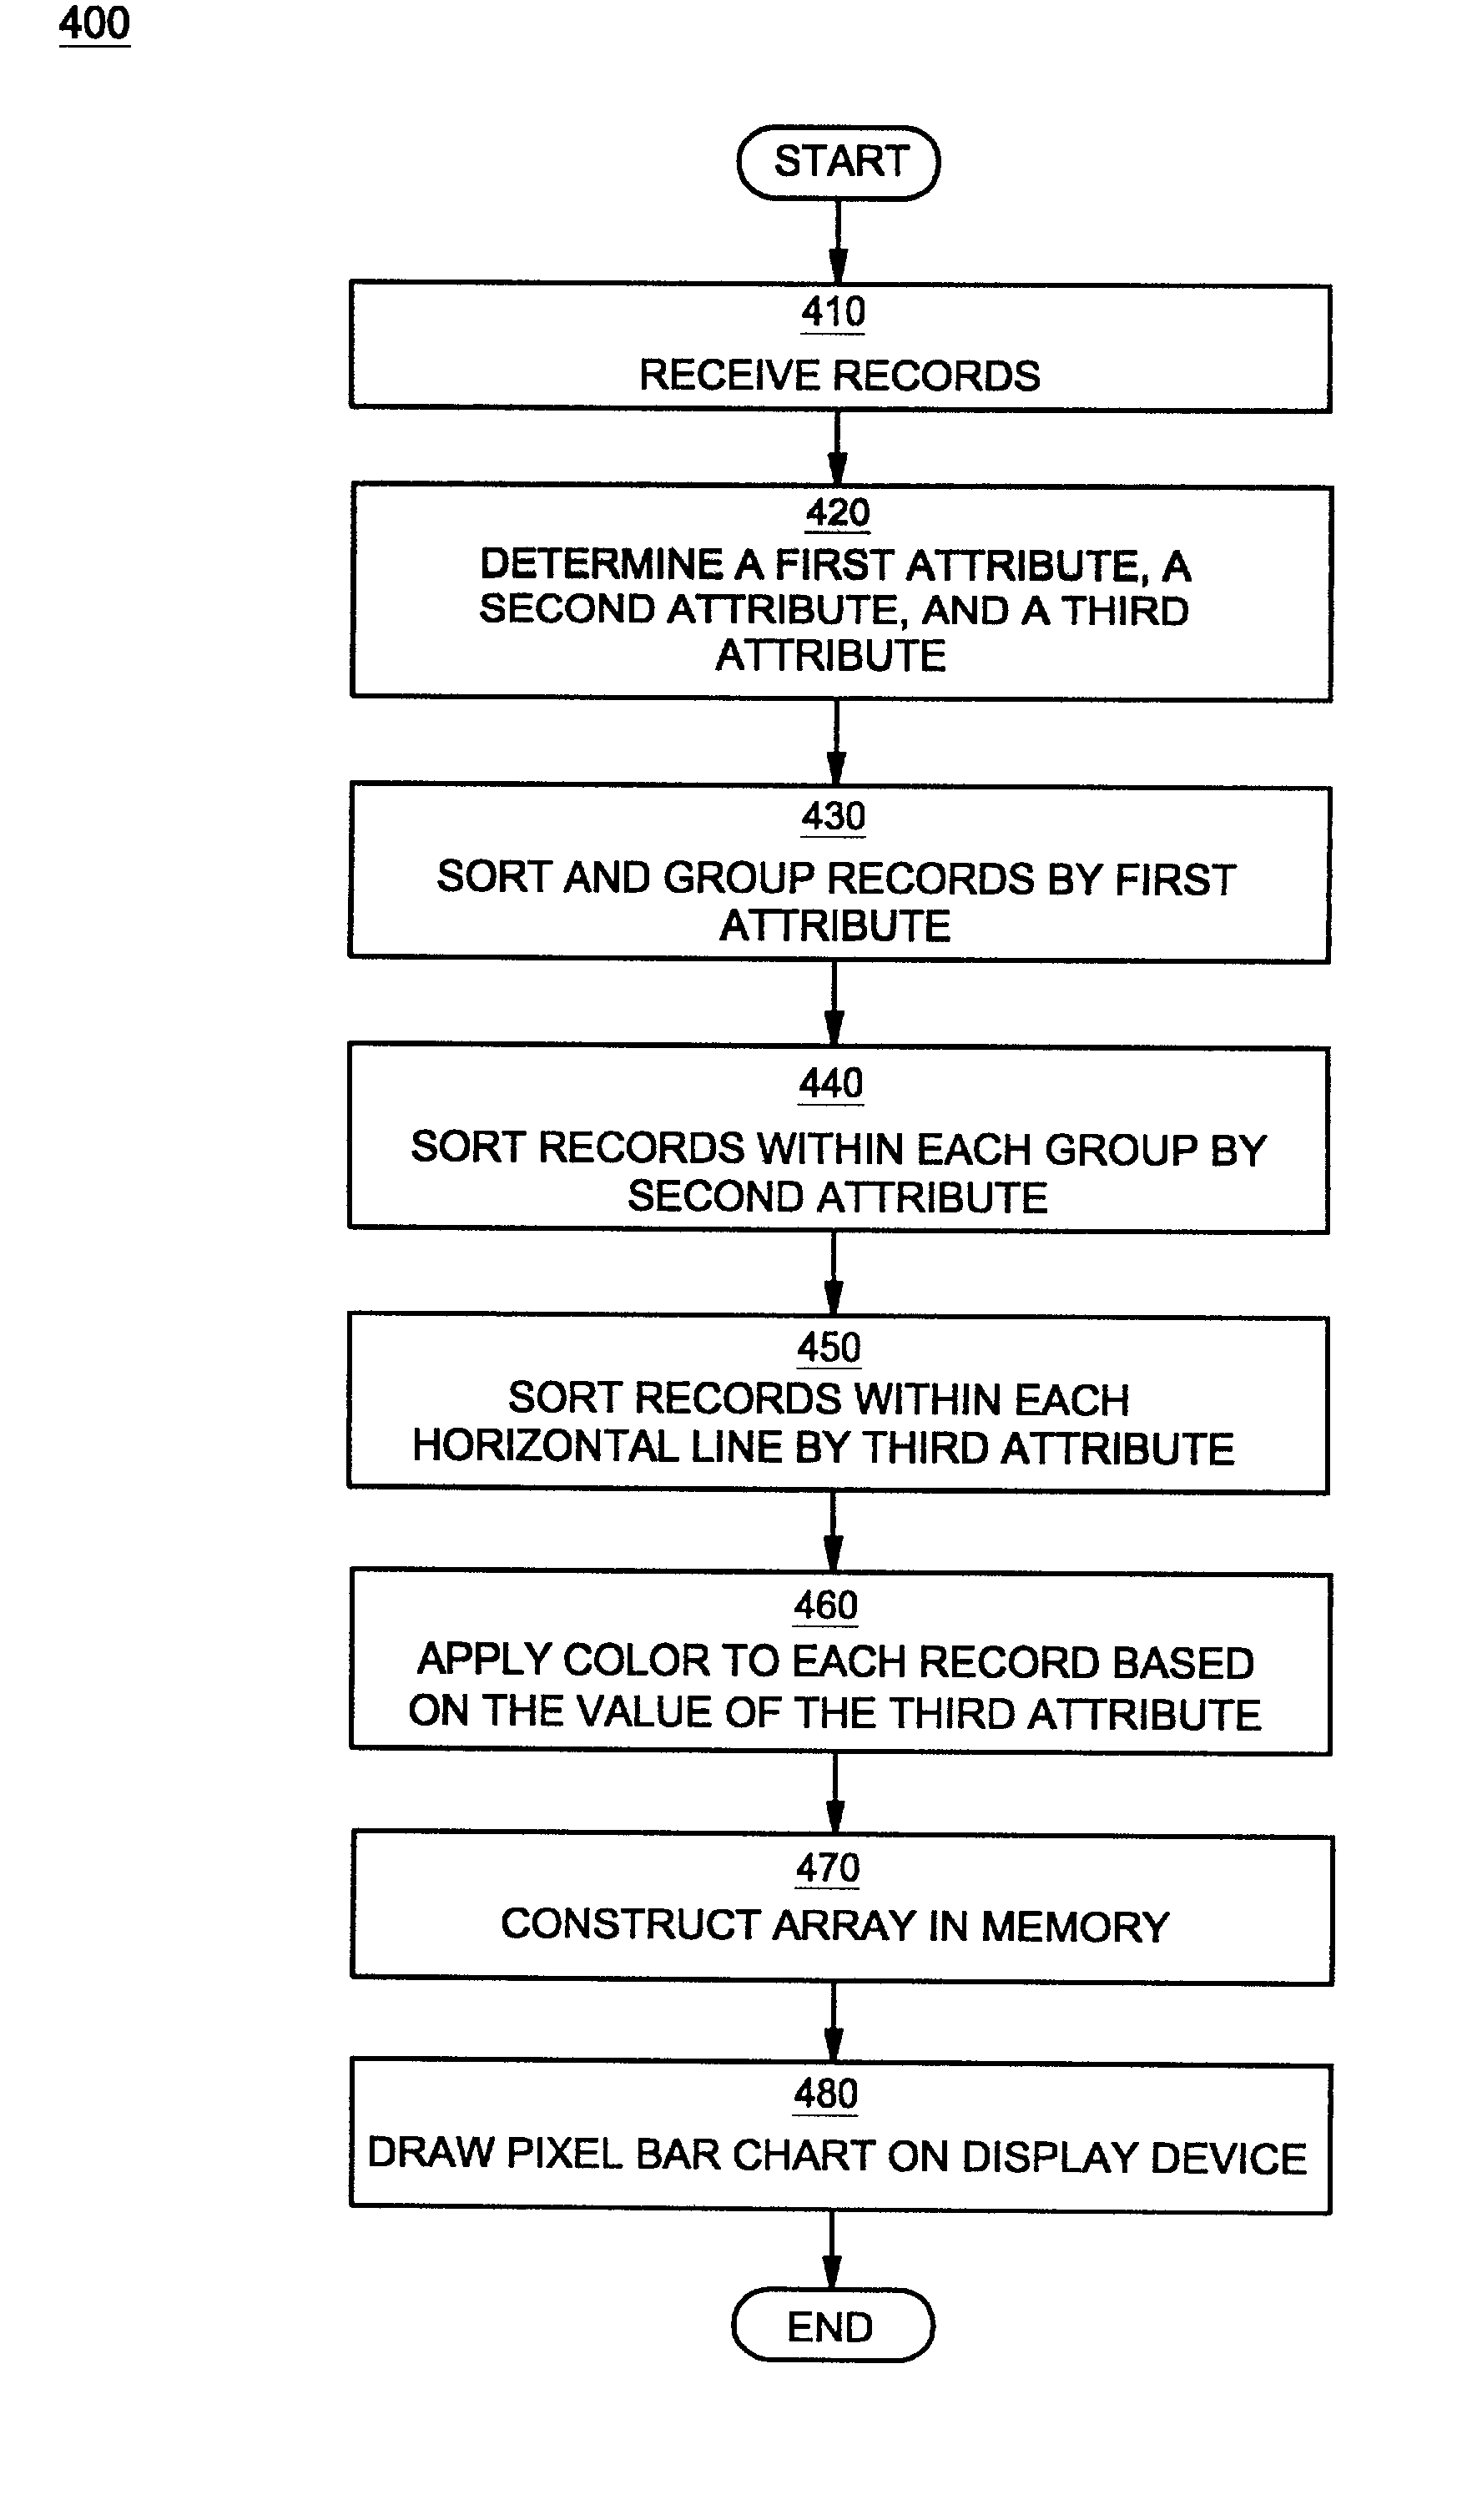
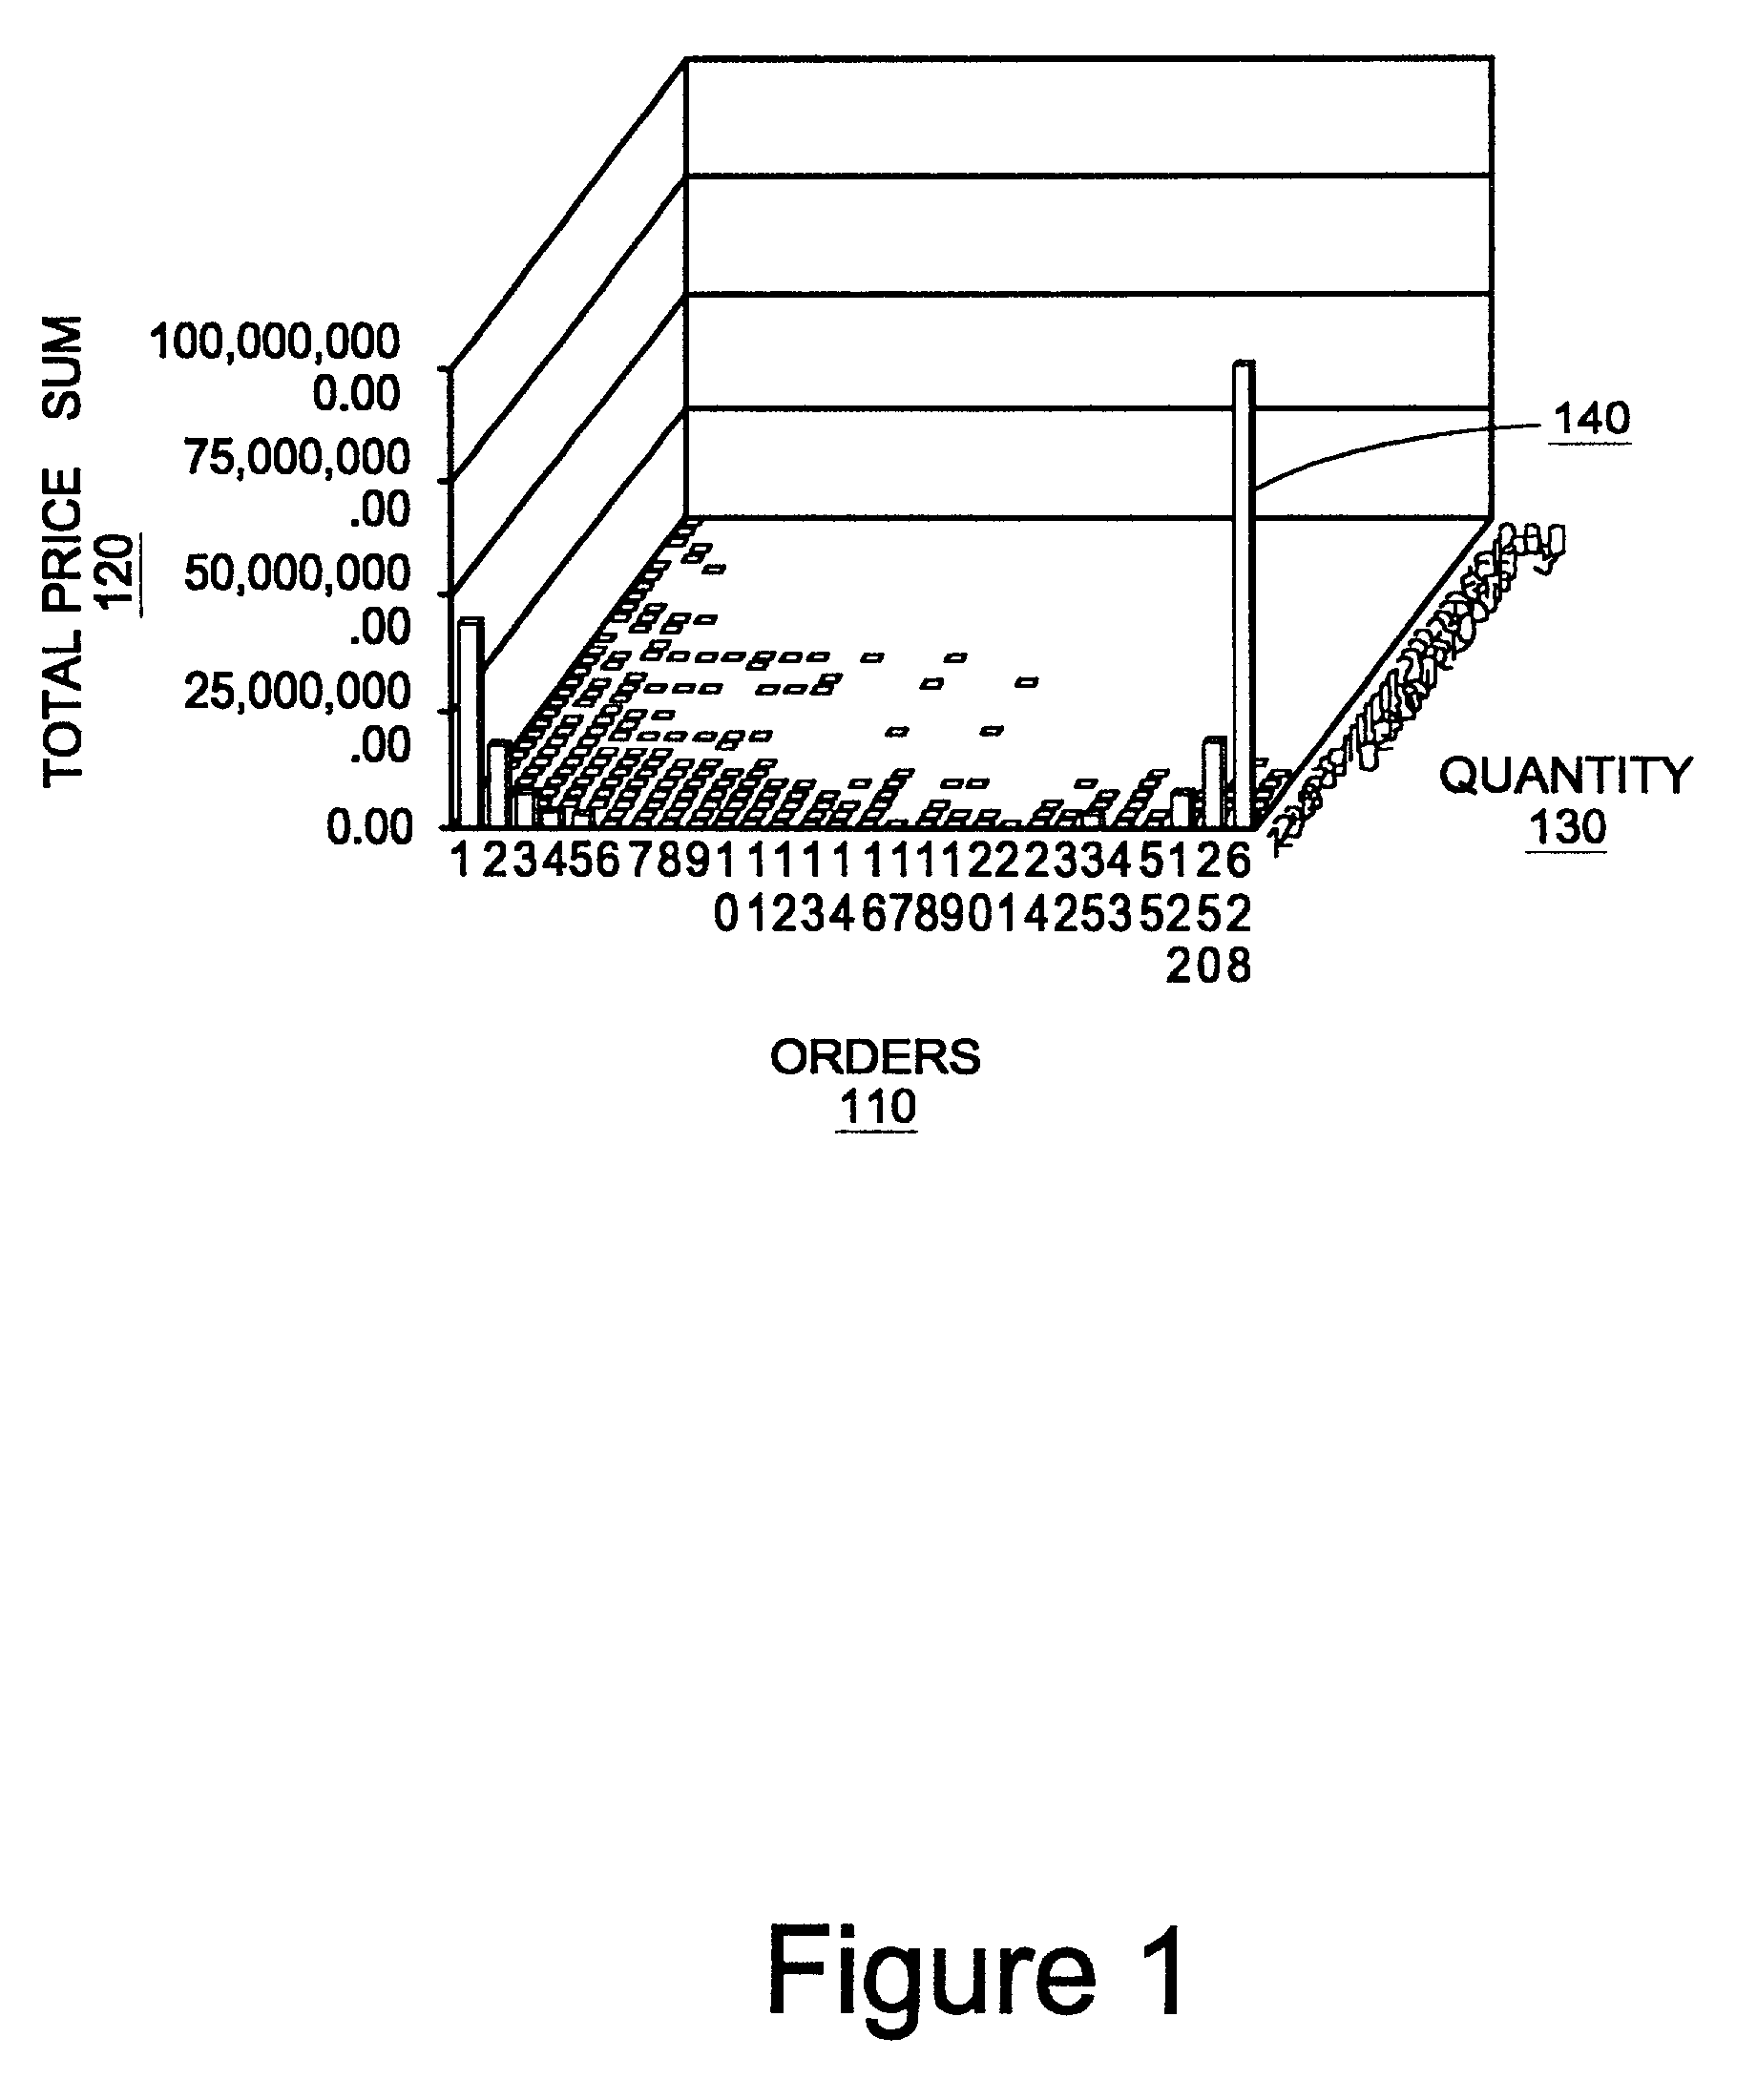
Method for visualizing large volumes of multiple-attribute data without aggregation using a pixel bar chart
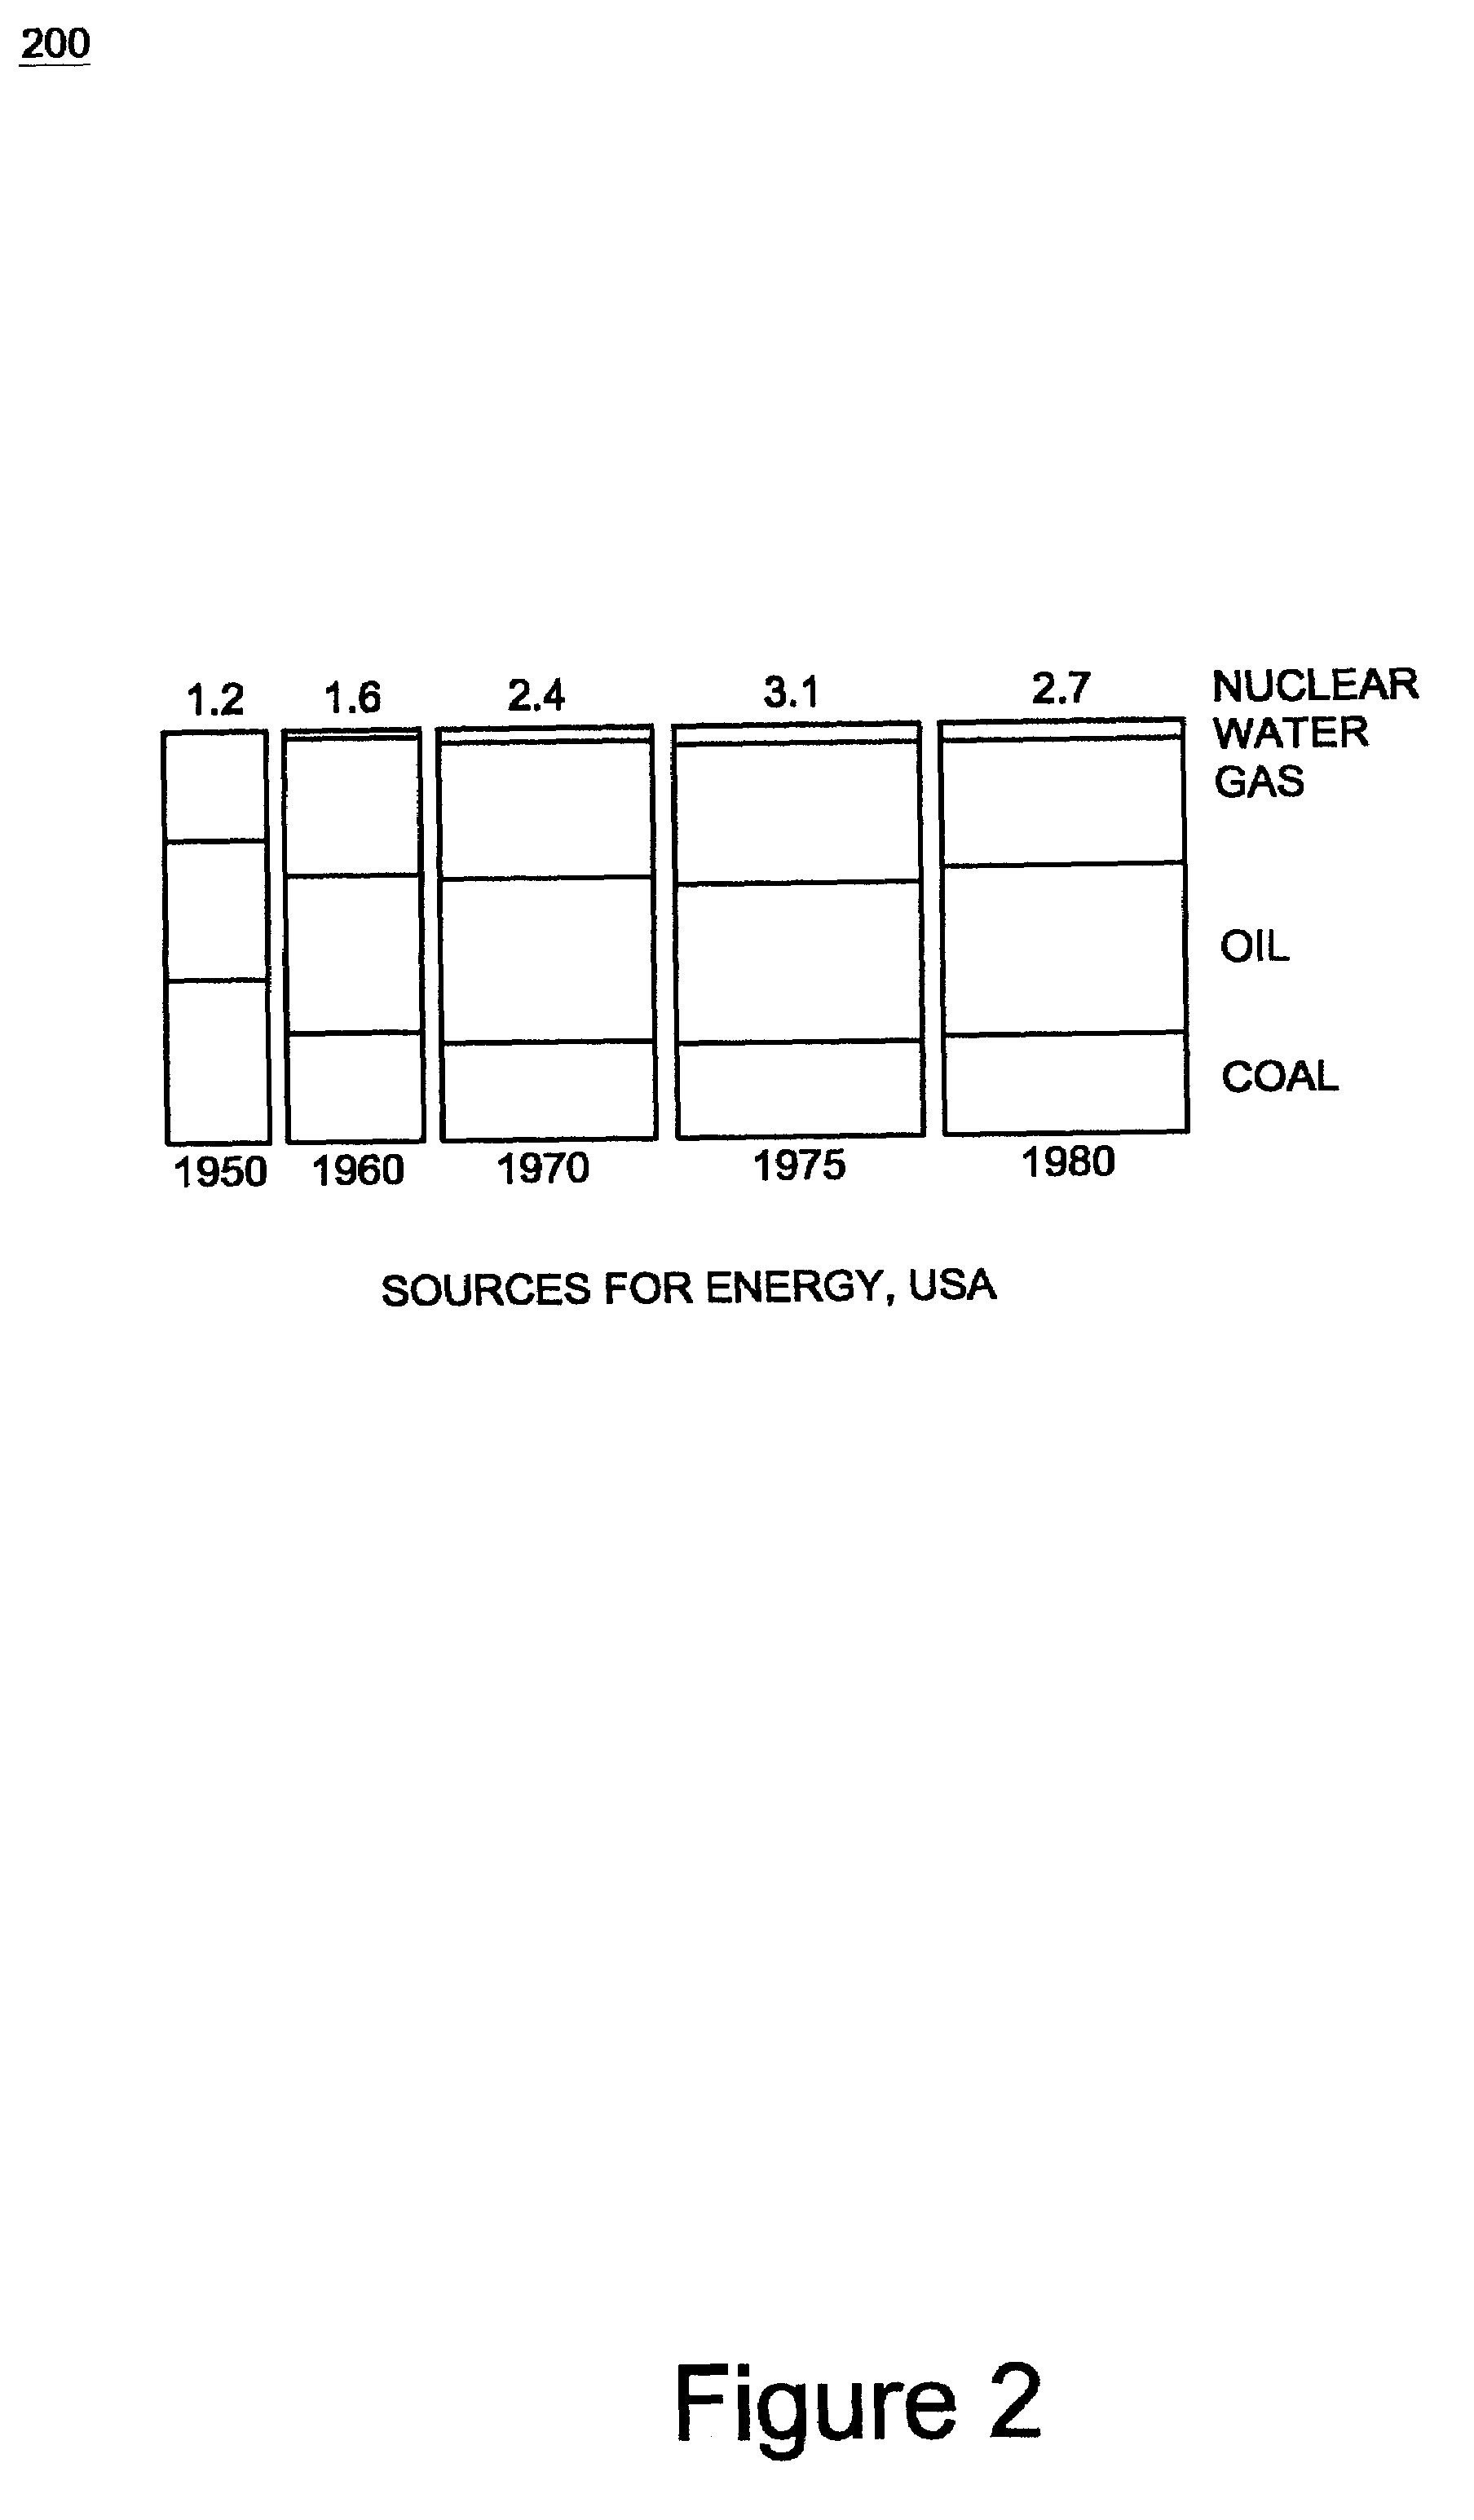
a data with multiple attributes and pixel bar chart technology, applied in the field of data visualization, can solve the problems of large data interpretation challenges for those responsible for understanding data, misleading visual impressions, and often losing valuable information
- Summary
- Abstract
- Description
- Claims
- Application Information
AI Technical Summary
Problems solved by technology
Method used
Image

Examples
Embodiment Construction
[0022]In the following detailed description, for purposes of explanation, numerous specific details are set forth in order to provide a thorough understanding of the present invention. However, it will be apparent to one skilled in the art that the present invention may be practiced without these specific details. In other instances, well-known structures and devices are not described in detail in order to avoid obscuring aspects of the present invention.
[0023]Some portions of the detailed descriptions which follow are presented in terms of procedures, steps, logic blocks, processing, and other symbolic representations of operations on data bits within a computer memory. These descriptions and representations are the means used by those skilled in the data processing arts to most effectively convey the substance of their work to others skilled in the art. A procedure, computer executed step, logic block, process, etc., is here and generally conceived to be a self-consistent sequence...
PUM
 Abstract
Description
Claims
Application Information