Systems and methods for phase measurements

a technology of phase measurement and system, applied in the field of system and method for phase measurement, can solve the problems of limited use of such techniques, inability to implement, and method cannot be fixed on a slab of material, and achieve the effect of accurately determining the dispersion properties of biological tissues and accurate measuremen

Inactive Publication Date: 2008-04-29
MASSACHUSETTS INST OF TECH
View PDF63 Cites 137 Cited by
  • Summary
  • Abstract
  • Description
  • Claims
  • Application Information

AI Technical Summary

Benefits of technology

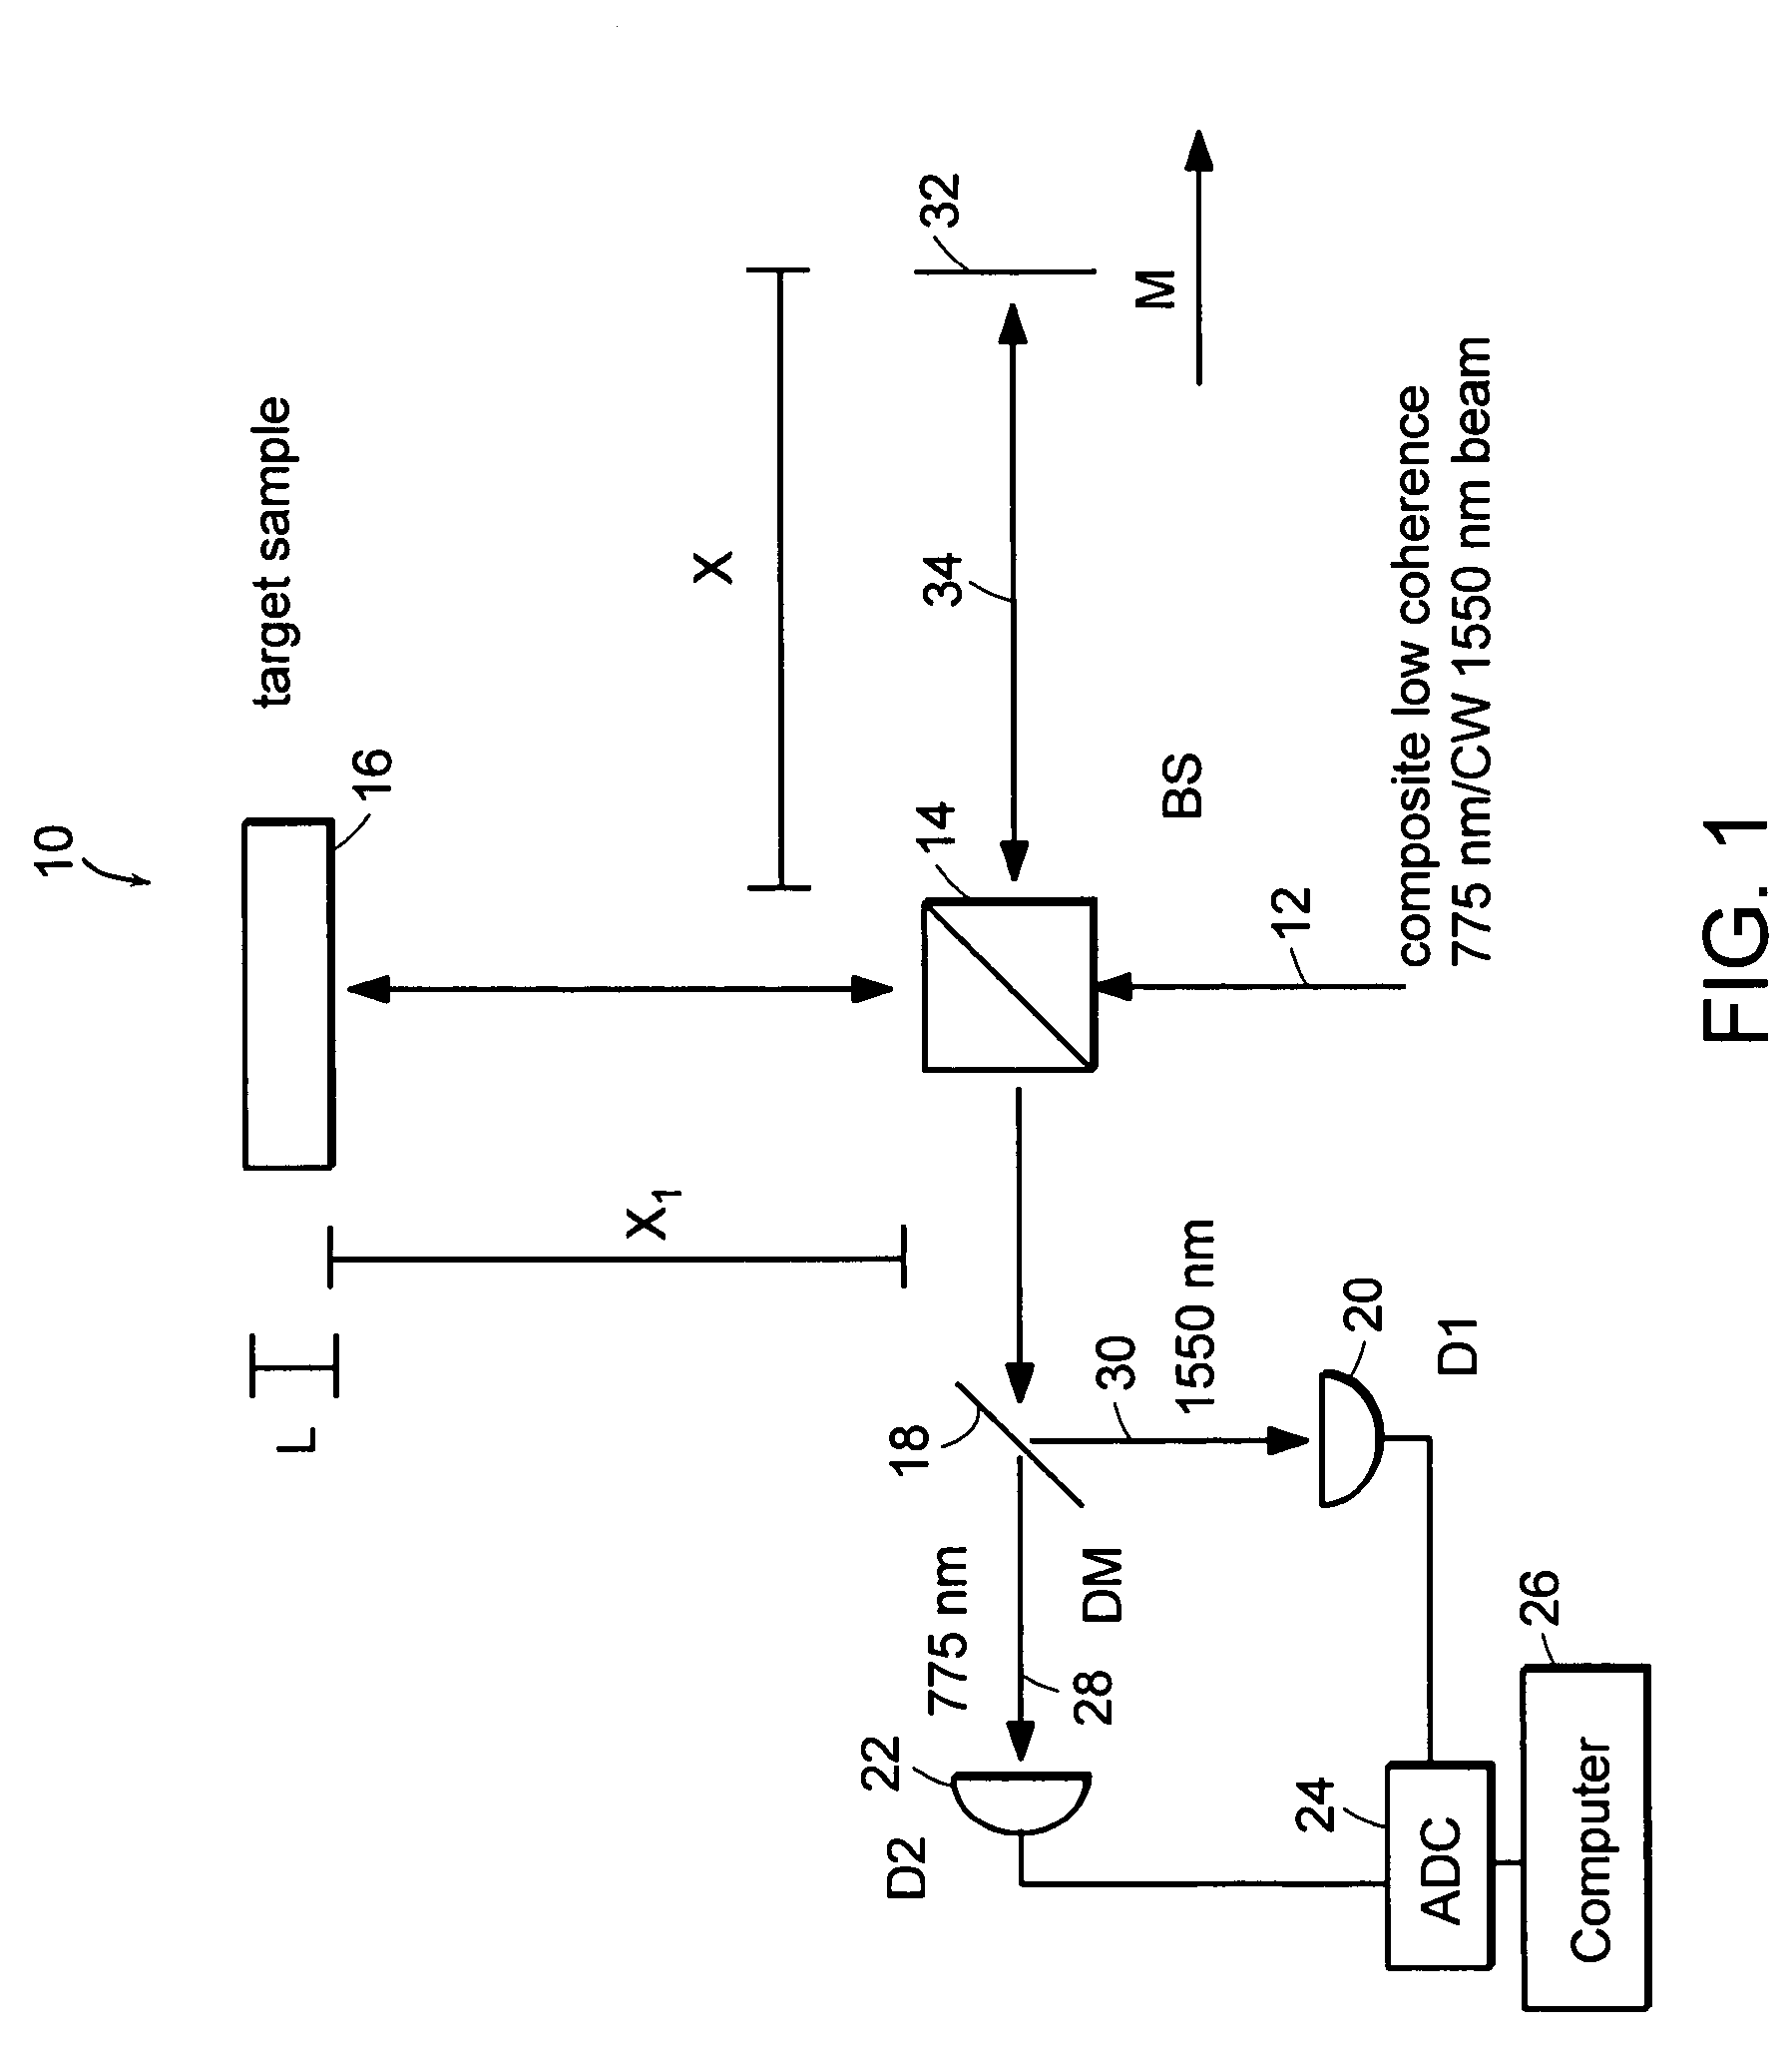
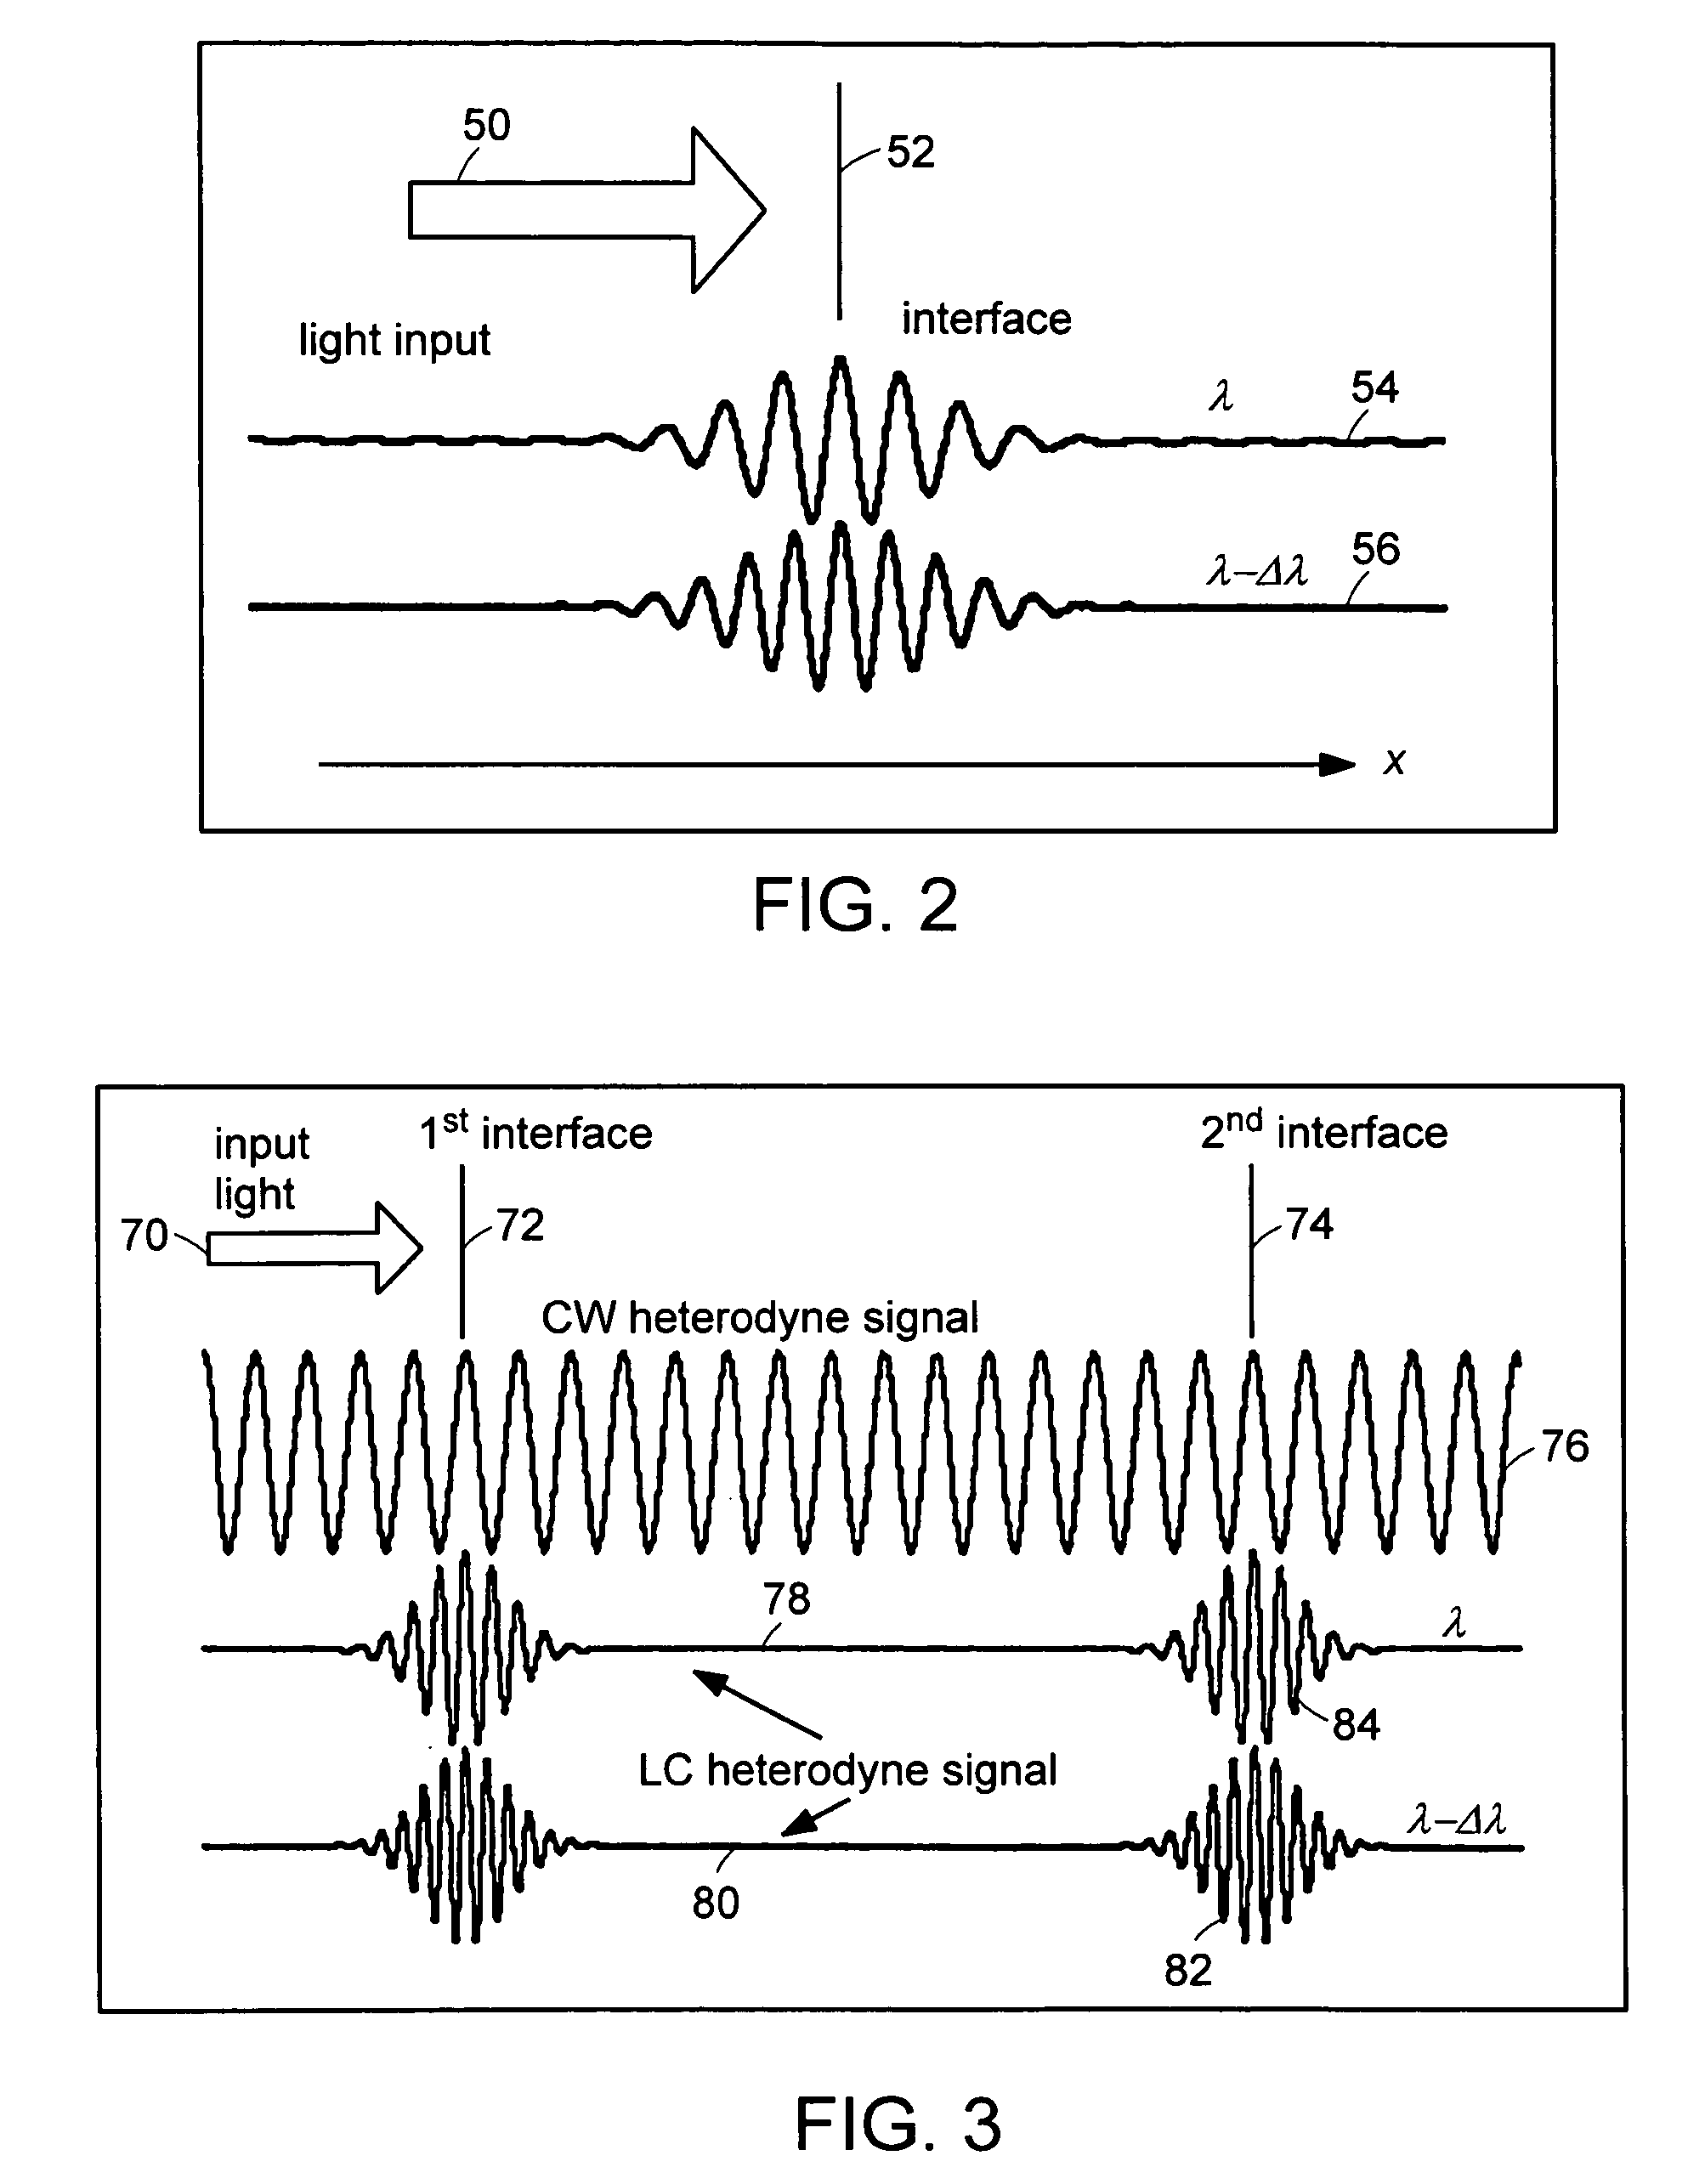
[0012]In a preferred embodiment, the methods of the present invention are directed at an accurate phase-based technique for measuring arbitrarily long optical distances, preferably with sub-nanometer precision. A preferred embodiment of the present invention employs an interferometer, for example, a Michelson interferometer, with harmonically related light sources, one continuous wave (CW) and a second source having low coherence (LC). The low coherence source provides a broad spectral bandwidth, preferably a bandwidth of greater than 5 nm for a 1 micron (μm) wavelength, for example, the required bandwidth can vary as a function of wavelength and application. By slightly adjusting the center wavelength of the low coherence source between scans of the target sample, the phase relationship between the heterodyne signals of the CW and low coherence light can be used to measure the separation between reflecting interfaces with sub-nanometer precision. As this method is completely free of 2π ambiguity, an issue that plagues most phase-based techniques, it can be used to measure arbitrarily long optical distances without loss of precision. An application of a preferred embodiment of the method of the present invention is the precision determination of the refractive index of a sample at a given wavelength of a sample with a known physical thickness. Another application of a preferred embodiment of the method of the present invention is the precision determination of a sample's physical thickness with a known refractive index. A further application of a preferred embodiment of the method of the present invention is the precision determination of the refractive index ratio at two given wavelengths.
[0014]The preferred embodiment methods can be used to make precise optical distance measurements. From such measurements, optical properties of target objects can be accurately measured. By measuring the dispersion profile of the target, structural and / or chemical properties of the target can be evaluated. The dispersion profile maps out the refractive index differences at various wavelengths. In the biomedical context, preferred embodiments of the present invention can be used to accurately determine the dispersion properties of biological tissues in a non-contact and non-invasive manner. Such dispersion determination can be used on the cornea or aqueous humor of the eye. The sensitivity achieved can be sufficient to detect glucose concentration dependent optical changes. In a preferred embodiment of the present invention method, the blood glucose level can be determined through non-invasive measurements of the dispersion profile of either the aqueous and / or vitreous aqueous humor or the cornea of the eye. A preferred embodiment of the present invention can be applied as a measurement technique in semiconductor fabrication to measure small features formed during the manufacturing of integrated circuits and / or optoelectronic components. As the preferred embodiment of the method is non-contact and non-destructive, it can be used to monitor the thickness of semiconductor structures or optical components as they are being fabricated.
[0023]Another aspect of the present invention includes a fiber optic probe for optically imaging a sample, having a housing with a proximal end and a distal end, a fiber collimator in the proximal end of the housing coupled to a light source; and a graded index lens in the distal end of the housing, the lens having a first and second surface wherein the first surface is the reference surface and wherein numerical aperture of the probe provides efficient light gathering from scattering surfaces of a sample. The probe further includes mounting the fiber optic probe on a translator stage to perform at least one of two-dimensional phase imaging and three-dimensional confocal phase imaging. The translator stage includes a scanning piezo translator. The numerical aperture of the probe is in a range of approximately 0.4 to 0.5.

Problems solved by technology

However, most such techniques are limited by an issue which is widely known in the filed at 2π ambiguity or integer ambiguity which can be defined as the difficulty in telling the interference fringes of an axial scan apart from each other.
While such a measurement approach works well in a controlled environment, it can hardly be implemented in a situation where there is less manipulability in the sample.
For example, the method does not work on a fixed slab of material which one is constrained to keep whole.
The problem lies in the fact that unmodified LCI is unable to tell the interference fringes of an axial scan apart from each other, described herein as the 2π ambiguity issue.
It is a problem that plagues most phase-based optical interferometric techniques.
As a result, these techniques are unable to determine optical distance absolutely.
One common problem in quantitative interferometry is the susceptibility to phase noise due to external perturbations such as vibrations, air motions, and thermal drafts.
Techniques such as phase contrast and Nomarski microscopy use optical phase just as a contrast agent and do not provide quantitative information about its magnitude.
However, little work has been done in nanometer-scale interferometry in weakly reflecting samples such as biological cells and tissues.
Optical coherence tomography (OCT), an interferometric technique used with biological samples, is primarily concerned with the amplitude rather than the phase of interference from reflected light, and is therefore limited in resolution to the coherence length of the light used, typically 2-20 microns.

Method used


Image

  • Systems and methods for phase measurements
  • Systems and methods for phase measurements
  • Systems and methods for phase measurements

Examples


example 1

Phase Imaging of a Calibrated Sample

[0330]In this example, a well calibrated sample has been investigated and illustrates that the present invention can provide quantitative information at the nanometer (nm) scale. The sample consisted of metal deposition on a glass substrate, followed by etching. The metal deposit pattern was in the shape of the numeral eight and the thickness of the metal layer was about 140 nm, as measured with a nano-profilometer.

[0331]FIGS. 60A-60D show images obtained at four different phase shifts δ for a system using a reflection geometry. FIG. 60A is an image 2000 for δ=0; FIG. 60B is an image 2200 for δ=π; FIG. 60C is an image 2400 for δ=π / 2; and FIG. 60D is an image 2600 for δ=3π / 2.

[0332]FIG. 61 schematically illustrates a relationship 2100 between the electric field E vector 2102 and the high frequency wave vector component of the field, EH, and the low frequency wave vector component of the field, EL. As illustrated in FIG. 61, the y-axis 2110 and the x...

example 2

Phase Imaging of a Phase Grating

[0336]FIG. 64 shows a phase image 2400 of a phase grating with grooves nominally 10 microns wide and nominally 266 nm deep that was obtained using a transmission geometry. In FIG. 64 the z-axis 2402 is in units of nm and the y-axis 2404 and x-axis 2406 are in the units of CCD pixels. The vertical scale bar 2408 is also in units of nm and is provided to further facilitate determining depth (z-axis dimension) from the phase image 2400.

example 3

Phase Imaging of Onion Cells

[0337]In this example, onion cells were phase imaged using a transmission geometry in accordance with the present invention. An intensity image 2500 of the onion cells is shown in FIG. 65 for comparison to a phase image 2550 shown in FIG. 65. In both FIGS. 65 and 66 the y-axes 2502, 2552 and x-axes 2504, 2554 are in units of CCD pixels. The scale bar 2556 in FIG. 66 is in units of nm.

[0338]The intensity image, FIG. 65, represents the first acquired frame where there is no phase shift between the low and high frequency components δ=0. As shown by a comparison of FIGS. 65 and 66, a regular microscope (intensity) image has a very low contrast relative to the phase image obtained in accordance with the present invention. As seen in FIG. 66, the contrast is greatly enhanced in the phase image, where much finer structure of the cell can be distinguished. In addition, the information in the phase image is quantitative to a nanometer level precision and can be tr...


PUM

PropertyMeasurementUnit
coherence lengthaaaaaaaaaa
center wavelengthsaaaaaaaaaa

Abstract

Preferred embodiments of the present invention are directed to systems for phase measurement which address the problem of phase noise using combinations of a number of strategies including, but not limited to, common-path interferometry, phase referencing, active stabilization and differential measurement. Embodiment are directed to optical devices for imaging small biological objects with light. These embodiments can be applied to the fields of, for example, cellular physiology and neuroscience. These preferred embodiments are based on principles of phase measurements and imaging technologies. The scientific motivation for using phase measurements and imaging technologies is derived from, for example, cellular biology at the sub-micron level which can include, without limitation, imaging origins of dysplasia, cellular communication, neuronal transmission and implementation of the genetic code. The structure and dynamics of sub-cellular constituents cannot be currently studied in their native state using the existing methods and technologies including, for example, x-ray and neutron scattering. In contrast, light based techniques with nanometer resolution enable the cellular machinery to be studied in its native state. Thus, preferred embodiments of the present invention include systems based on principles of interferometry and / or phase measurements and are used to study cellular physiology. These systems include principles of low coherence interferometry (LCI) using optical interferometers to measure phase, or light scattering spectroscopy (LSS) wherein interference within the cellular components themselves is used, or in the alternative the principles of LCI and LSS can be combined to result in systems of the present invention.

Description

CROSS REFERENCES TO RELATED APPLICATIONS[0001]The present application is a continuation-in-part of U.S. patent application Ser. No. 10 / 024,455, filed Dec. 18, 2001 now U.S. Pat. No. 6,934,035, and claims the benefit of U.S. Provisional Application No. 60 / 479,732, filed Jun. 19, 2003. The entire contents of the above applications are incorporated herein by reference in their entirety.GOVERNMENT SUPPORT[0002]The invention was supported, in whole or in part, by a Grant No. P41-RR02594 from the National Institutes for Health. The Government has certain rights in the invention.BACKGROUND OF THE INVENTION[0003]Phase-based optical interferometric techniques are widely employed in optical distance measurements in which sub-wavelength distance sensitivity is required. Optical distance is defined as the product of the refractive index and the length. However, most such techniques are limited by an issue which is widely known in the filed at 2π ambiguity or integer ambiguity which can be defin...

Claims


Application Information

Patent Timeline
Patent Type & Authority Patents(United States)
IPC IPC(8): G01B9/02G01B11/02G01J9/04G01N21/45
CPCG01N21/45A61B5/1455G01B9/02091G01B9/02007G01B9/02057G01B9/02002G01B9/02071G01B9/0209G01B9/02067G01B9/02011G01B9/02063G01B9/02069G01B9/02078G01B9/02083G01B9/02072A61B5/14532G01J9/04G01B2290/70G01B2290/60G01B2290/45A61B5/7232
Inventor FANG-YEN, CHRISTOPHER M.POPESCU, GABRIELYANG, CHANGHUEIWAX, ADAMDASARI, RAMACHANDRA R.FELD, MICHAEL S.
Owner MASSACHUSETTS INST OF TECH
Why Eureka
Try Eureka