Method of estimating trap from spectral reflectance factor
a spectral reflectance factor and trap technology, applied in the direction of colour-separation/tonal correction, digital marking record carriers, instruments, etc., can solve the problems of ink-water balance, ink transfer to unprinted paper is usually greater, and the tack of inks is not corr
- Summary
- Abstract
- Description
- Claims
- Application Information
AI Technical Summary
Benefits of technology
Problems solved by technology
Method used
Image
Examples
example 1
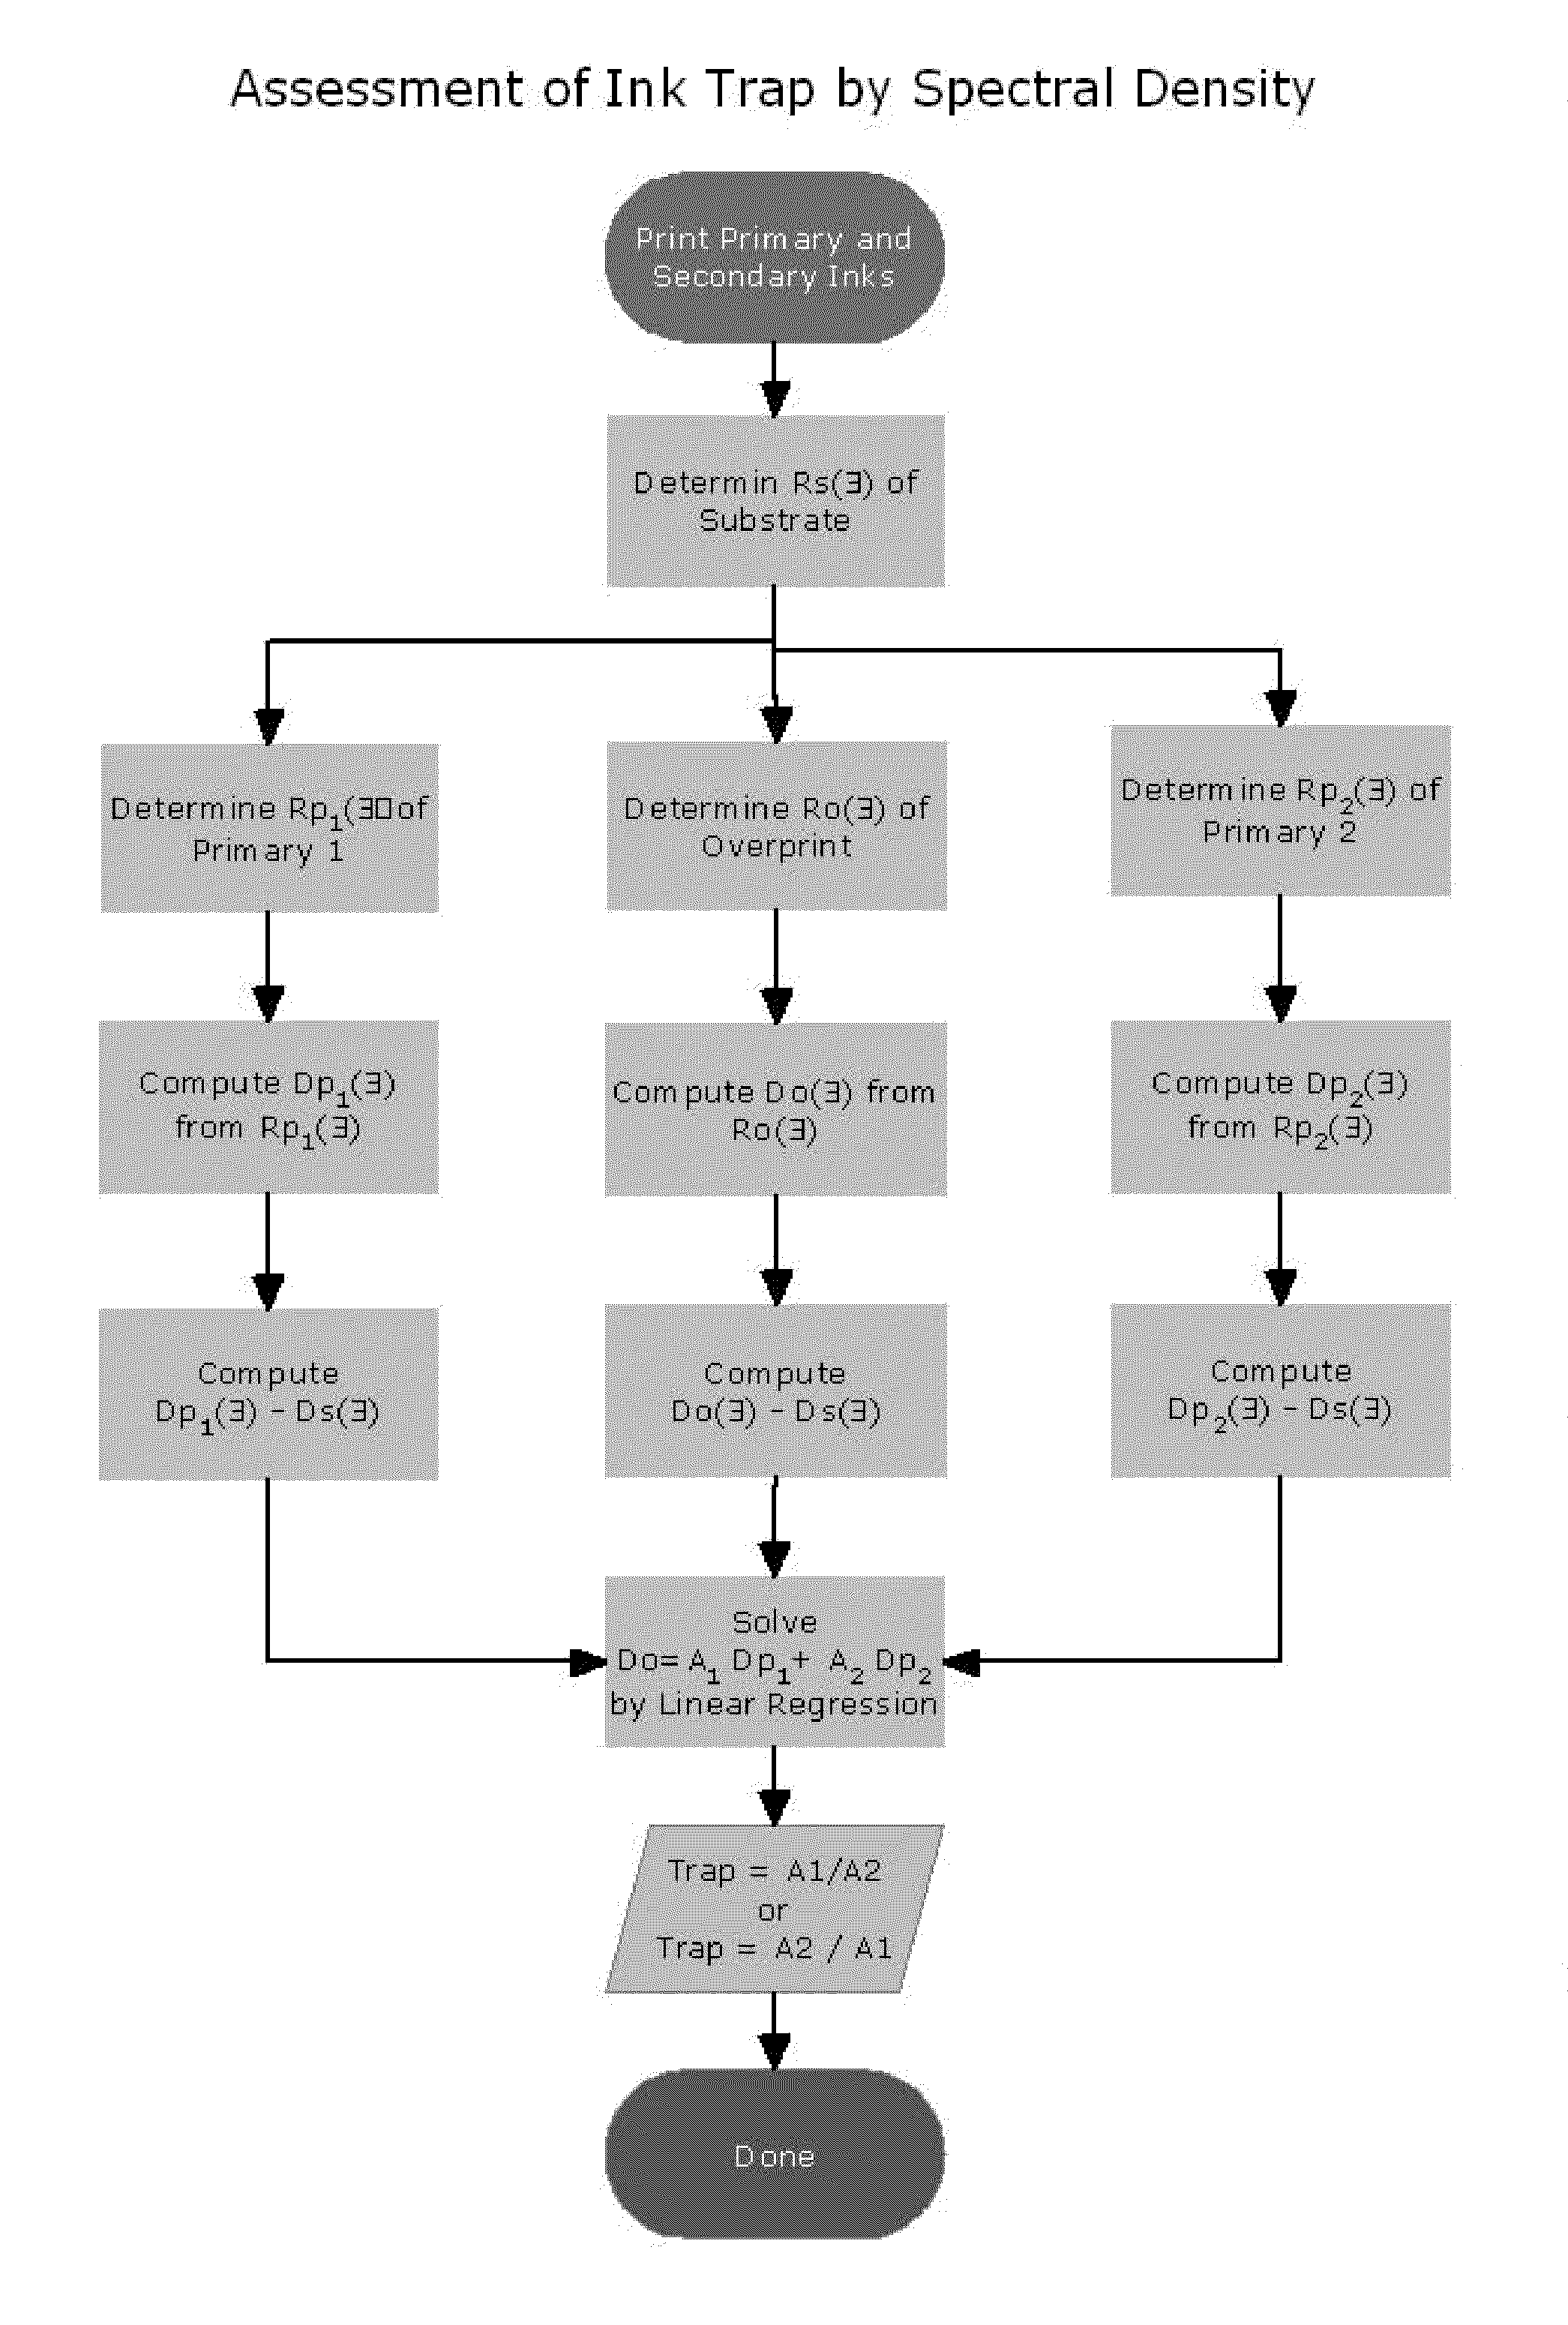
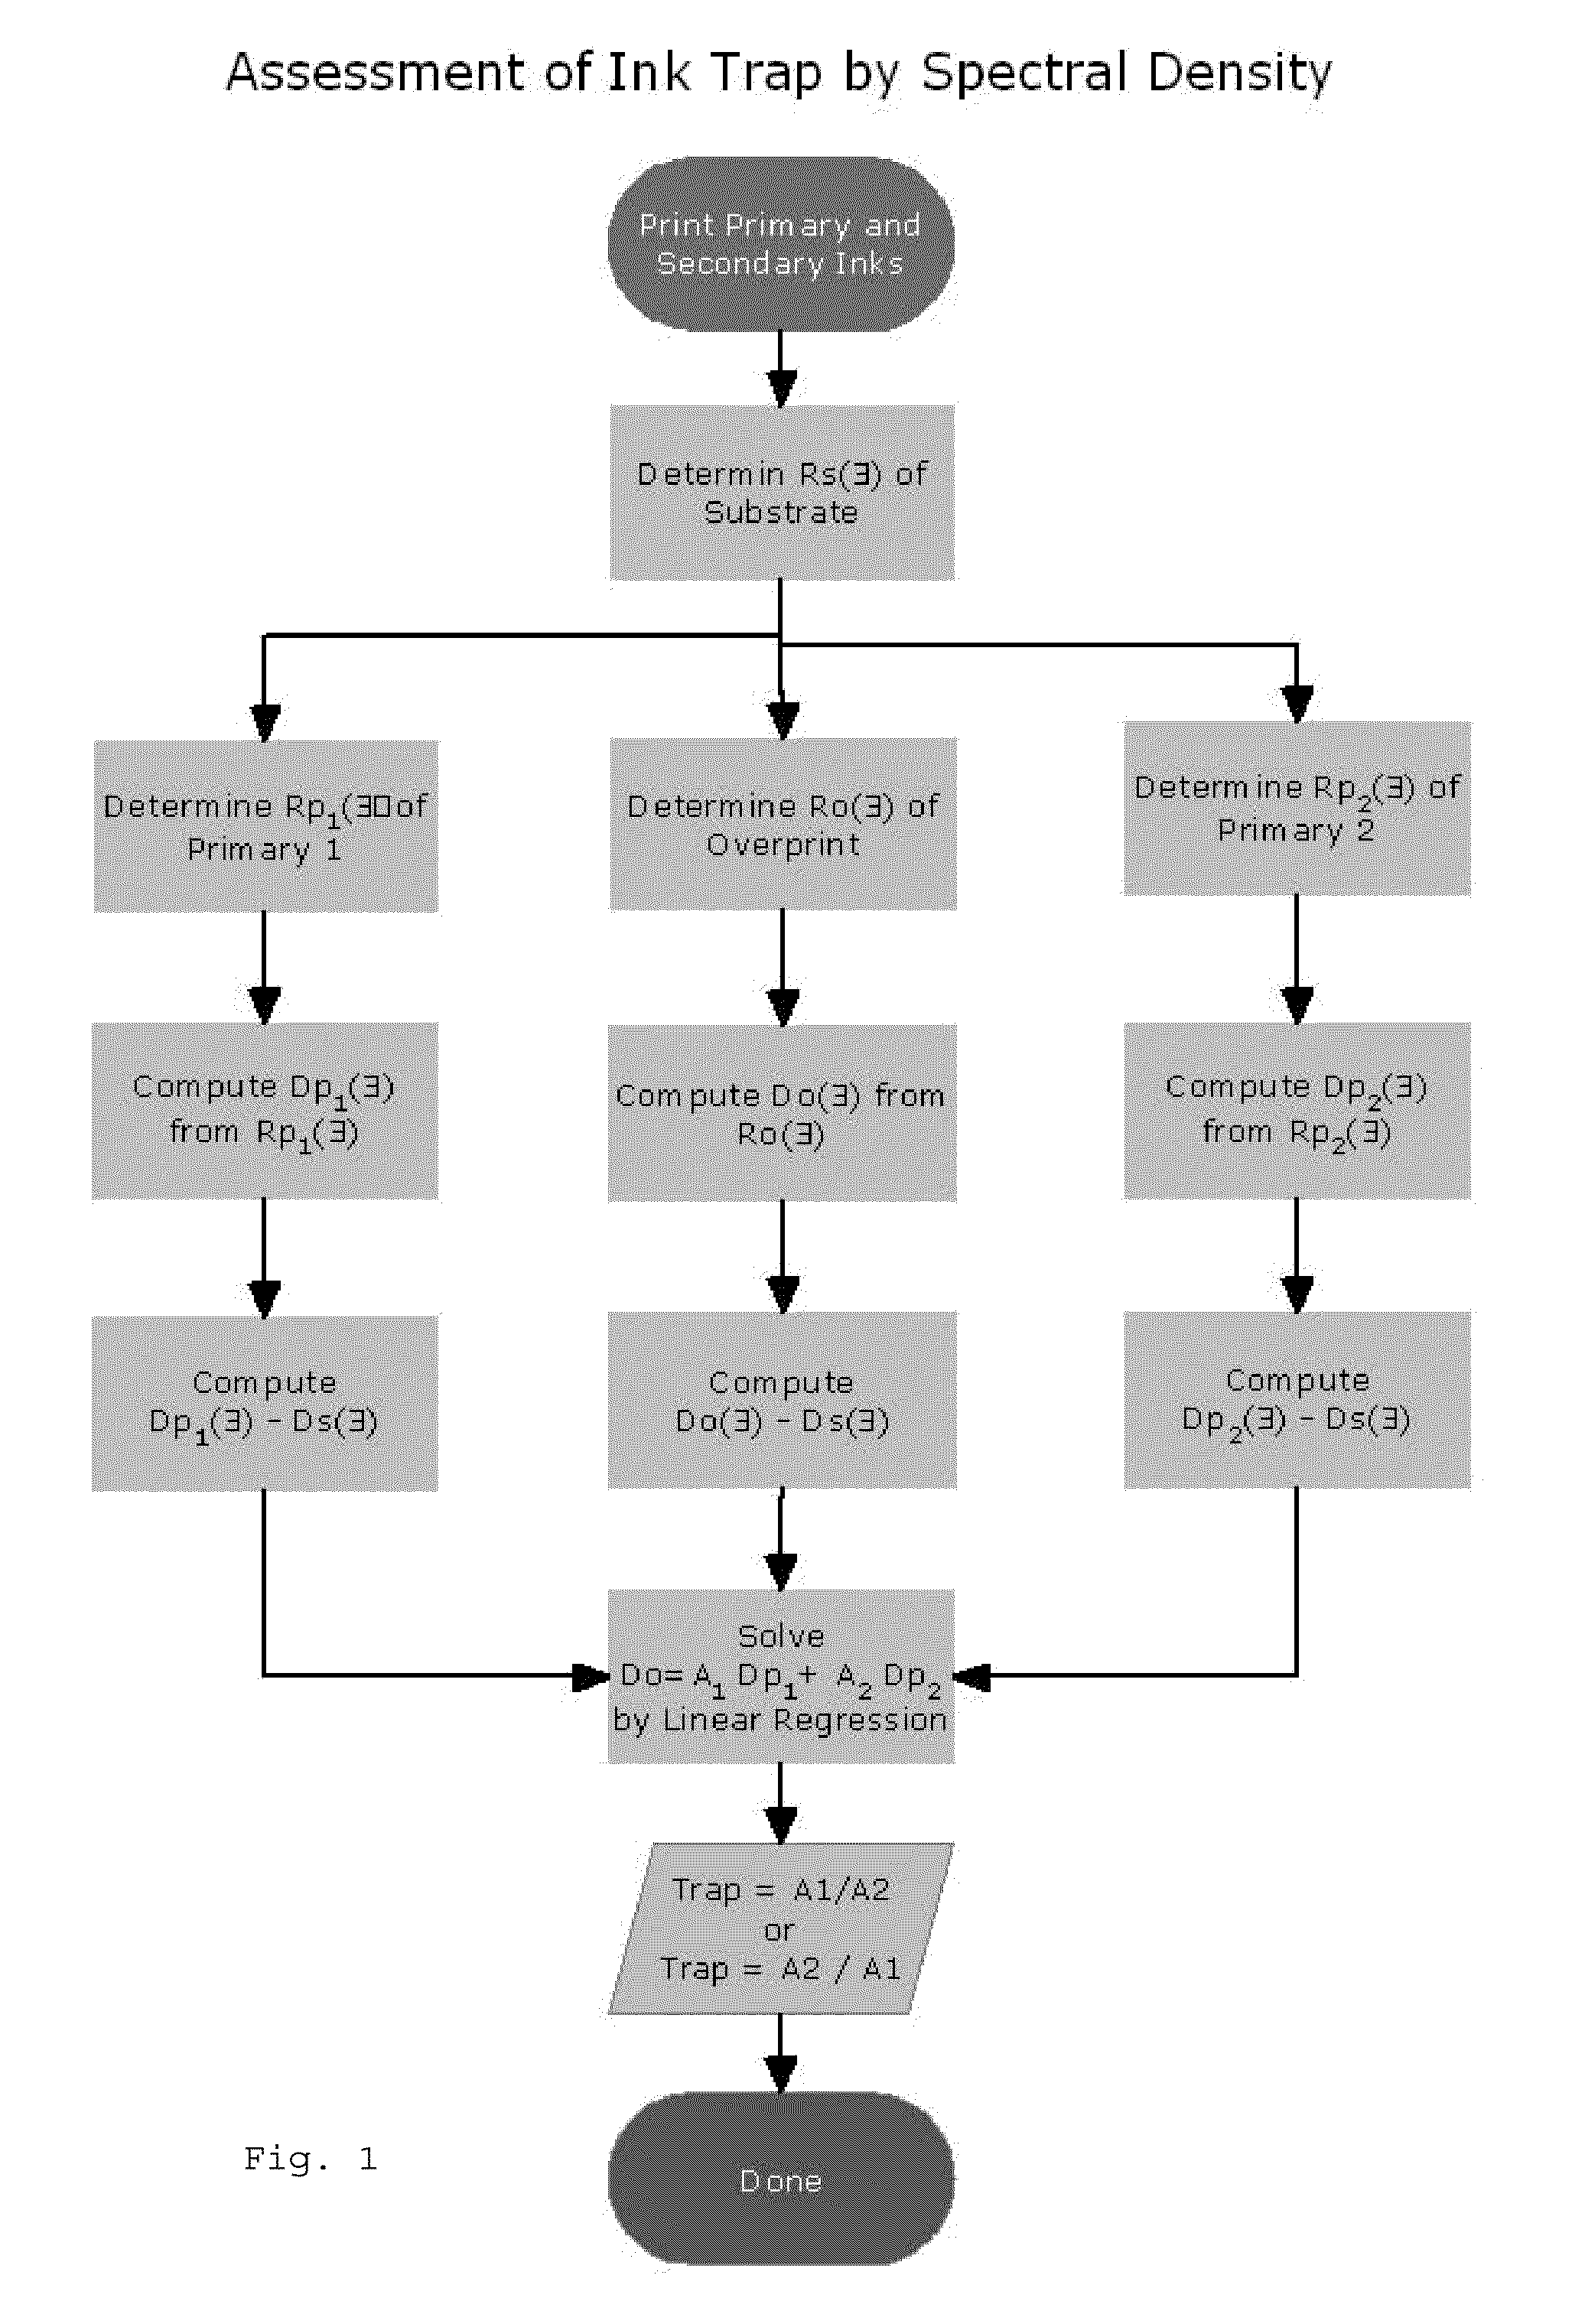
[0088]An X-Rite® 938 spectrodensitometer (X-Rite, Inc., Grandville, Mich.) is used to measure the substrate relative, spectral reflectance factor curves for a red overprint and the yellow and magenta test target primaries. The spectral reflectance factor curve for the substrate is also measured, and this curve is subtracted from the substrate relative, spectral reflectance factor curves for the red overprint and the yellow and magenta primaries to yield ink only spectral reflectance factor curves for the overprint and the yellow and magenta primaries. The spectral reflectance factor curves for the red overprint, the yellow and magenta primaries, and the substrate are converted to the corresponding spectral density curves using the formula D=−log(R). The spectral densities for the red overprint, the yellow and magenta primaries and the substrate at a number of wavelengths are subjected to the mixing relation equation:
Rλ, RED(λ)=10{log(Rλ, substrate)+Y[log(Rλ, yellow)−log(Rλ, substrat...
example 2
[0089]Analogous to Example 1, the trap estimation method is applied to a green overprint using the yellow and cyan test target primaries. The spectral densities for the green overprint, the yellow and cyan primaries, and the substrate are subjected to the mixing relation equation:
Rλ, GREEN(λ)=10{log(Rλ, substrate)+Y[log(Rλ, yellow)−log(Rλ, substate)]+C[log(Rλ, cyan)−log(Rλ, substrate)]}
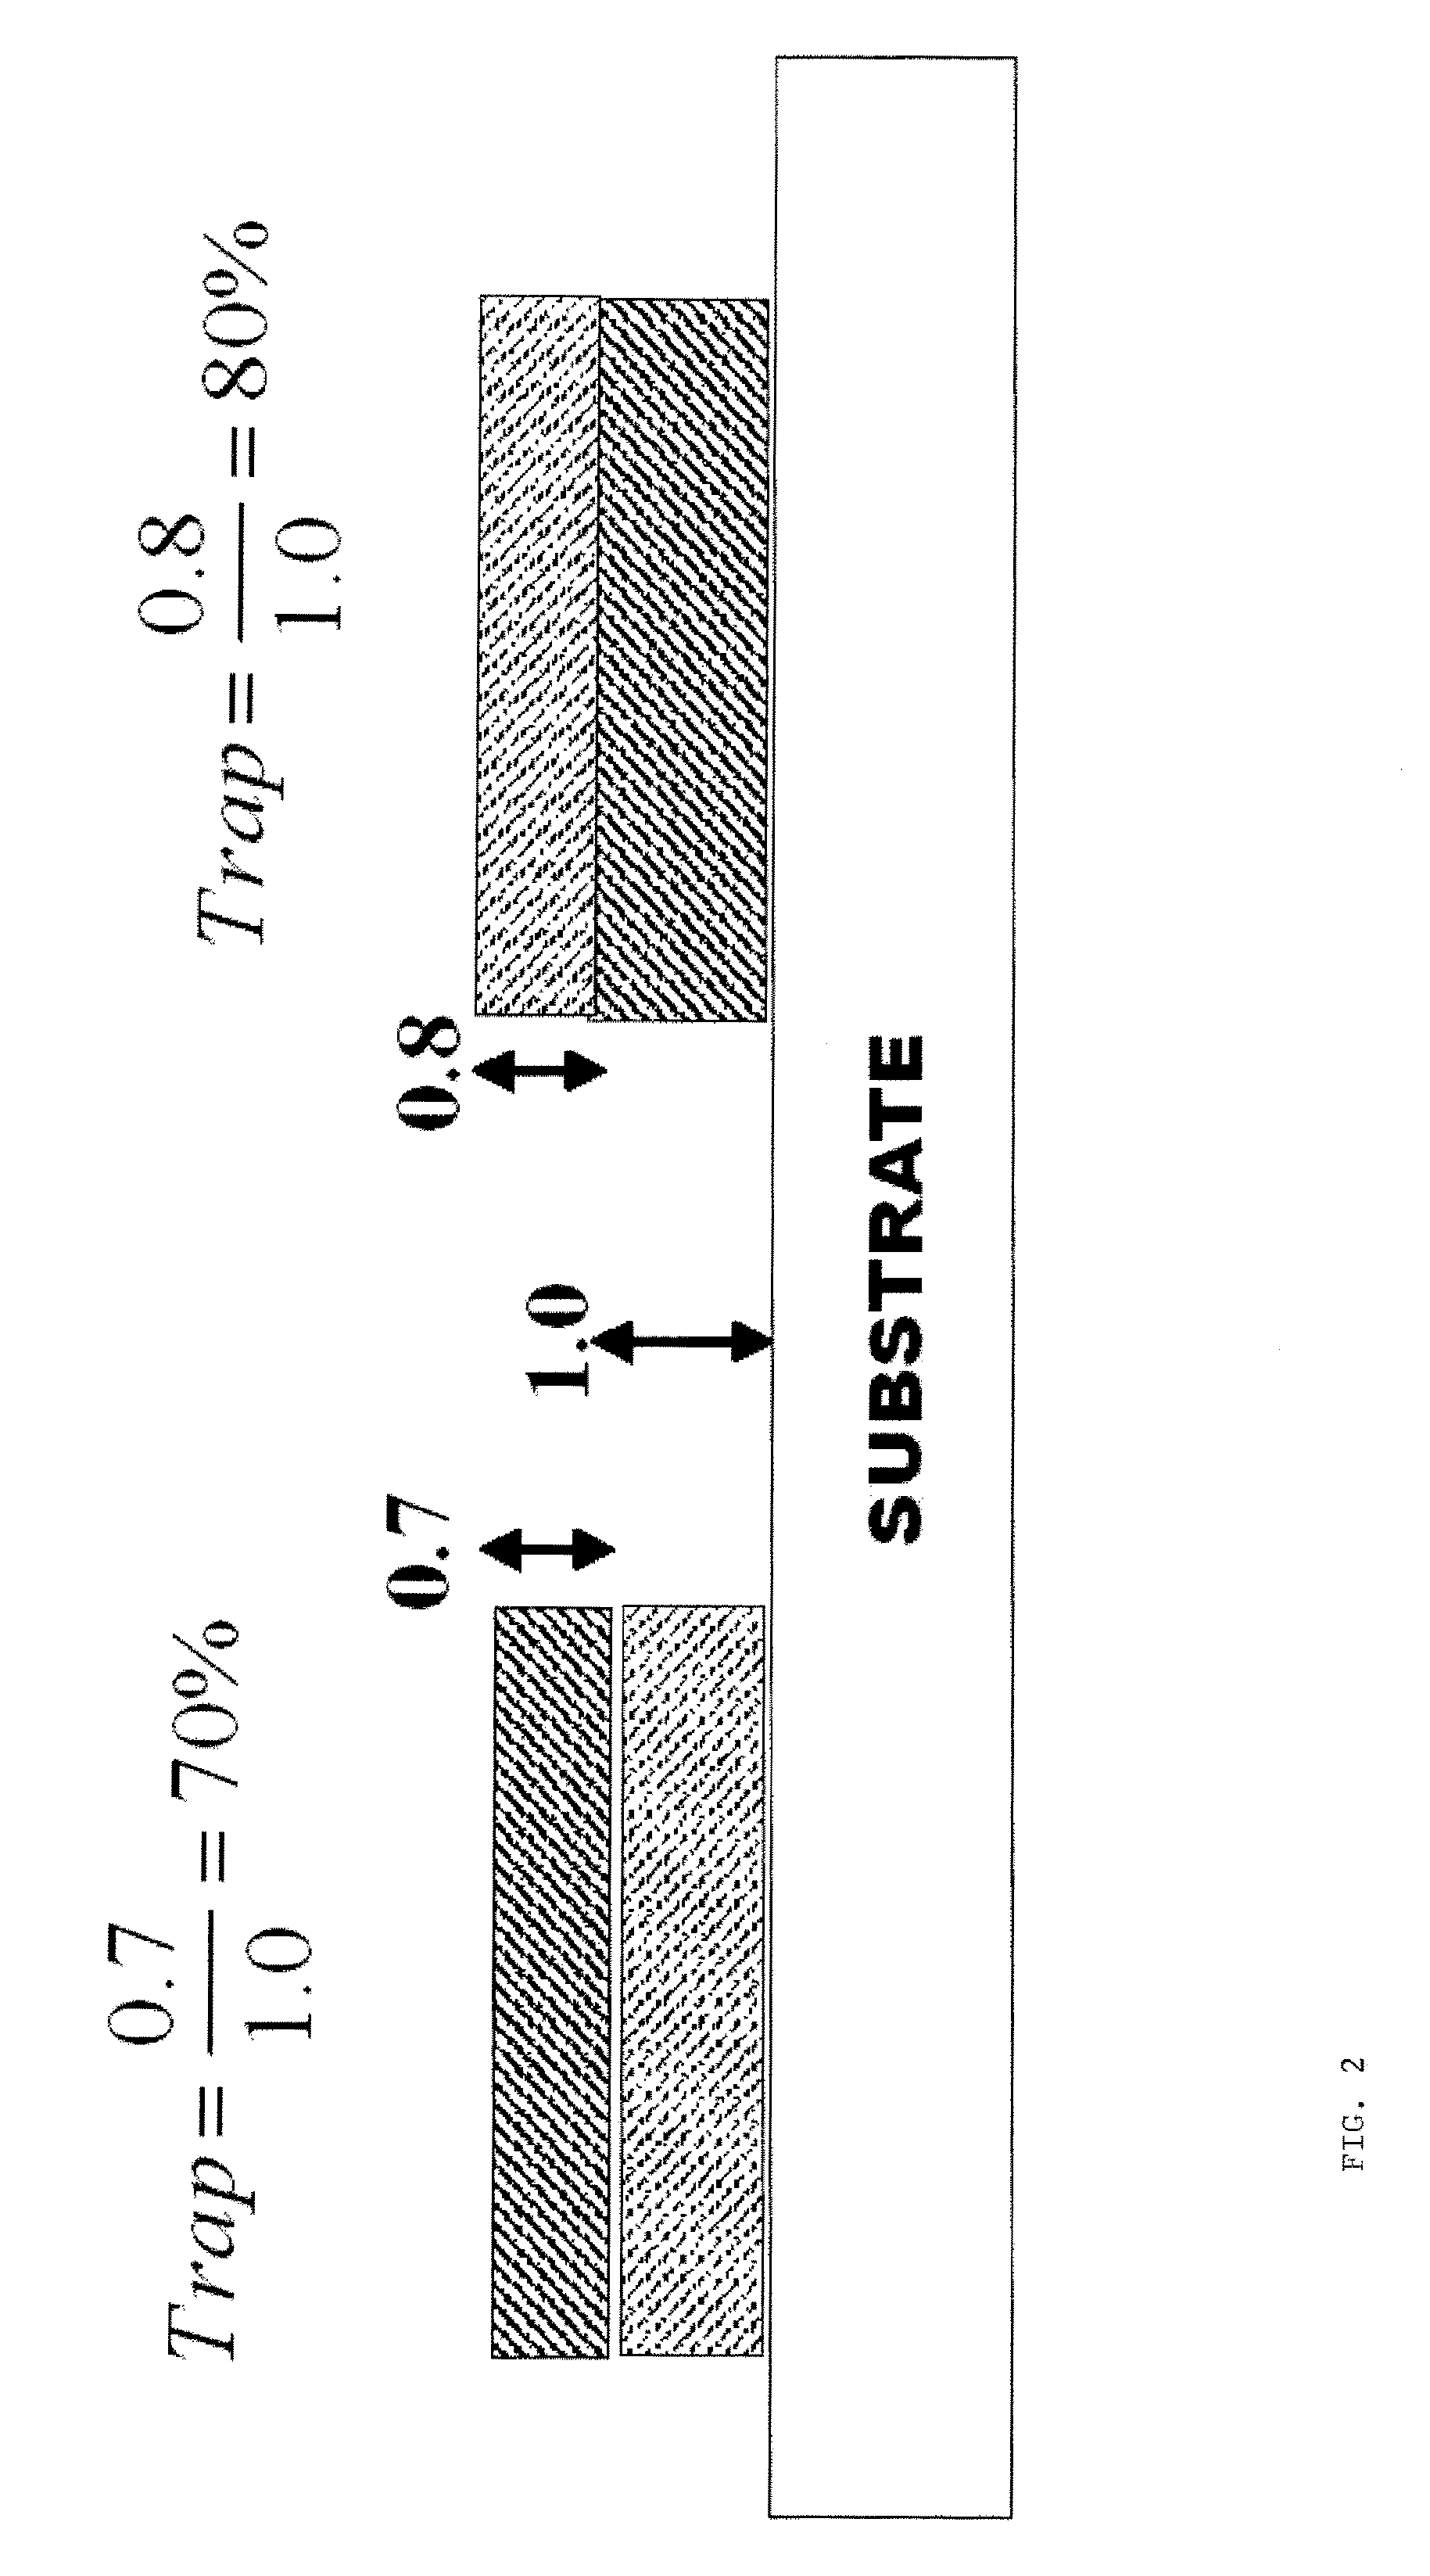
and linear regression can be used to solve for Y and C. The result is Y=0.8098 and C=0.9750. The ratio of Y / C=0.8098 / 0.9750 yields an trap of 81.1% while the Preucil equation gives 84.4%. The R2=0.9990 and the standard error is 0.0004.
example 3
[0090]Analogous to Example 1, the trap estimation method is applied to a blue overprint using the cyan and magenta test target primaries. The spectral densities for the blue overprint, the cyan and magenta primaries, and the substrate are subjected to the mixing relation equation:
Rλ, BLUE(λ)=10{log(Rλ, substrate)+C[log(Rλ, cyan)−log(Rλ, substrate)]+M[log(Rλ, magenta)−log(Rλ, substrate)]}
and linear regression can be used to solve for C and M. The result is C=0.9130 and M=0.7968. The ratio of M / C=0.7968 / 0.9130 yields an trap of 87.3% while the Preucil equation gives 71.8%. The R2=0.9926 and the standard error is 0.0008.
PUM
| Property | Measurement | Unit |
|---|---|---|
| wavelengths | aaaaa | aaaaa |
| wavelengths | aaaaa | aaaaa |
| wavelengths | aaaaa | aaaaa |
Abstract
Description
Claims
Application Information
 - R&D
- Intellectual Property
- Life Sciences
- Materials
- Tech Scout
- Unparalleled Data Quality
- Higher Quality Content
- 60% Fewer Hallucinations
Browse by: Latest US Patents, China's latest patents, Technical Efficacy Thesaurus, Application Domain, Technology Topic, Popular Technical Reports.
© 2025 PatSnap. All rights reserved.Legal|Privacy policy|Modern Slavery Act Transparency Statement|Sitemap|About US| Contact US: help@patsnap.com


