System and method of curve fitting

a curve and fitting technology, applied in the field of data processing, can solve problems such as reducing productivity, difficult to detect and discard inaccurate measurement data, and difficult to measure images

Inactive Publication Date: 2009-12-01
INT BUSINESS MASCH CORP
View PDF5 Cites 91 Cited by
  • Summary
  • Abstract
  • Description
  • Claims
  • Application Information

AI Technical Summary

Problems solved by technology

Unfortunately, parabolic modeling is resistant to classical point-tossing methodologies, usually based upon model residuals, making it difficult to detect and discard inaccurate measurement data.
This is due to image quality being poor at the extremes of focus of the photolithographic tool, thus making the images difficult to measure.
In a manufacturing environment, this decreases productivity which increases manufacturing costs.
Data at the extremes of focus of the photolithographic tool typically do not fit parabolic behavior due to poor image quality, thus making the images difficult to measure.
Yet the 2nd-order polynomial method gives excessive weighting to the data at the extremes of focus resulting in a reduction in accuracy in the determination of best focus.
As described above with reference to the 2nd-order polynomial, data at the extremes of focus of the photolithographic tool typically do not fit parabolic behavior due to poor image quality.
Thus, the 4th-order polynomial method also gives excessive weighting to the data at the extremes of focus resulting in a reduction in accuracy in the determination of best focus.

Method used


Image

  • System and method of curve fitting
  • System and method of curve fitting
  • System and method of curve fitting

Examples


example

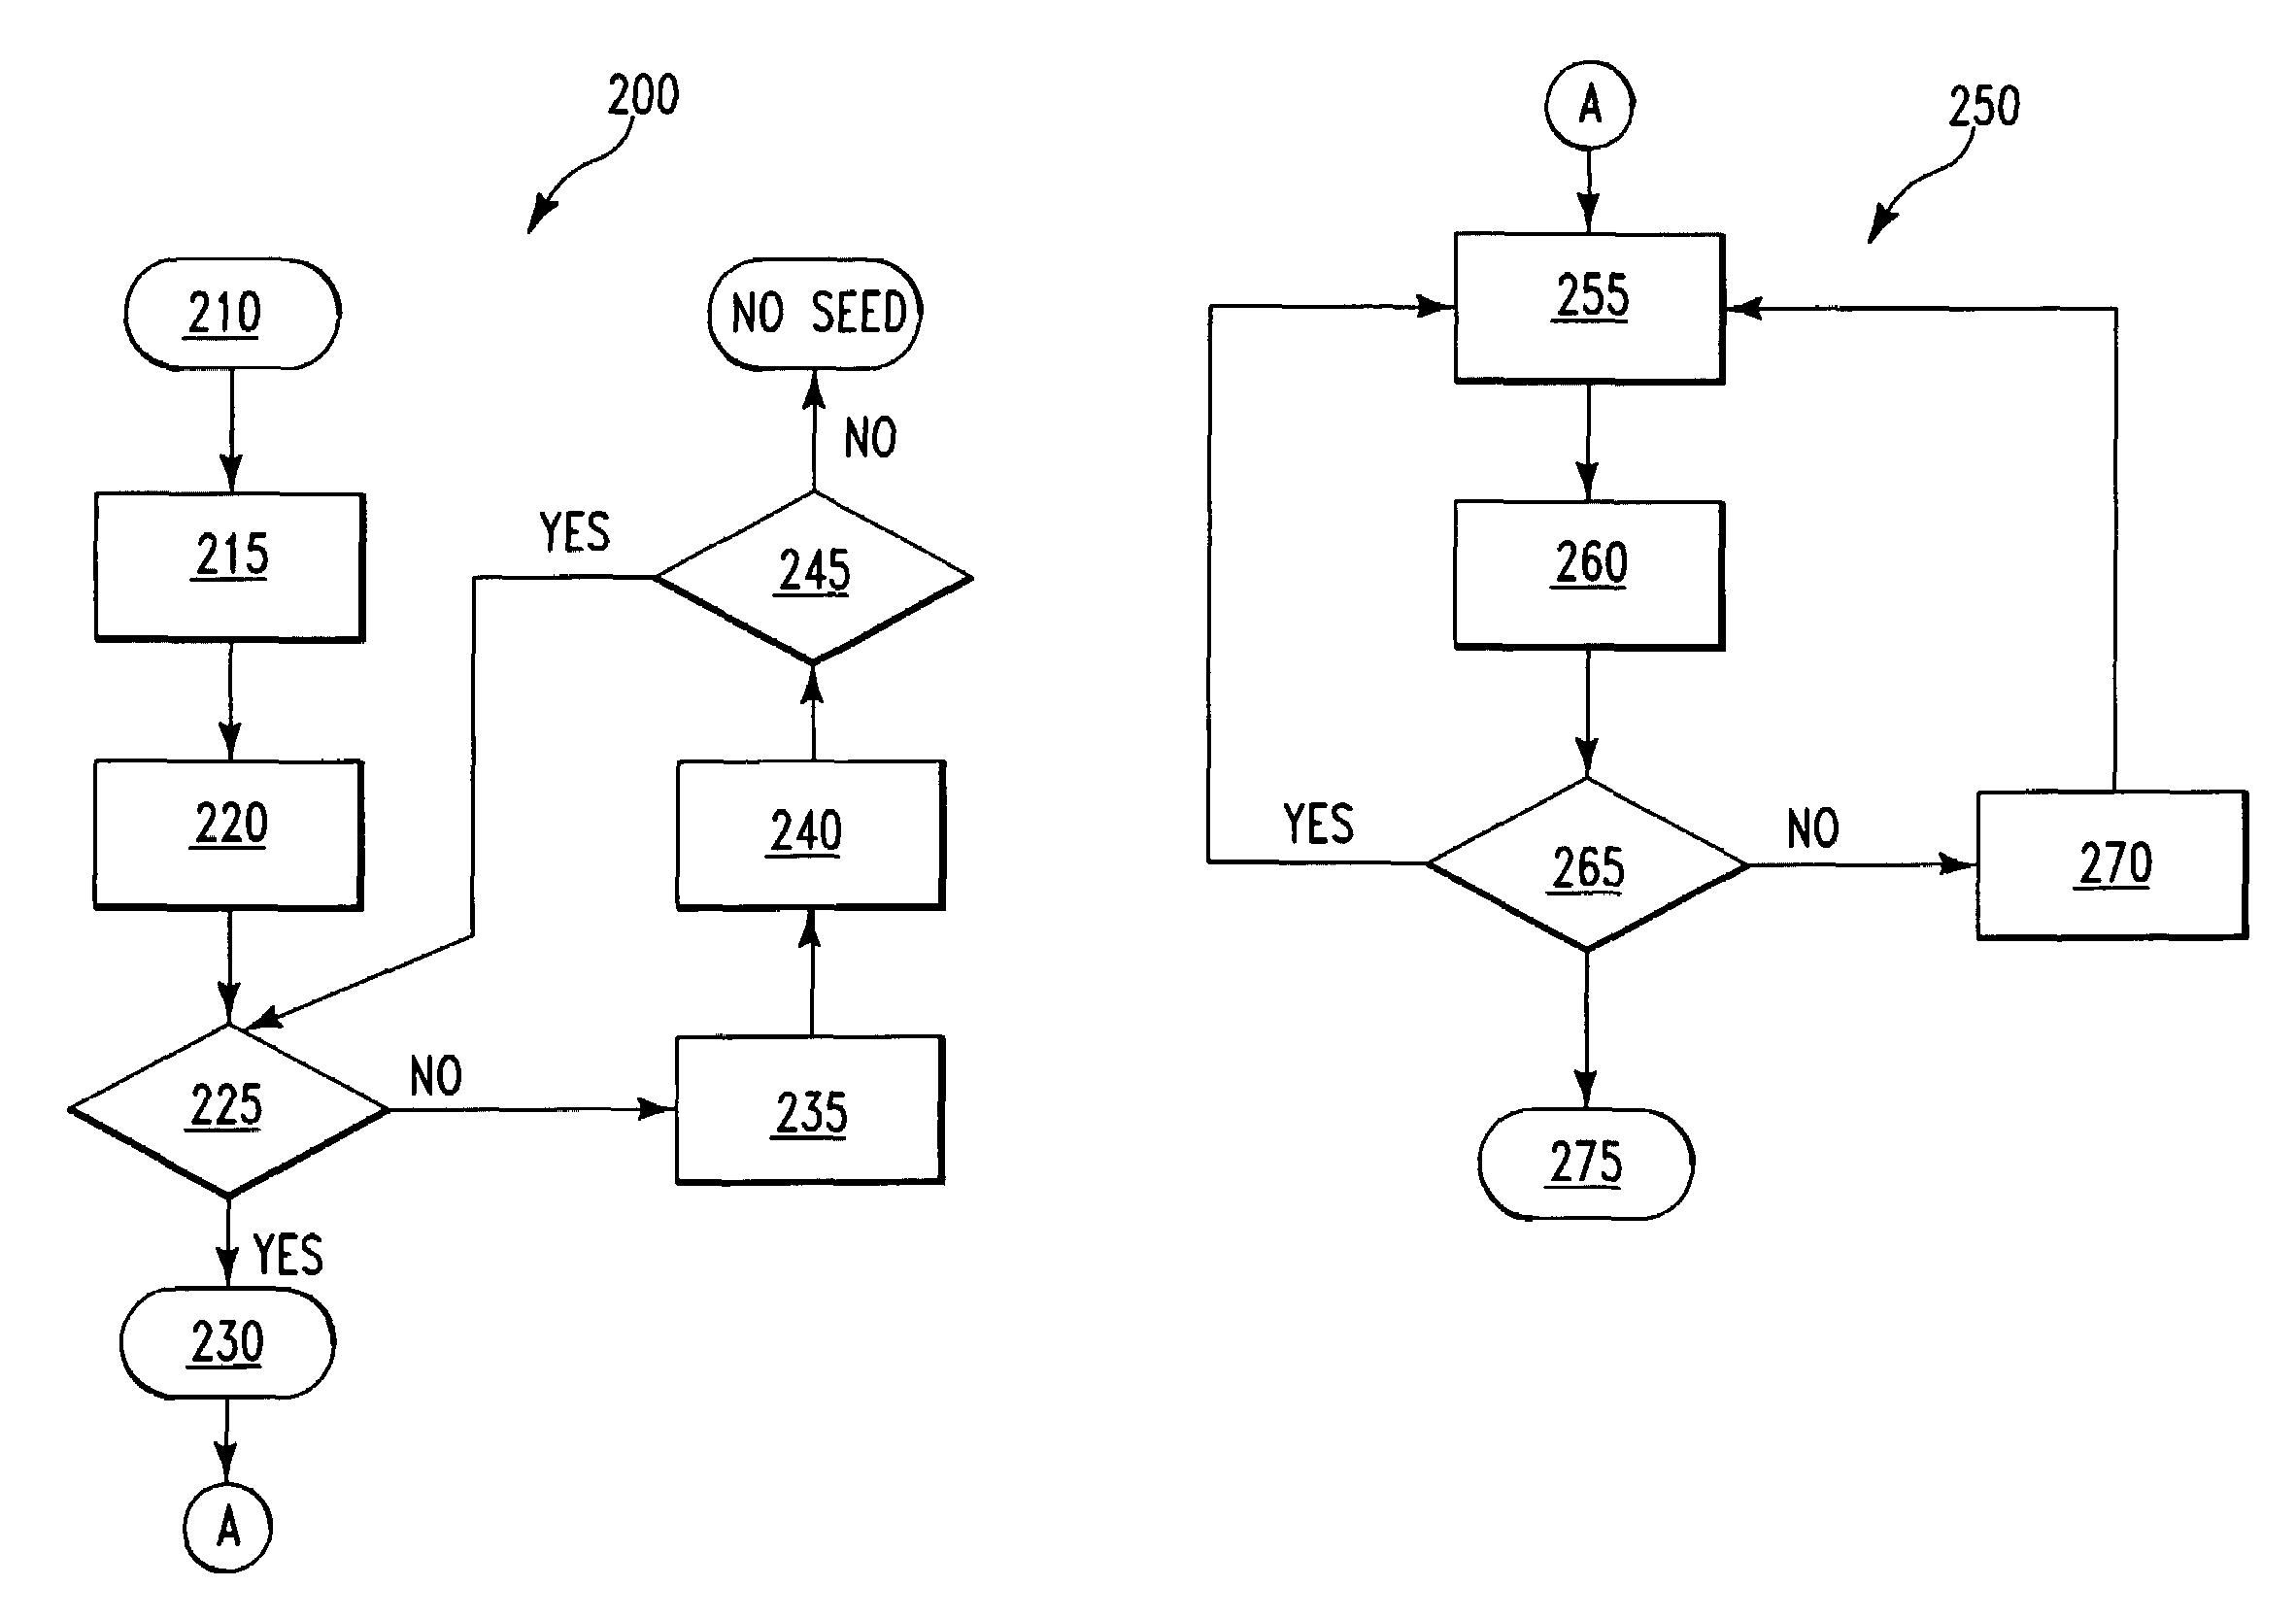
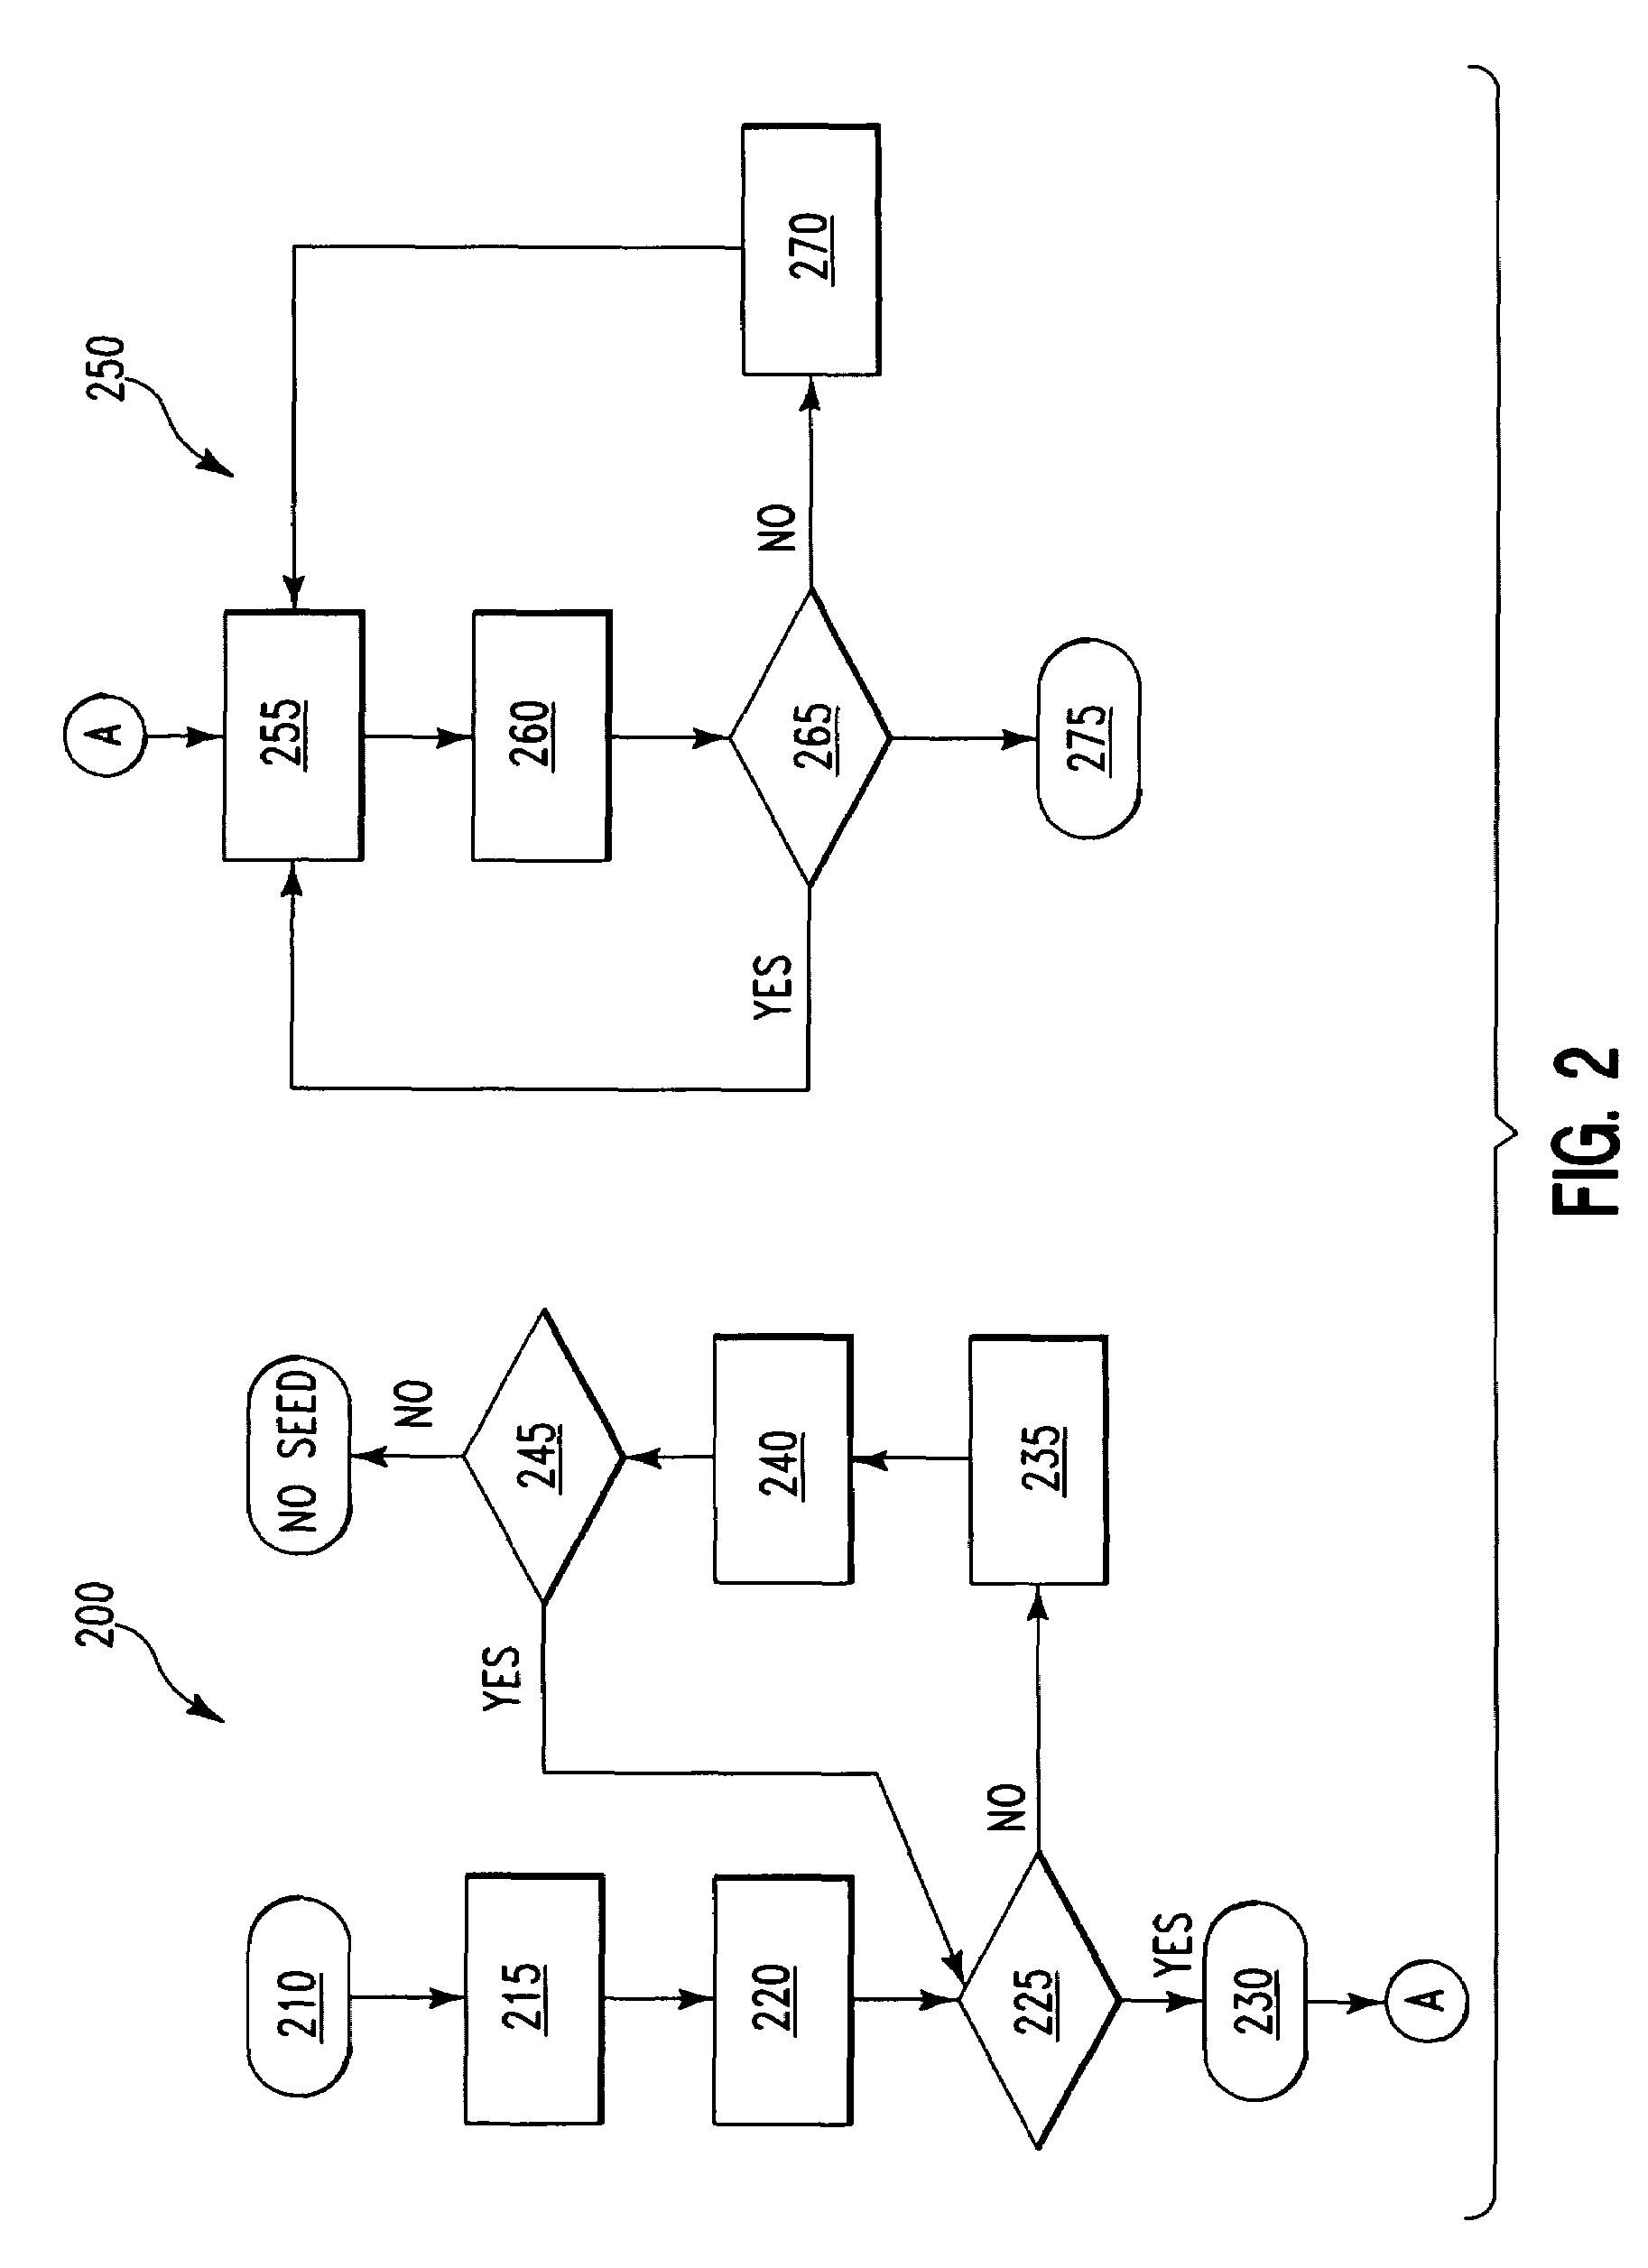
[0041]An example to illustrate an embodiment of the invention will be discussed with respect to determining a “best focus” condition for a photolithographic tool. The example is meant to be illustrative of an embodiment of the method of the invention described with reference to the steps shown in FIG. 2 and, as such, details of calculations using Equations 1-3 described herein above are not shown for the sake of clarity.

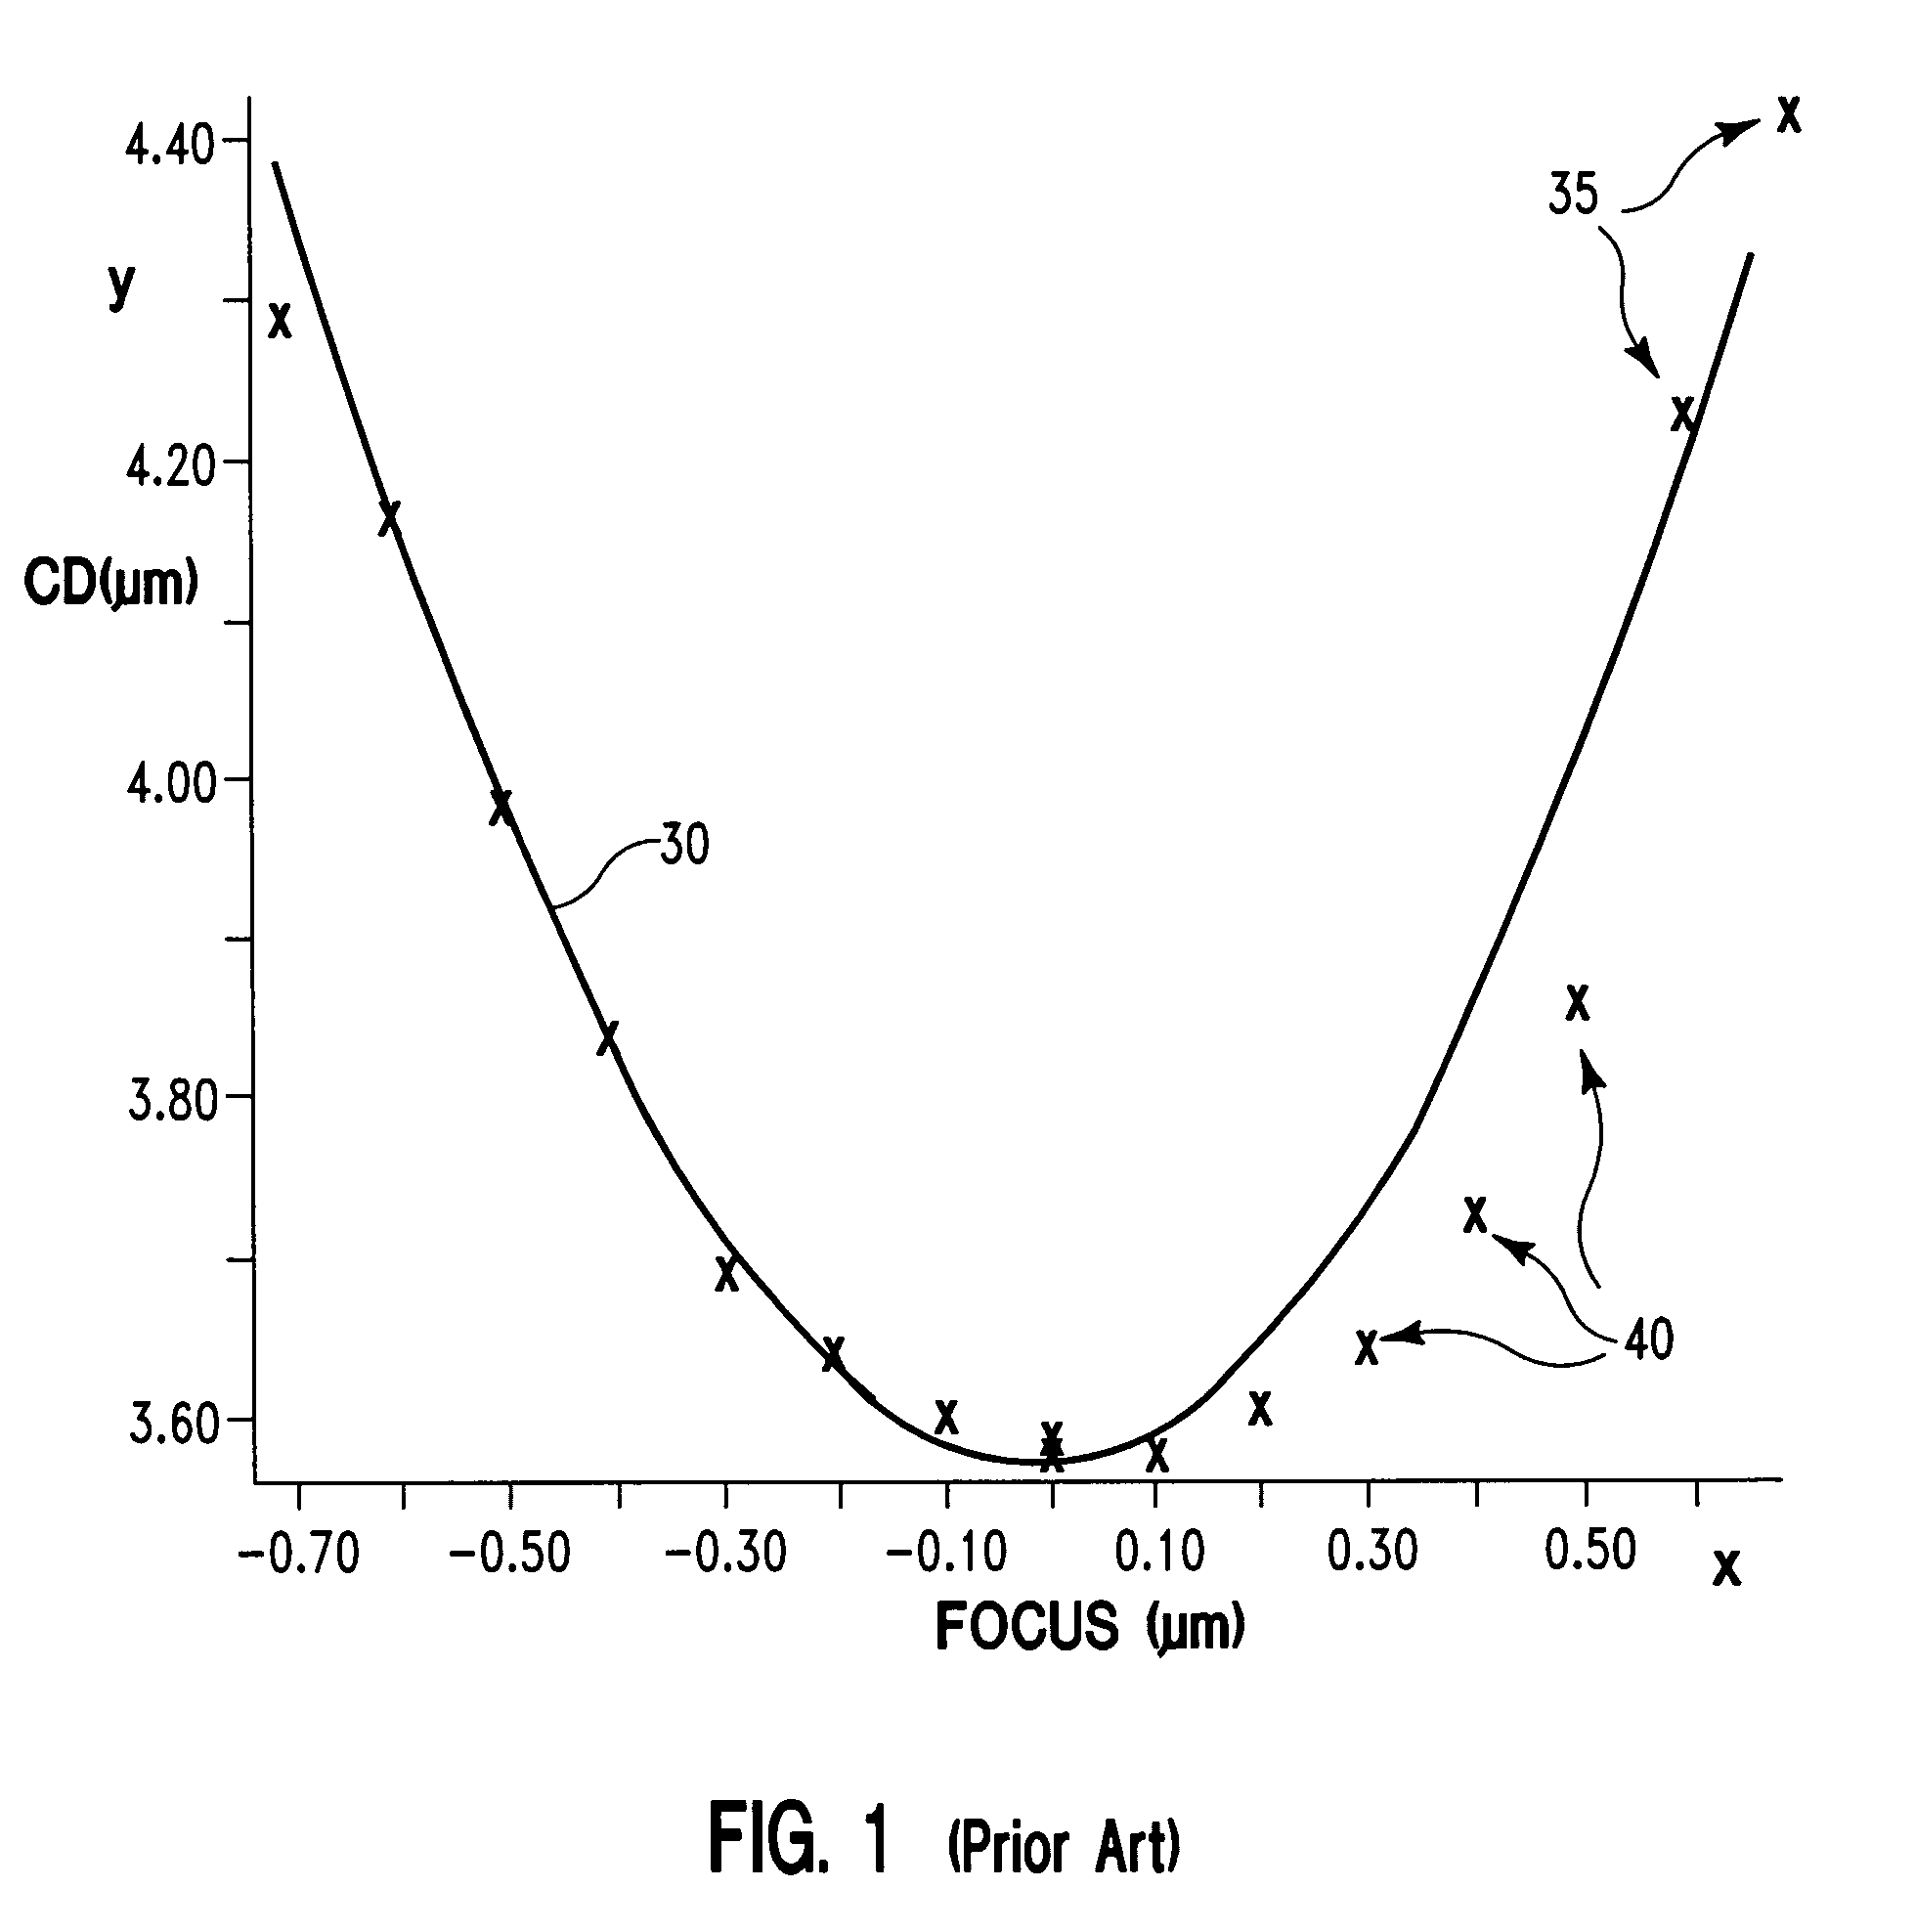
[0042]Referring to FIG. 3, data points 1-15 include well behaved data points such as, for example, data points 6, 7, 8, and less well-behaved data points such as, for example, data points 14 and 15. For image size measurement data related to the photolithographic tool, well behaved data points usually have the lowest image size measurements (or the highest image size measurements for different process or tool settings). As described with respect to FIG. 2, in step 210 a check of data points 1-15 is performed to eliminate obvious inaccurate data. A check of data point...


PUM


Abstract

The invention relates to fitting a curve to a plurality of data points. A “seed curve” is determined from a first set of data points selected from the plurality of data points. From the remaining data points, data points are individually selected and a determination is made for each selected data point as to whether the data point is acceptable to be included with the first set of data points. When a data point is determined to be acceptable, the data point is included with the first set of data points to form another set of data points. After each of the other data points are evaluated for inclusion with the first set of data points, a best fit curve is determined from a final set of data points.

Description

[0001]The present application is a non-provisional U.S. patent application of provisional application Ser. No. 60 / 481,642, filed Nov. 14, 2003.FIELD OF THE INVENTION[0002]The field of the invention is data processing, and more particularly relates to fitting a curve to a plurality of data points.BACKGROUND OF THE INVENTION[0003]Fitting a curve to a plurality of data points is commonly performed in engineering applications where characterization of the plurality of data points is required in order to obtain information regarding a response of a system. For example, curve fitting of data points is performed in the field of semiconductor processing such as in controlling focus for a photolithographic tool. Image size measurement data points generated from images produced by the photolithographic tool for various focus settings can be analyzed to fit a curve to the data points in order to determine a “best focus” condition for the photolithographic tool.[0004]According to one convention...

Claims


Application Information

Patent Timeline
Patent Type & Authority Patents(United States)
IPC IPC(8): G06F15/00G06F7/38G06F17/17
CPCG06F17/17
Inventor CONRAD, EDWARD W.DOUGLAS, JAMES C.GODDARD, SHAWN R.SMYTH, JOHN S.
Owner INT BUSINESS MASCH CORP
Why Eureka
Try Eureka