Direct jitter analysis of binary sampled data

Active Publication Date: 2009-12-22
TERADYNE
View PDF7 Cites 1 Cited by
  • Summary
  • Abstract
  • Description
  • Claims
  • Application Information

AI Technical Summary

Benefits of technology

[0030]With the foregoing background in mind, it is an object of the invention to mea

Problems solved by technology

ATE allows manufacturers to diagnose defects early, and thus saves costs that would otherwise be spent processing defective parts.
Because the DUT generally operates at higher speeds than the tester, direct, sequential sampling is generally not feasible, and the tester preferably undersamples the bit stream, i.e., it stimulates the DUT to repetitively output the same bit stream and samples the bit stream at different timing locations on successive iterations.
Because the bit stream is subject to jitter, samples taken at the same timing location of an edge transition do not yield repeatable results.
For instance, this technique requires a great deal of data.
Processing this large amount of data tends to be computationally intensive.
Because averaging combines samples taken over a relatively long period of time (e.g., the time required to collect 128 samples of each point), it effectively mixes together these short term and long term effects, making it difficult to observe short term and long term effects separately.
It can therefore give inaccurate results for bi-modal or other types of distributions.
Although this approach yields more accurate results for non-Gaussian distributions, it still requires a CDF, and thus requires a great deal of data.

Method used


Image

  • Direct jitter analysis of binary sampled data
  • Direct jitter analysis of binary sampled data
  • Direct jitter analysis of binary sampled data

Examples


Embodiment Construction

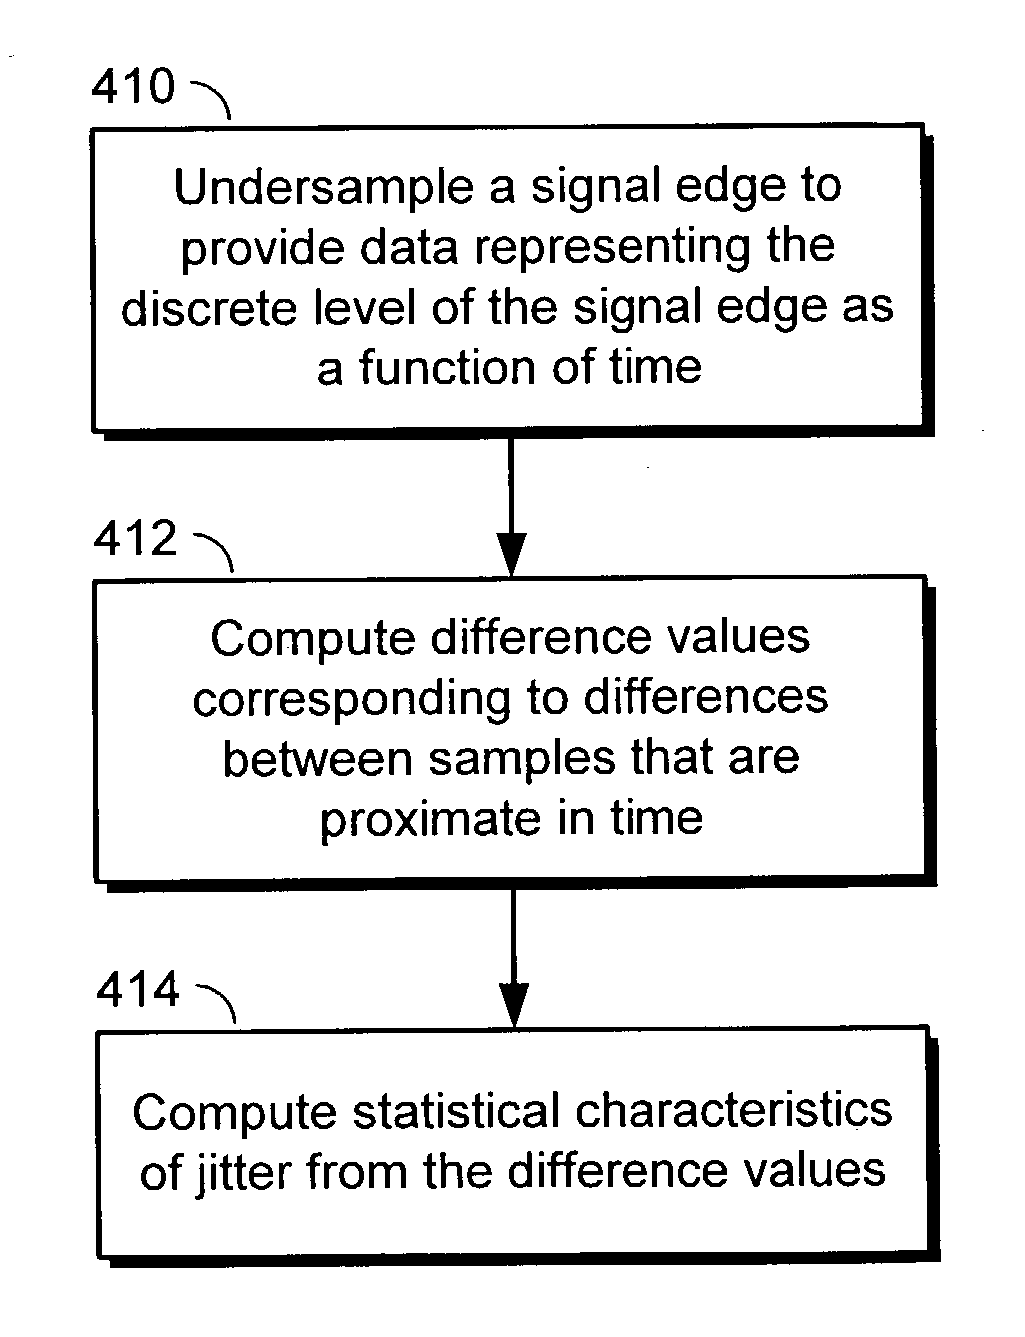
[0041]FIG. 4 shows a high level overview of an embodiment of the invention. At step 410, a signal edge is undersampled at regular intervals over a range of timing locations to determine whether the signal is a ‘1’ or a ‘0’ at each location.

[0042]At step 412, difference values are computed between samples that are proximate in time. The samples are ordered by timing location, and the difference values are preferably taken between each element and the previous element, i.e., a[i+1]−a[i], where “i” is an index that represents time between uniformly spaced samples. FIG. 7 shows the computation of difference values graphically—an array 712 of difference values is computed from differences between adjacent samples in an array 710, which is ordered by index 714.

[0043]At step 414, one or more statistical characteristics of the signal edge are computed directly from the difference values. These characteristics may include mean, variance, and standard deviation of the edge position (the speci...


PUM


Abstract

A technique for determining the timing location and / or jitter of a signal edge includes computing differences between pairs of adjacent samples of the signal edge to yield difference values. First and second statistical moments are computed directly from the difference values, and mean edge location and standard deviation are computed from the first and second moments.

Description

CROSS-REFERENCES TO RELATED APPLICATIONS[0001]Not Applicable.STATEMENT REGARDING FEDERALLY SPONSORED RESEARCH OR DEVELOPMENT[0002]Not Applicable.Reference to Microfiche Appendix[0003]Not ApplicableBACKGROUND OF THE INVENTION[0004]1. Field of the Invention[0005]This invention relates generally to automatic test equipment and processes, and more particularly to testing timing characteristics of high-speed devices.[0006]2. Description of Related Art[0007]Manufacturers of integrated circuits use automatic test equipment (ATE) to test devices during the manufacturing process. ATE allows manufacturers to diagnose defects early, and thus saves costs that would otherwise be spent processing defective parts. ATE also allows manufacturers to grade devices across different levels of performance. As better performing devices generally fetch higher prices, the ability to test integrated circuits translates into increased profits.[0008]A primary goal of automatic test equipment (ATE) is to test e...

Claims


Application Information

Patent Timeline
IPC IPC(8): G01R31/00G01R31/14G01R31/317
CPCG01R31/31725G01R31/31709
Inventor HALLE, FRANCINEMONK, LEONARD G
Owner TERADYNE
Why Eureka
Try Eureka