Methods for performing hematocrit adjustment in glucose assays and devices for same

a technology of glucose assay and hematocrit, which is applied in the direction of biomass after-treatment, instruments, and investigating phase/state change, etc., can solve the problems of poor glucose monitoring product performance, less accurate glucose reading, and interference in the glucose value of a whole blood sample, so as to measure the resistance of the blood sampl

Active Publication Date: 2011-07-05
ASCENSIA DIABETES CARE HLDG AG
View PDF34 Cites 83 Cited by
  • Summary
  • Abstract
  • Description
  • Claims
  • Application Information

AI Technical Summary

Problems solved by technology

One problem with using current biosensor reagents to determine the hematocrit value and, consequently, the glucose value of a whole blood sample involves RBC interference.
RBC interference contributes to a bias reading or a glucose bias in the biosensor reagents of glucose-monitoring products.
However, due to RBC interference, there is a percentage bias in the glucose reading that is detected by the biosensor reagent that varies based upon the level of hematocrit in the sample.
In general, the higher the glucose bias, the less accurate the glucose reading and the worse the performance of the glucose-monitoring product.
The bias reading caused by the hematocrit content of a blood sample can have an adverse effect on patients.
Patients who have low hematocrit levels may misinterpret their glucose value as being too high because of the glucose bias and think they need insulin to bring their high glucose level, down.
Because the actual glucose level is not as high as the perceived glucose level, patients may drop their glucose level too low by unnecessarily taking too much insulin.
Conversely, patients who have high hematocrit levels may misinterpret their glucose value as being normal when it is actually high because of the glucose bias.
Because the actual glucose level is not as low as the perceived glucose level, patients may consistently forego or miss needed treatment, leading to long term medical complications.
Determining the percentage of glucose bias using this method is only practical if the value for Gluref can be measured for every blood sample, but this is typically not feasible for users of glucose-monitoring products.
In addition, this method of determining the percentage of glucose bias is inconvenient as the value for Gluref is measured in a clinical or laboratory setting.

Method used


Image

  • Methods for performing hematocrit adjustment in glucose assays and devices for same
  • Methods for performing hematocrit adjustment in glucose assays and devices for same
  • Methods for performing hematocrit adjustment in glucose assays and devices for same

Examples


example 1

Hematocrit Effect on Glucose Measurement

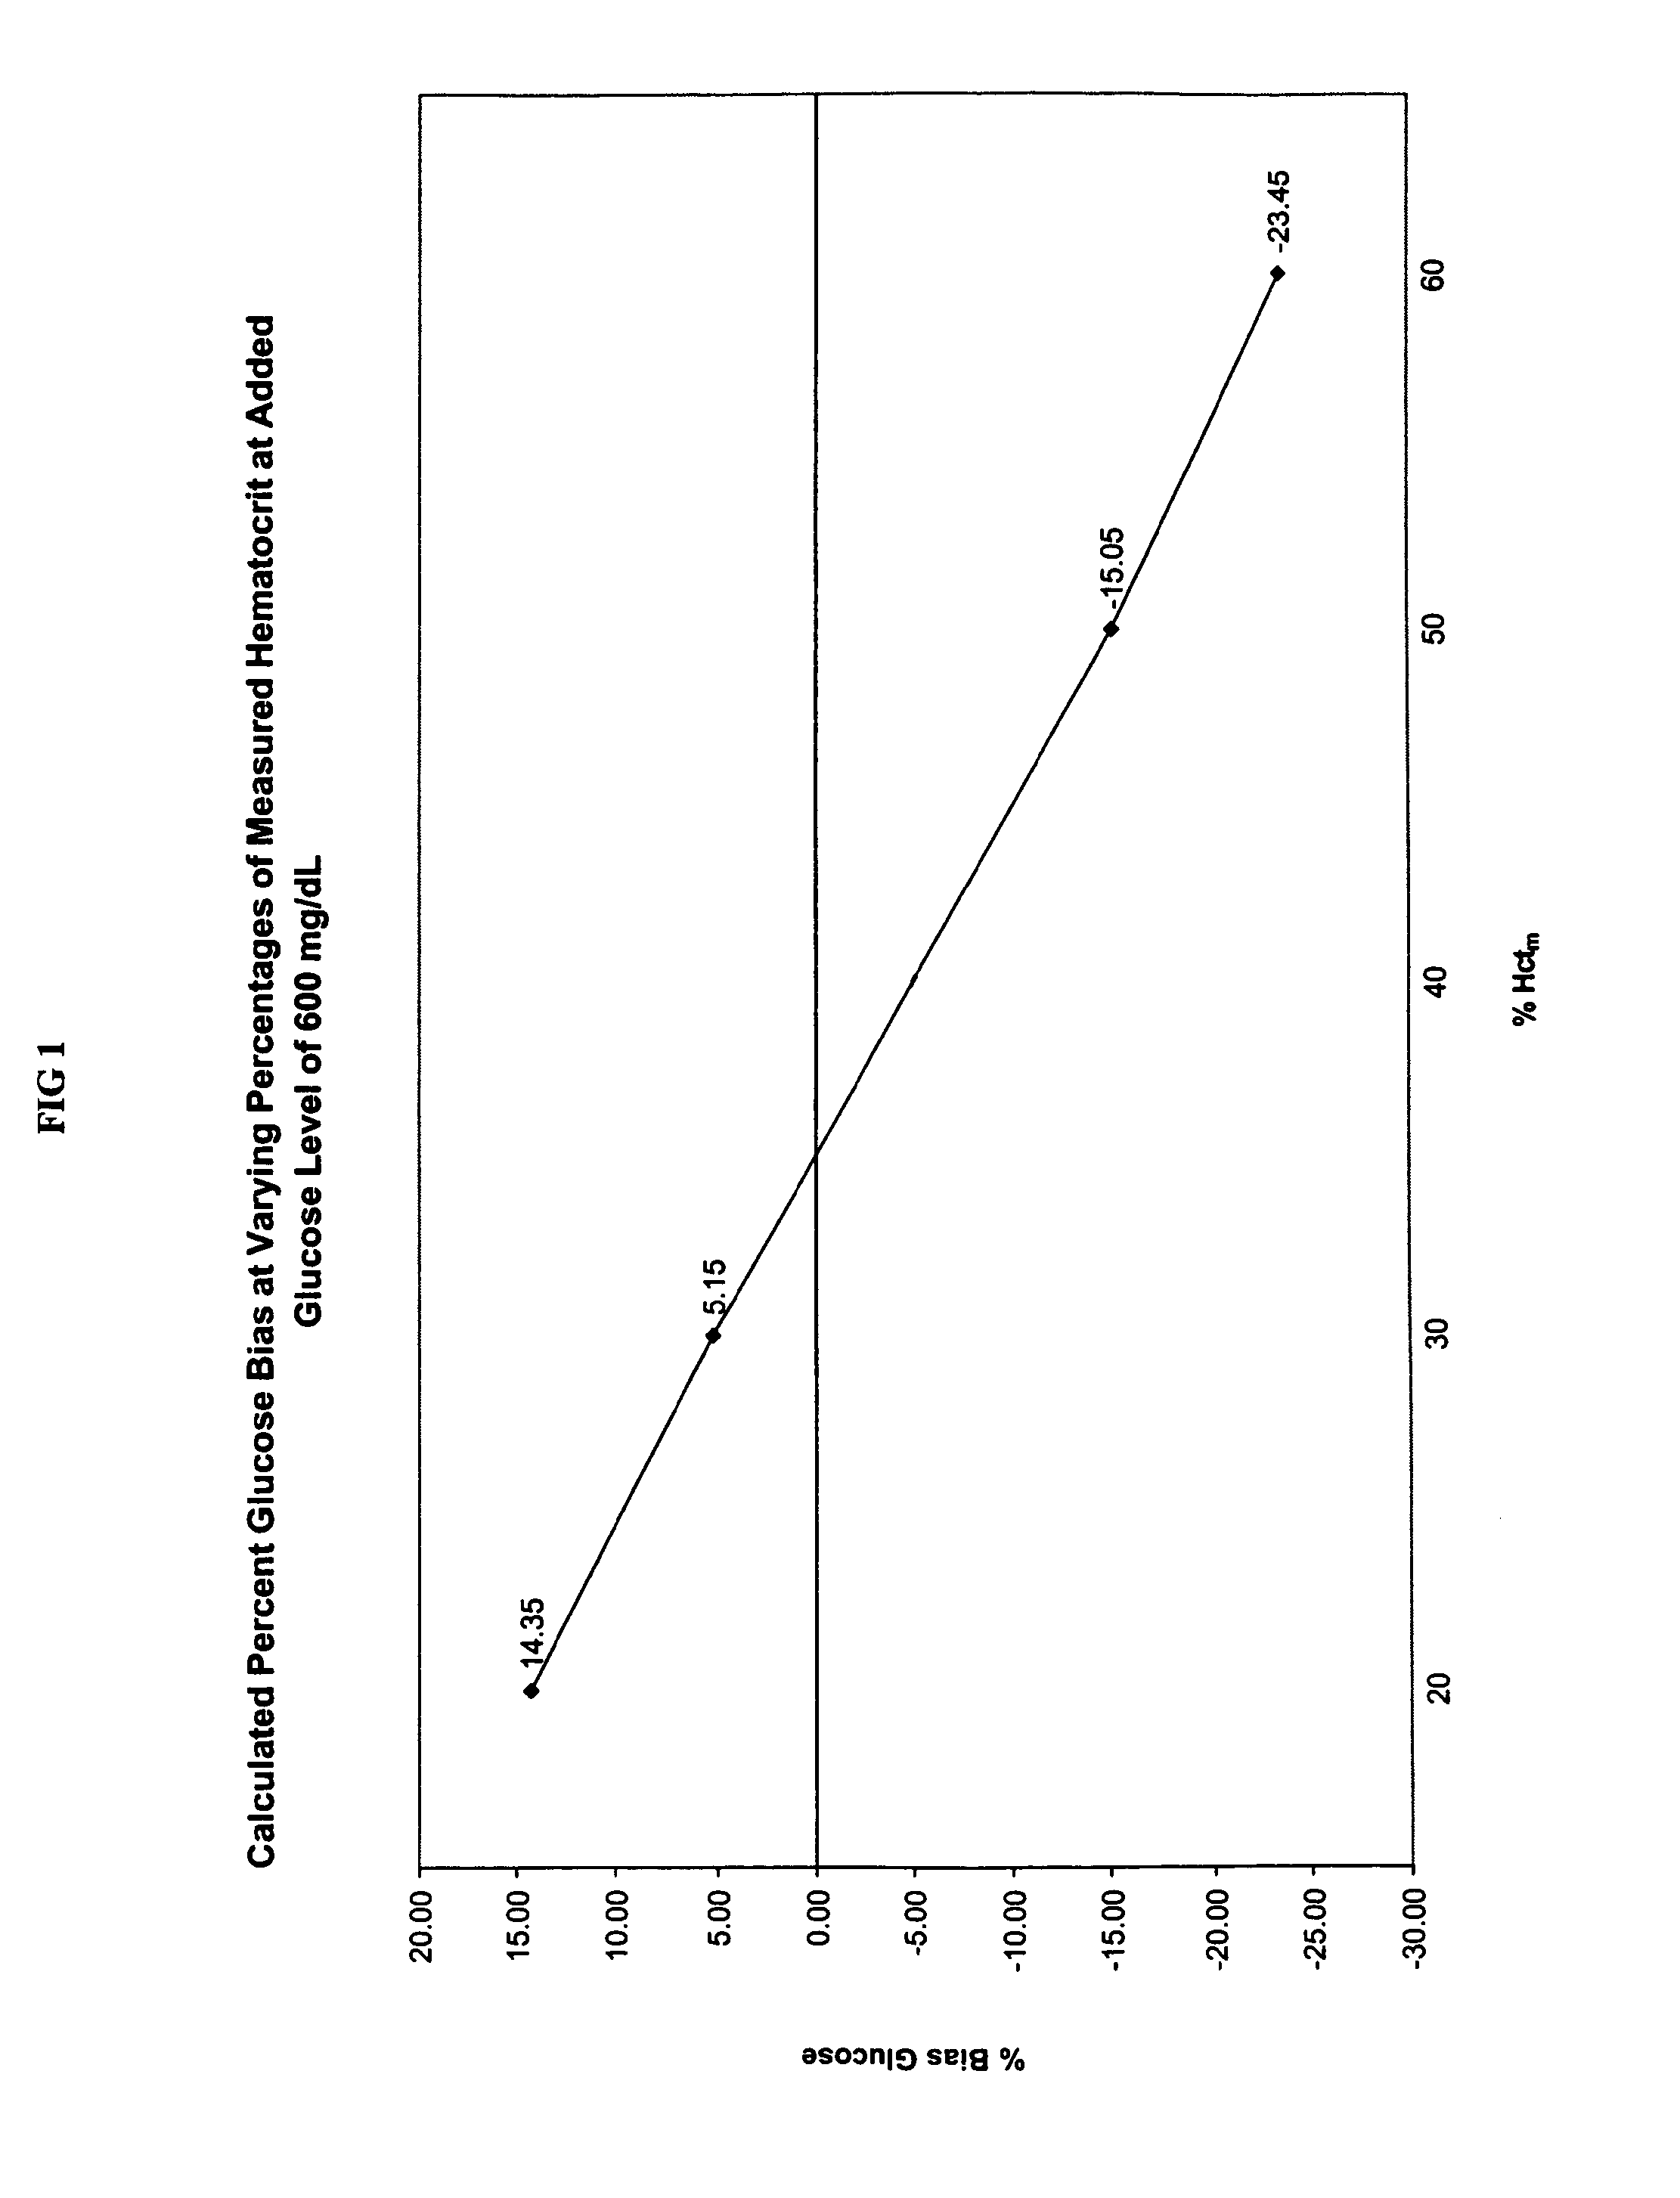
[0049]This example illustrates the hematocrit effect (i.e., the bias reading derived from hematocrit content) that is observed in glucose biosensor reagents. To illustrate the variation in the measured glucose level that is obtained with whole blood samples having different hematocrit content, four aliquots of whole blood (Samples 1-4) were obtained and pooled together.

[0050]The hematocrit content of Samples 1-4 was adjusted to 20 Vol. %, 30 Vol. %, 50 Vol. %, and 60 Vol. % Hct, respectively, using the hematocrit adjustment protocol described below. The volume of plasma to be added to each of the four aliquots of whole blood (i.e., Samples 1-4) to achieve the target hematocrit contents (i.e., 20 Vol. %, 30 Vol. %, 50 Vol. %, and 60 Vol. % Hct) was calculated using the relationship set forth in Equation 5:

[0051]P=(HctoHctt)-1×V(Eq.⁢5)

where

[0052]P=Volume of plasma to be added or subtracted from the volume of the whole blood sample (V)

[0053]V=Vol...

example 2

Derivation of Hematocrit Adjustment Factor for Glucose

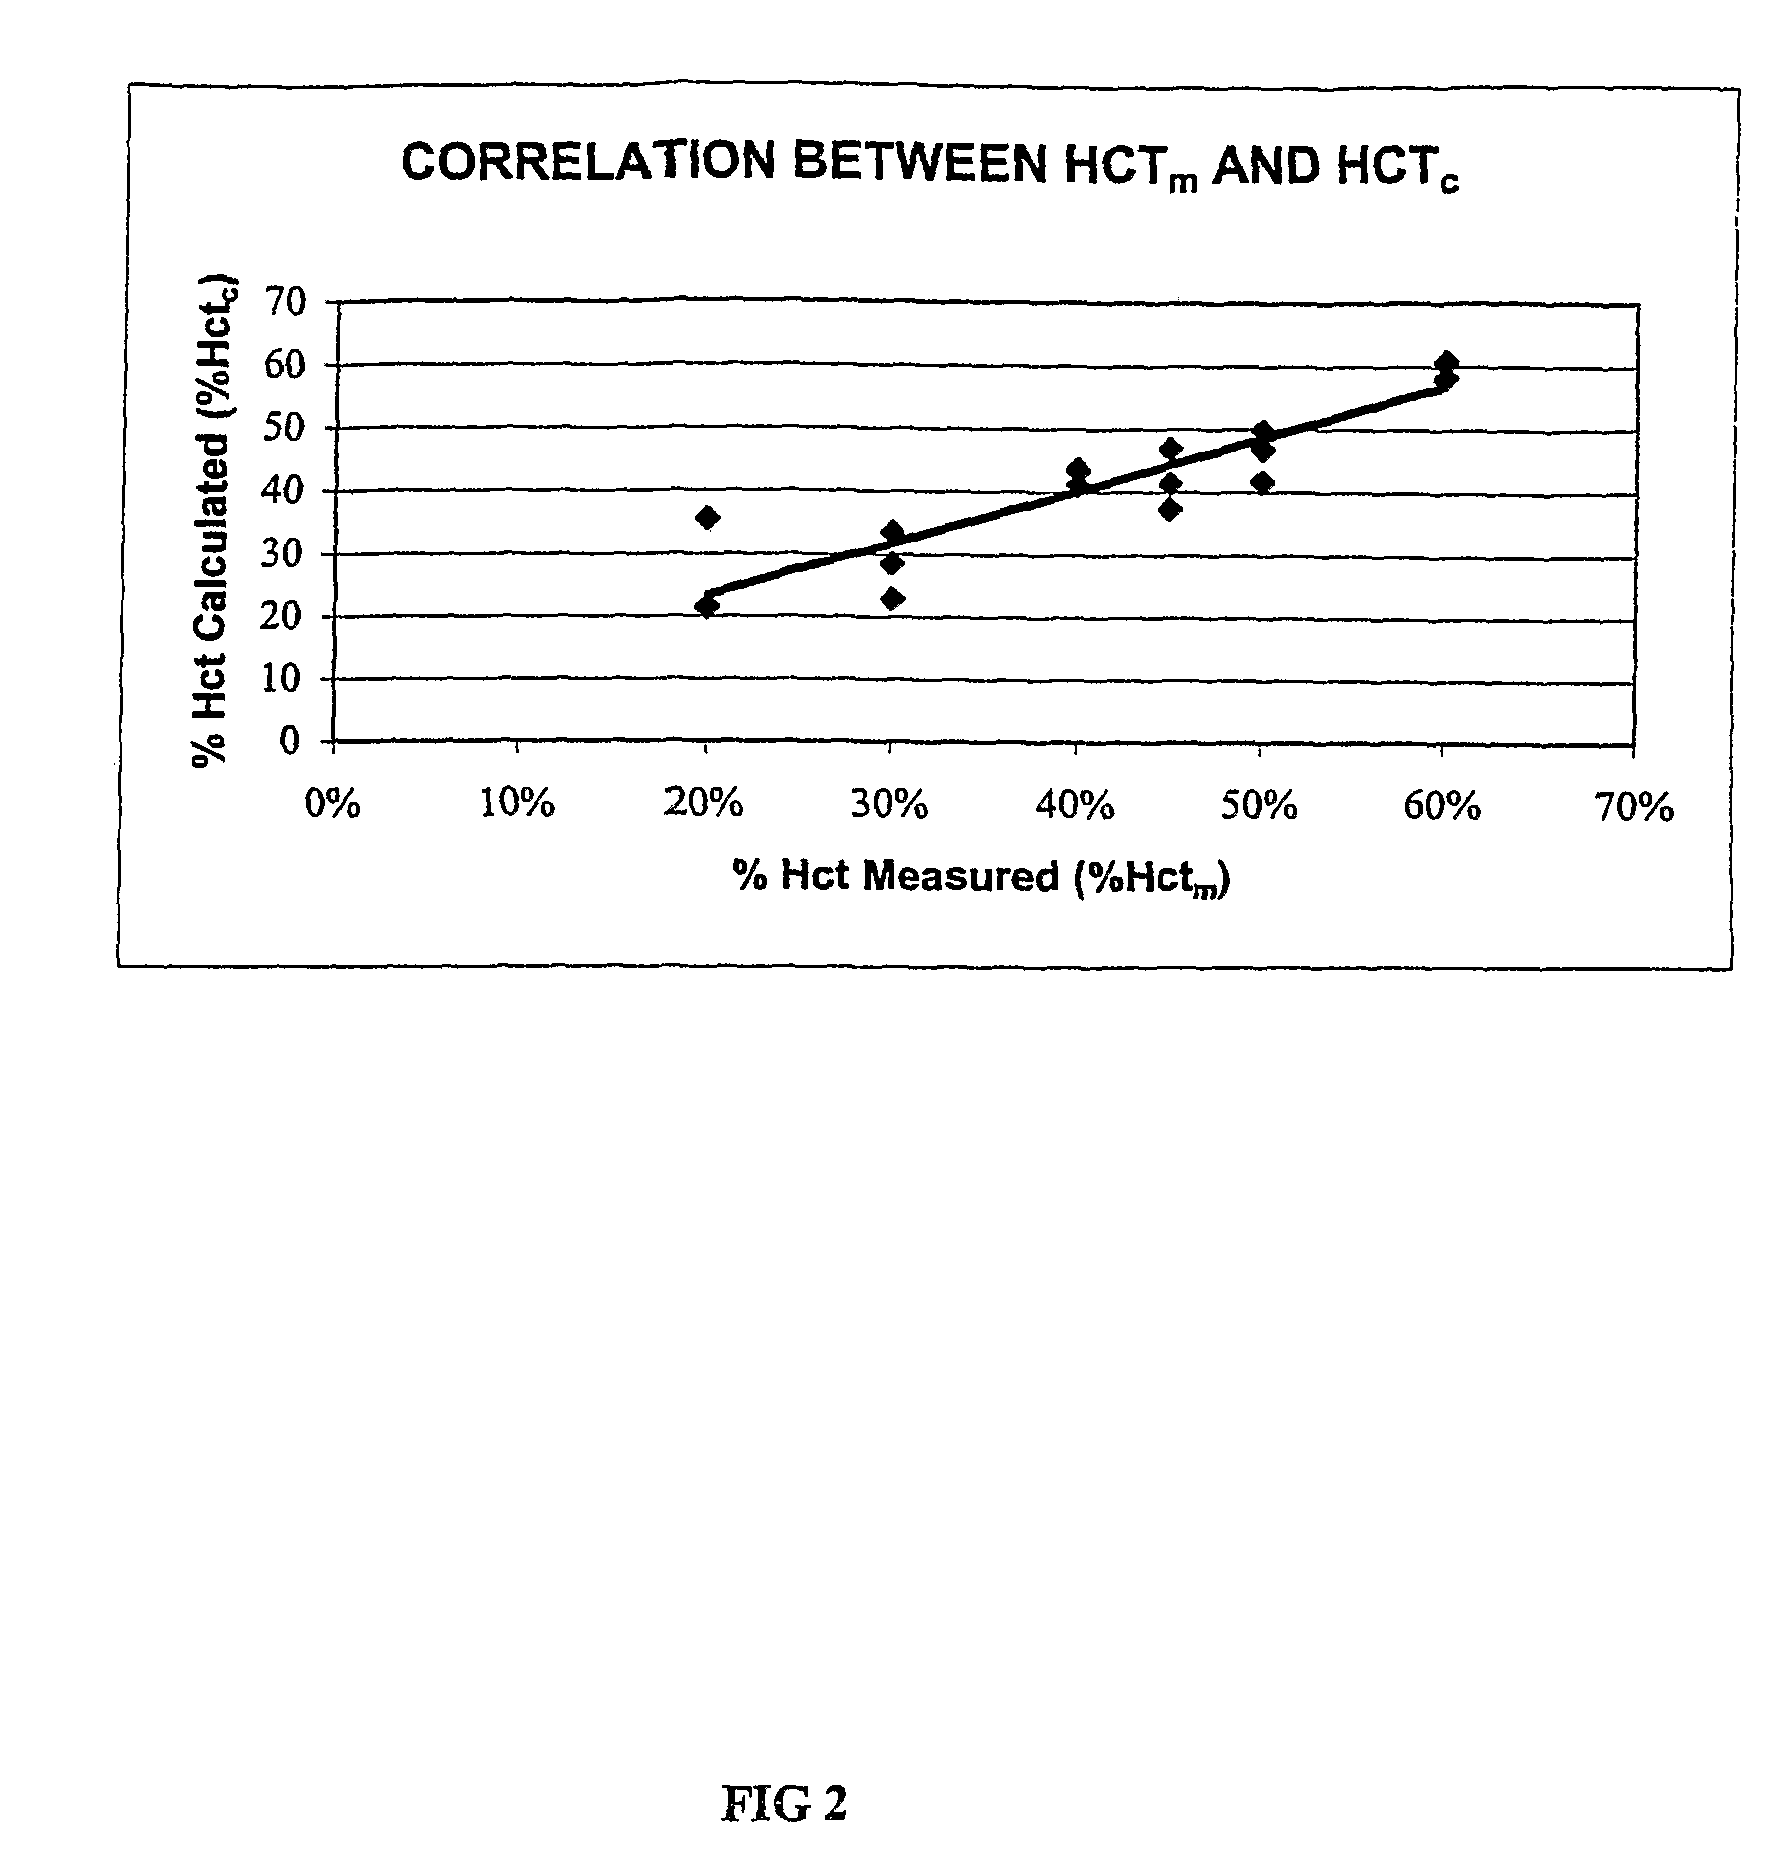
[0073]This example explains the derivation process for one embodiment of Equation 3 described above. Six whole blood samples were obtained and were divided into Samples 5-10. Using the hematocrit adjustment protocol set forth in Example I above, the hematocrit contents of Samples 5-10 were adjusted to 20 Vol. %, 30 Vol. %, 40 Vol. %, 45 Vol. %, 50 Vol. %, and 60 Vol. % Hct respectively (i.e., the measured percent hematocrit, % Hctm, levels). The measured percent hematocrit, % Hctm, levels (i.e., the 20 Vol. %, 30 Vol. %, 40 Vol. %, 45 Vol. %, 50 Vol. %, and 60 Vol. % Hctm levels) were obtained by measurement on a Compur M1100 micro-centrifuge.

[0074]Using three lots of DEX® biosensor reagents (Lots C, D, and E) and a BAS 100B Analyzer electrochemical device, the resistance of the blood sample (Rcell) and the resistance of plasma (Rplasma) of Samples 5-10 were measured. The test potential of the working electrode was 400 mV, and th...

example 3

Determination of Adjustment Factor

[0084]This example explains the process involved in determining the need for hematocrit correction, in determining the hematocrit correction factor, and in performing the hematocrit correction. The process begins by having a home glucose monitor user apply blood to an electrochemical sensor. The home glucose monitor will electrochemically determine the resistance of the blood sample, Rcell, using a biosensor reagent. The resistance of plasma, Rplasma, for the particular sensor lot will be electrochemically determined using a biosensor reagent by the manufacturer prior to shipment of the home glucose monitor. The value of Rplasma will be stored in the calibration chip or label or will be provided to the user for programming into the home glucose monitor.

[0085]Using the values of Rcell and Rplasma, the calculated resistance of red blood cells, RRBC, is mathematically determined within the home glucose monitor. Once the RRBC has been determined, the pe...


PUM

PropertyMeasurementUnit
volumeaaaaaaaaaa
concentrationsaaaaaaaaaa

Abstract

Methods and devices for performing in situ hematocrit adjustments during glucose testing using glucose-monitoring products and using those adjusted values to estimate the hematocrit value of blood samples to reduce or eliminate the assay bias caused by the different hematocrit levels of blood samples. One method involves measuring the glucose value, Glum, of the blood sample; measuring the resistance of the blood sample (Rcell) using a biosensor reagent; measuring the resistance of plasma (Rplasma) using the biosensor reagent; determining the calculated resistance of red blood cells, RRBC, of the blood sample according to the relationshipRRBC=Rcell−Rplasma;calculating the percent hematocrit, % Hctc, of the blood sample; determining whether to adjust the glucose value, Glum, to an adjusted glucose value, Gluadj; and using the percent hematocrit, % Hctc, and either the glucose value, Glum, or the adjusted glucose value, Gluadj, to adjust for any bias of the biosensor reagent.

Description

CROSS REFERENCE TO RELATED APPLICATION[0001]This application claims priority to Application No. 60 / 571,389 filed on May 14, 2004, which is incorporated by reference in its entirety.FIELD OF THE INVENTION[0002]The invention relates to methods and devices for correcting the glucose bias in glucose-monitoring products to provide more accurate glucose readings of blood samples. In particular, the invention relates to methods and devices for performing in situ hematocrit adjustments during glucose testing using glucose-monitoring products and using those adjusted values to estimate the hematocrit value of blood samples to reduce or eliminate the assay bias caused by the different hematocrit levels of blood samples.BACKGROUND OF THE INVENTION[0003]Hematocrit is the volume of red blood cells (RBC) expressed as a percentage of the volume of RBC in a whole blood sample. The normal hematocrit range for a typical human being is about 40 Vol. % to about 45 Vol. %. In extreme cases, the hematocr...

Claims


Application Information

Patent Timeline
Patent Type & Authority Patents(United States)
IPC IPC(8): G01N33/66G01N33/50G01N27/06G01N27/416G01N33/487
CPCG01N27/3274Y10T436/144444
Inventor DENG, YINGPINGJAMISON, SHERRY J.
Owner ASCENSIA DIABETES CARE HLDG AG
Why Eureka
Try Eureka