
Method and system for the graphical modeling of data and calculations of a spreadsheet

a spreadsheet and data technology, applied in the field of computer based calculations, can solve problems such as complex structures, and achieve the effect of reducing the number of images displayed

Inactive Publication Date: 2011-07-19
ZDENEK ANDREW JOSEPH
View PDF5 Cites 42 Cited by
  • Summary
  • Abstract
  • Description
  • Claims
  • Application Information

AI Technical Summary

Benefits of technology

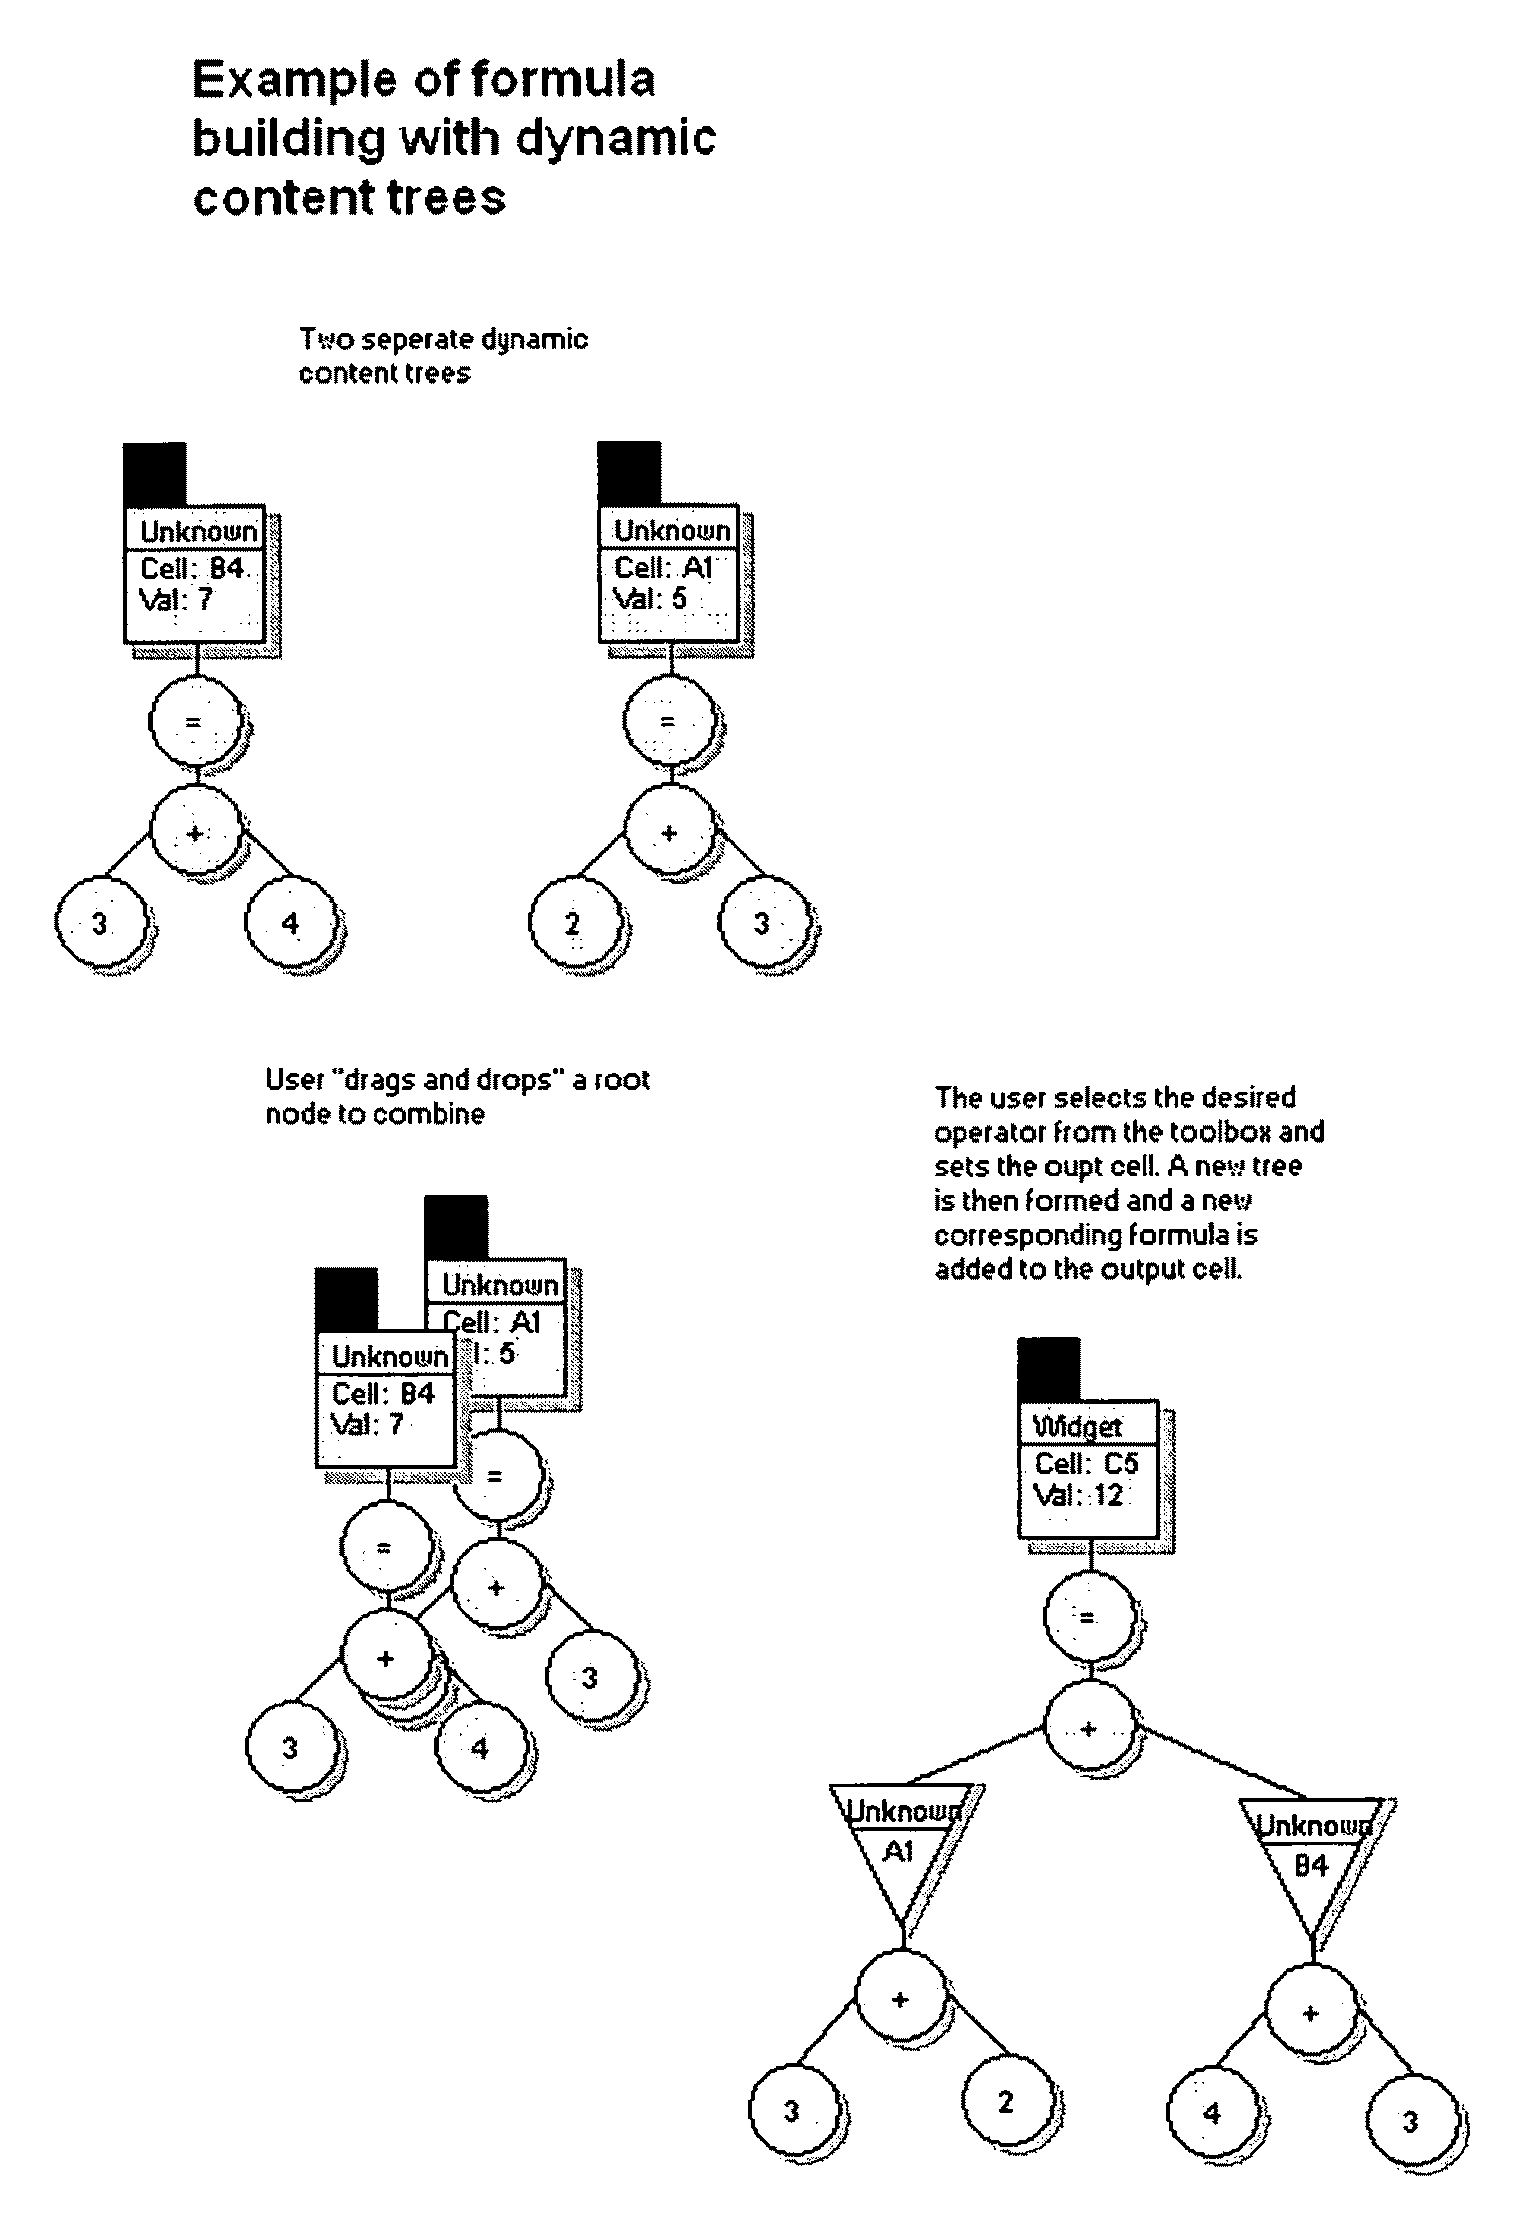
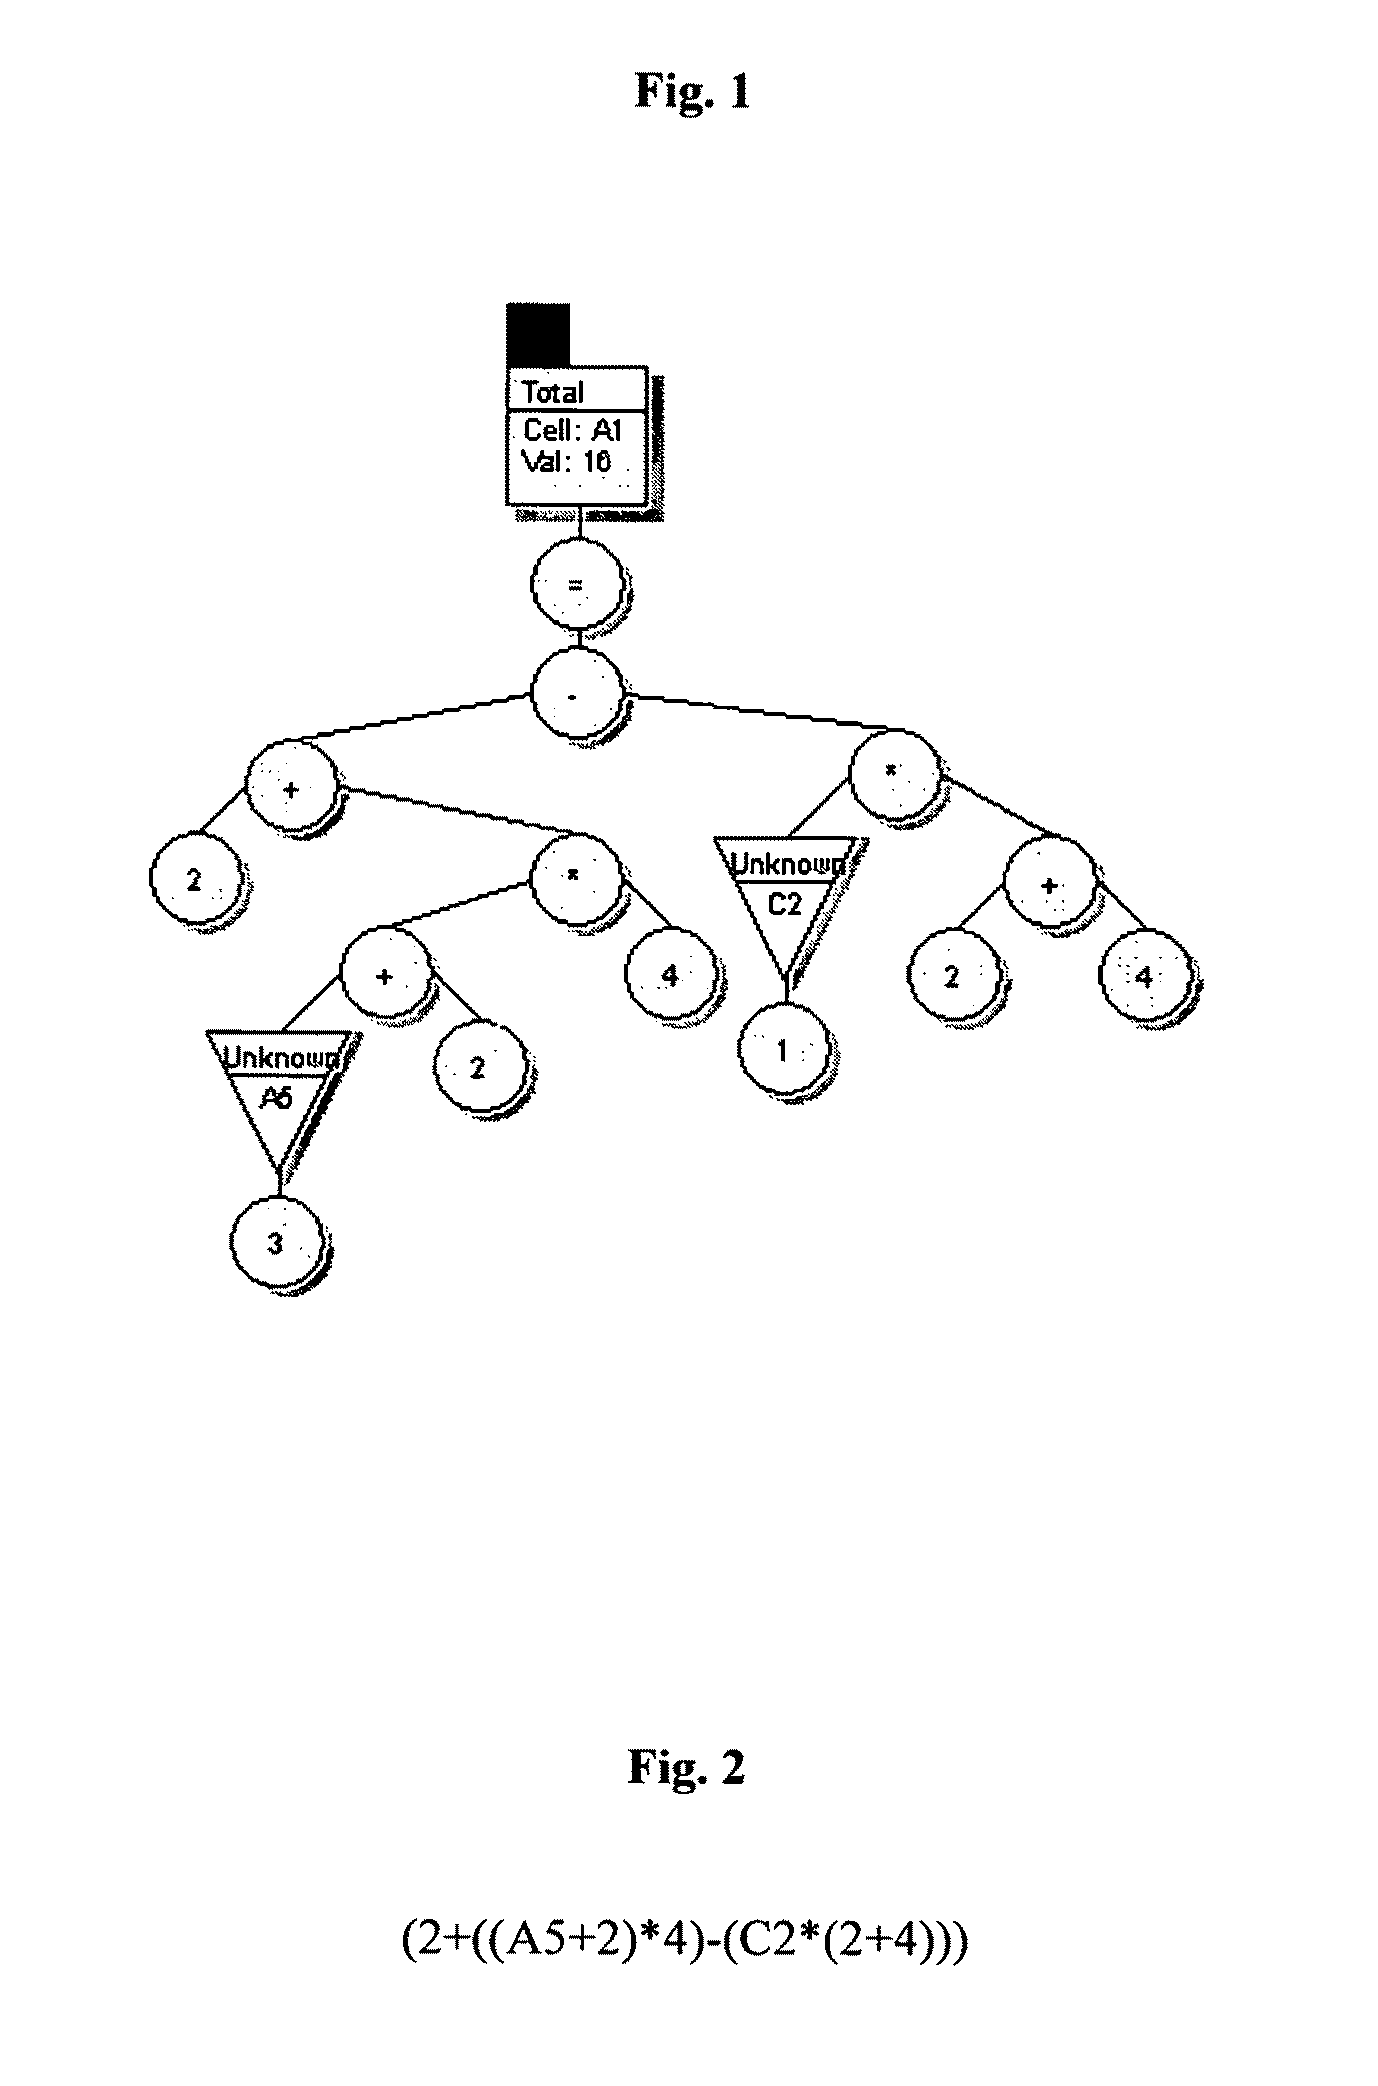
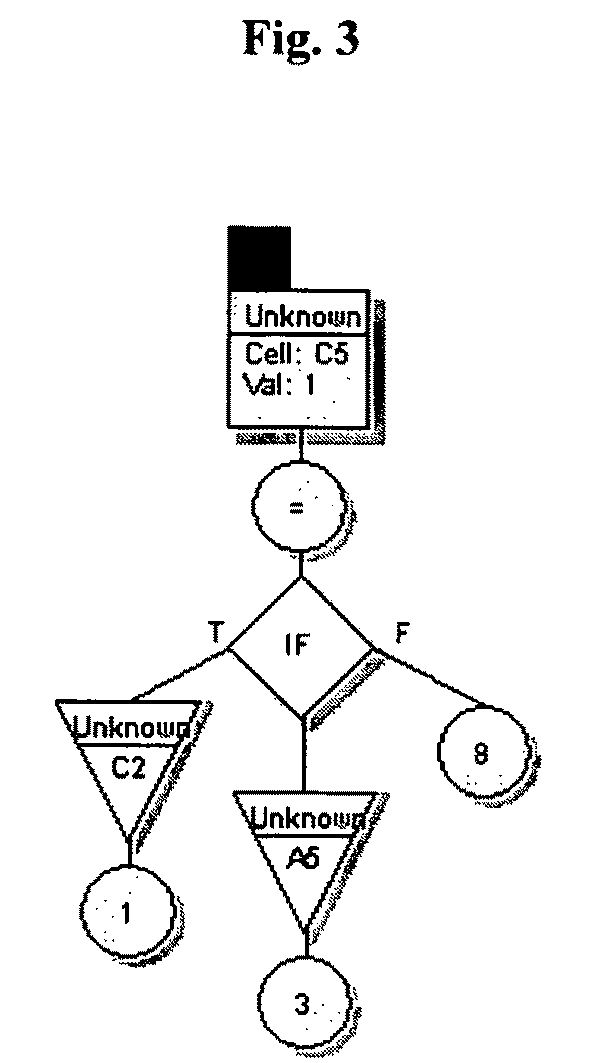
[0012]The present invention provides a means to gather and convert the formulas and data contained within a spreadsheet into graphical representations. The graphical representations consist of nodes and edges connected in a tree or graph structure. The nodes represent the operators and operands of the formula and are arranged according to operational precedence within an expression hierarchy. The nodes and edges of each expression hierarchy can be rendered as various shapes within a view or display. If a formula contains a reference to a separate cell the contents of the referenced cell are included in the expression hierarchy of each referring formula's expression hierarchy to create a compound expression hierarchy. The present invention allows the user to view a plurality of such expression hierarchies and compound expression hierarchies concurrently within a view to obtain a comprehensive model of the system. Displaying several expression hierarchies concurrently within a view can produce a large number of images within the display. To create a more efficient graphical model, the present invention reduces the number of images displayed at a time by combining redundant sets of nodes shared between or within expressions and compound expressions into one shared expression. The present invention can keep both the graphical representation and textual representations functionally equivalent by translating changes made to one into the appropriate changes to the data defining the other. In doing so, the present invention effectively provides a graphical interface for working with formulas within a spreadsheet.

Problems solved by technology

Such a process creates complex structures that display the complete flow of calculation across separately located formulas.

Method used


Image

  • Method and system for the graphical modeling of data and calculations of a spreadsheet
  • Method and system for the graphical modeling of data and calculations of a spreadsheet
  • Method and system for the graphical modeling of data and calculations of a spreadsheet

Examples


Embodiment Construction

[0043]The preferred embodiment of the present invention consists of computer software. As such, the software can be highlighted based on an overview of methods and processes.

[0044]The discovery method of the present invention relates to the process of gathering meaningful information from a spreadsheet. This is accomplished via a link to the spreadsheet application or an associated spreadsheet file. Such links are commonly implemented through information sharing routines of computer software and are well known to those familiar with the art. The present invention could also be embodied as a component of the spreadsheet application itself. In the second embodiment the link can be considered an internal routine of the spreadsheet application. Determining the desired sections of a spreadsheet to gather source data from may be accomplished through user selection from a list of available sources. Available sources may consist of an area, range or entire sheet within a spreadsheet or seve...


PUM


Abstract

A method and system for the graphical modeling of calculations in a spreadsheet that provides a graphical representation of formulas and data contained in a spreadsheet. The graphical representation consists of nodes and edges connected in a tree or graph structure. The nodes represent operators and operands of a formula and are arranged in an expression hierarchy based on operational precedence. Formulas containing cell references are represented through a compound expression hierarchy consisting of an expression hierarchy that includes a descendant expression hierarchy representing the contents of each referenced cell. Expression hierarchies that share similar nodes can be represented through a shared graphical representation to reduce the number of items displayed concurrently within a view and to simplify multiple formula edits. The expression hierarchies and the formulas they represent are kept consistent so that changes made to either can be reflected in both the spreadsheet and graphical representation.

Description

CROSS-REFERENCE TO RELATED APPLICATIONS[0001]Provisional Patent Application: 60 / 654,641 Filed: Feb. 18, 2005[0002]Provisional Patent Application: 60 / 705,888 Filed: Aug. 5, 2005FEDERALLY SPONSORED RESEARCH[0003]Not ApplicableSEQUENCE LISTING[0004]Not ApplicableBACKGROUND[0005]1. Field of the Invention[0006]The present invention relates to computer based calculations and more specifically those performed by programs commonly known as “spreadsheets”. Spreadsheets provide a system for arranging sets of calculations and data within an organized layout. Spreadsheets are comprised of a series of horizontal and vertically aligned adjacent regions referred to as cells. Within these cells a user can enter formulas consisting of a series of operators and operands in infix notation. Once the formula is entered into a cell the spreadsheet program can be set to perform the calculation and display the results within the cell containing the formula. The formulas can also be built with interdependen...

Claims


Application Information

Patent Timeline
Patent Type & Authority Patents(United States)
IPC IPC(8): G06F17/00G06F7/00G06F40/14
CPCG06F17/215G06F17/2247G06F17/246G06F40/111G06F40/14G06F40/18
Inventor ZDENEK, ANDREW JOSEPH
Owner ZDENEK ANDREW JOSEPH
Learn More