Calibration tool

a technology of calibration tool and tool body, which is applied in the direction of liquid/fluent solid measurement, instruments, nuclear elements, etc., can solve the problems of impracticability and high cost of process, and achieve the effect of populated more efficiently, good results and good results

Inactive Publication Date: 2012-07-24
DASAN INVEST CO LTD
View PDF13 Cites 19 Cited by
  • Summary
  • Abstract
  • Description
  • Claims
  • Application Information

AI Technical Summary

Benefits of technology

[0022]The calibration tool may populate more than one look-up table or data matrix and may calculate sets or arrays of coefficients and write these sets to the look-up table or a plurality of look-up tables. In general it will be necessary to input certain ‘hard data’ relating to the vehicle frontal area, drag coefficient, mass, etc. as referred to above and to drive the vehicle over a minimum predetermined cycle to determine the initial calibration. Such a drive cycle will involve an acceleration stage and an over-run stage. Coasting and constant speed stages will improve the accuracy of the coefficients. Where more relevant data, such as fuel demand or mass air flow, becomes available from the OBD the resulting more precise coefficients may be used to replace those obtained from the more empirical drive cycle.
[0025]The tool may collect some data via an OBD system and some data directly from other sensors mounted appropriately on the vehicle. This may be advantageous in the situation where a particular set of vehicle data is not accessible via the vehicle's OBD system or communications system.
[0038]Strategy 1 naturally provides the most accurate indication of fuel consumption and the most accurate coefficients, but may not be readily available or be too delayed to be of much use. Strategy 2 is more usually available and produced good results from the calculated air mass flow. Strategy 3 produces good results when combined with the drive cycle initiation, and can often be refined by comparing the coefficients with those from Strategy 2 when they are available. It should be noted that the inputs for Strategy 3 have the advantage that they are always available without delay. It is the use of the vehicle-specific coefficients stored in the array or look-up tables that permits the calculation of fuel and other desired predicted outputs using the inputs of Strategy 3 that is the essence of the invention.
[0039]In order to derive the required coefficients, the calibration tool may prompt a user of the vehicle to operate the vehicle according to steps of a pre-determined test cycle. This may advantageously allow the look-up tables with the coefficients to be accessed by the vehicle monitoring device to be populated more efficiently. As an example, the vehicle operator may be prompted to start the engine from a cold condition and then drive the vehicle. The operator may then be prompted to drive according a pre-defined set of engine / vehicle operating conditions, e.g. maintaining various different steady speeds, accelerations through all gears, coasting in all gears, and to slow down in an over-run condition with no accelerator, closing the throttle completely.
[0053]Thus, for example, the tool may populate a look-up table with a set of coefficients that describe the conversion of chemical energy into rotational energy at the crankshaft, or it may populate a plurality of look-up tables with sets of coefficients describing the losses in converting rotational energy from the vehicle crankshaft to forward motion in the vehicle, the work done by the engine to gather intake air and trap it in the cylinder for combustion, the work done by the engine to force exhaust gases into the atmosphere through the exhaust and enabling estimation of the exhaust gas temperature from fuel injected.
[0062]There may be other software implemented steps, for example, prompting an operator to complete a number of pre-determined vehicle driving steps in order to populate the look-up tables more efficiently.

Problems solved by technology

In principle this could be achieved by providing a large number of data inputs to the device or by laboratory testing of each vehicle but these processes would be impracticable and expensive.

Method used


Image

  • Calibration tool
  • Calibration tool
  • Calibration tool

Examples


Embodiment Construction

[0068]The invention will now be described by way of example with reference to the accompanying diagrams, in which;

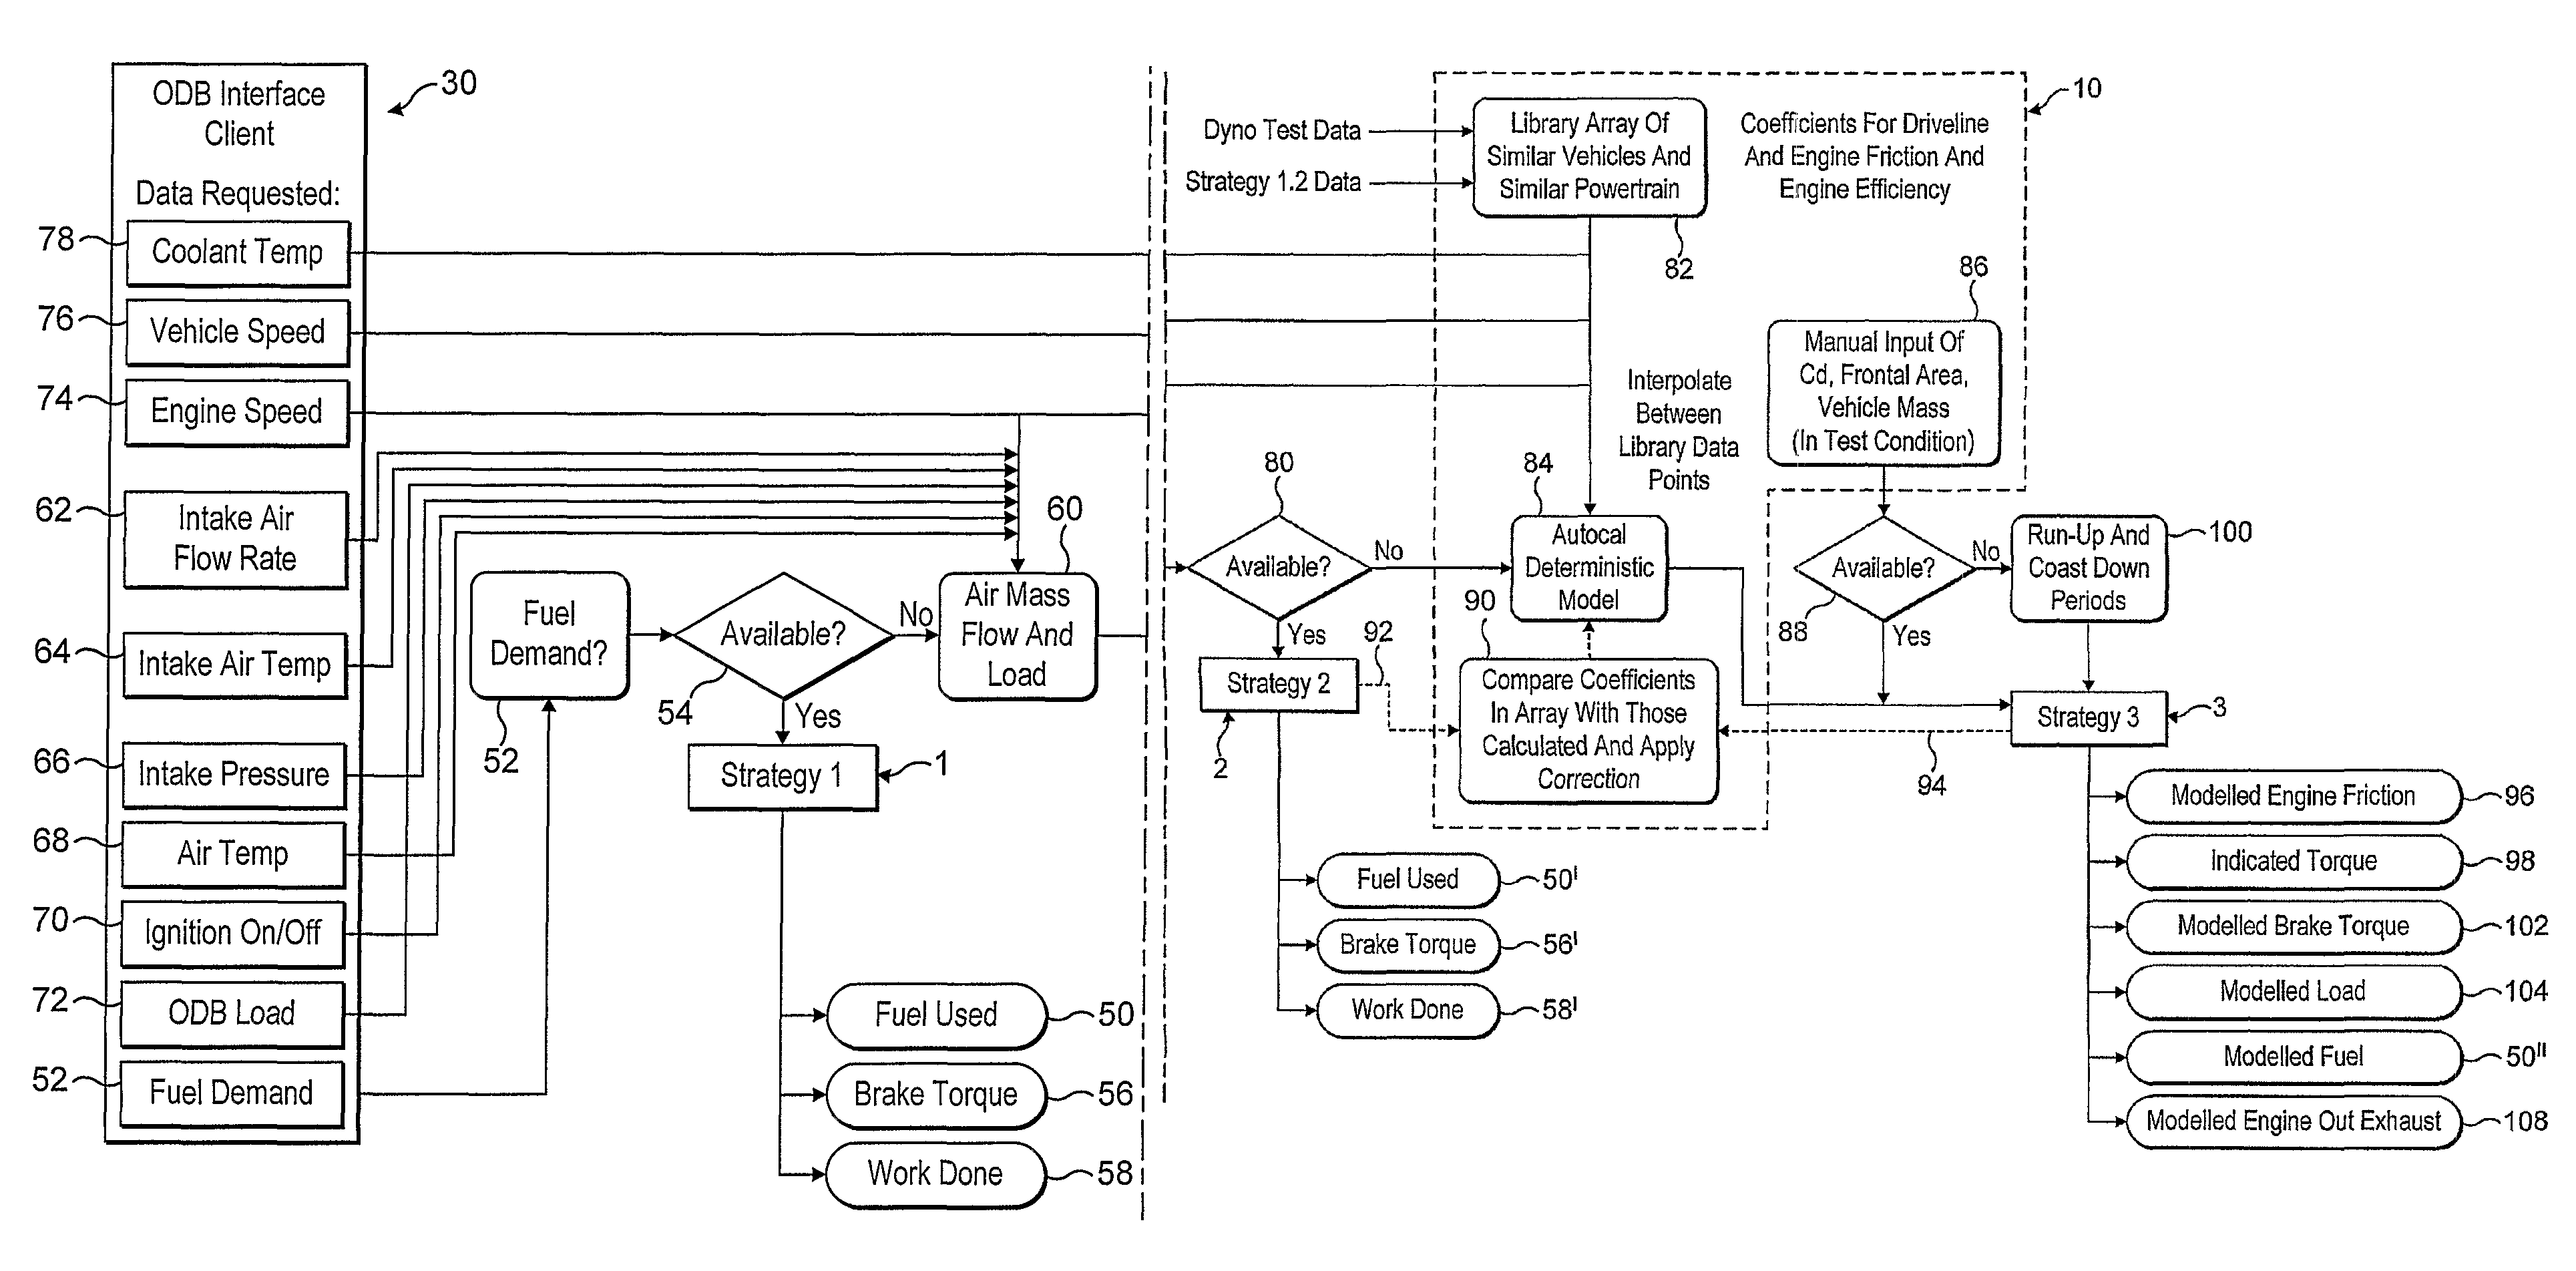
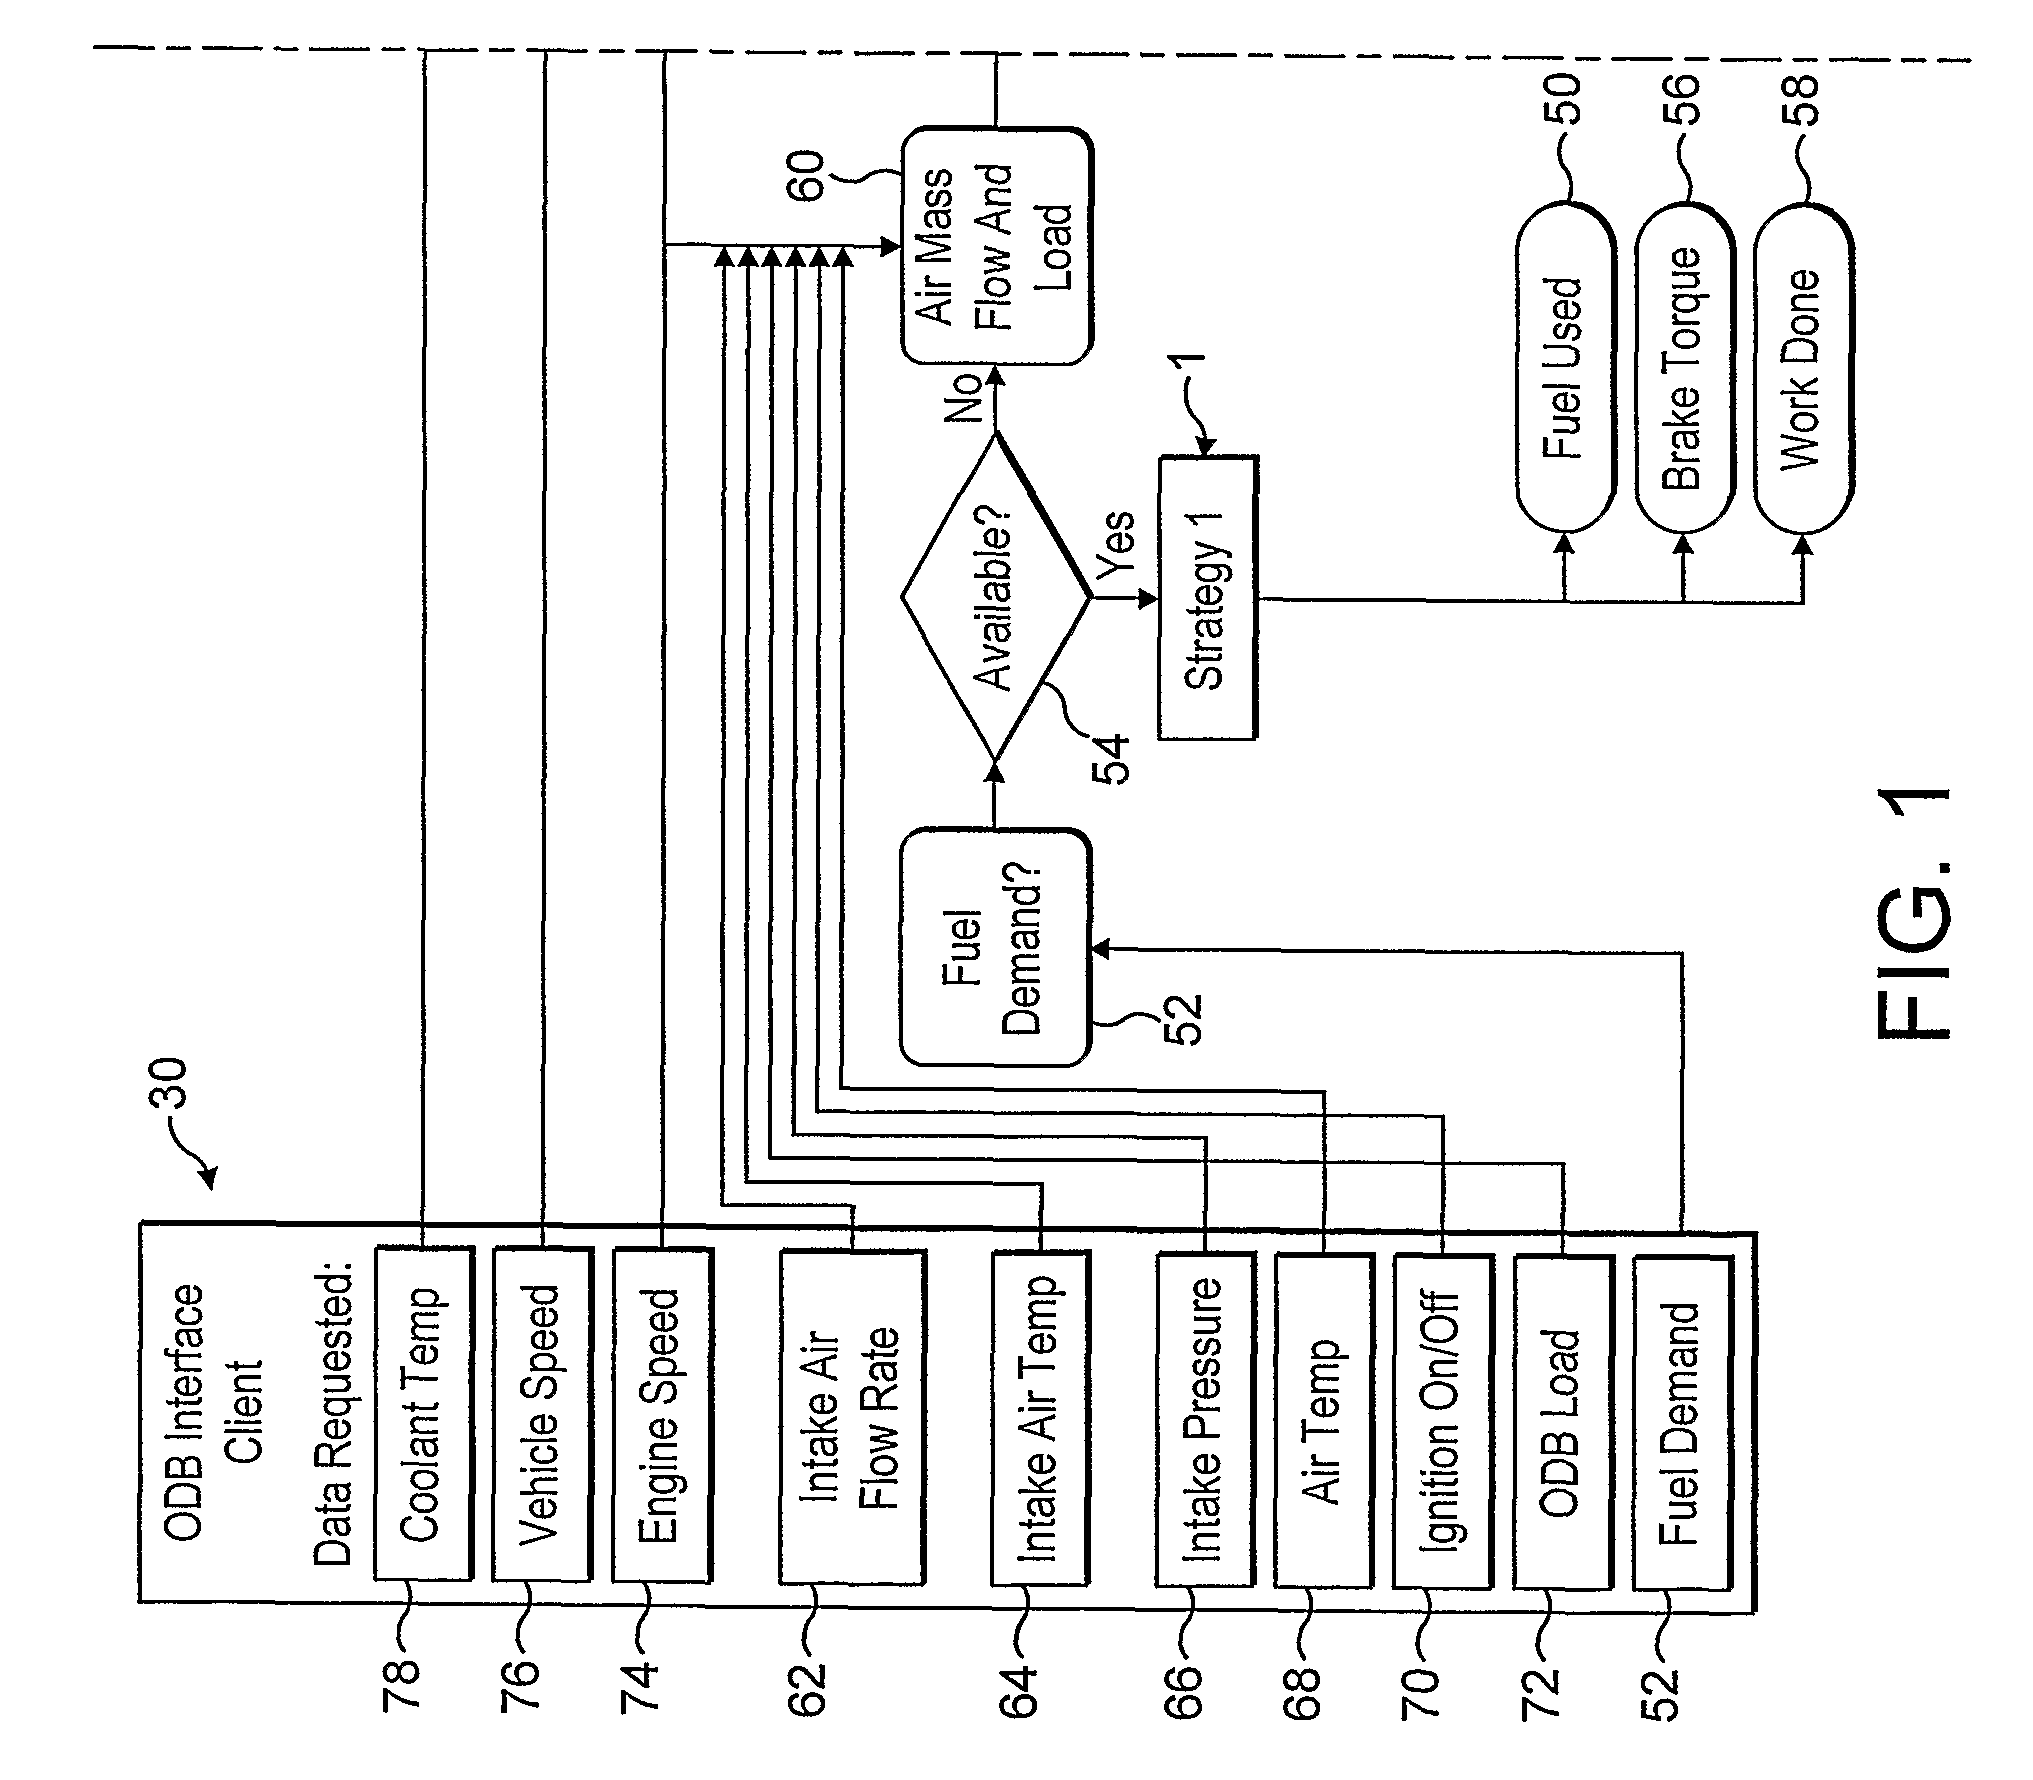
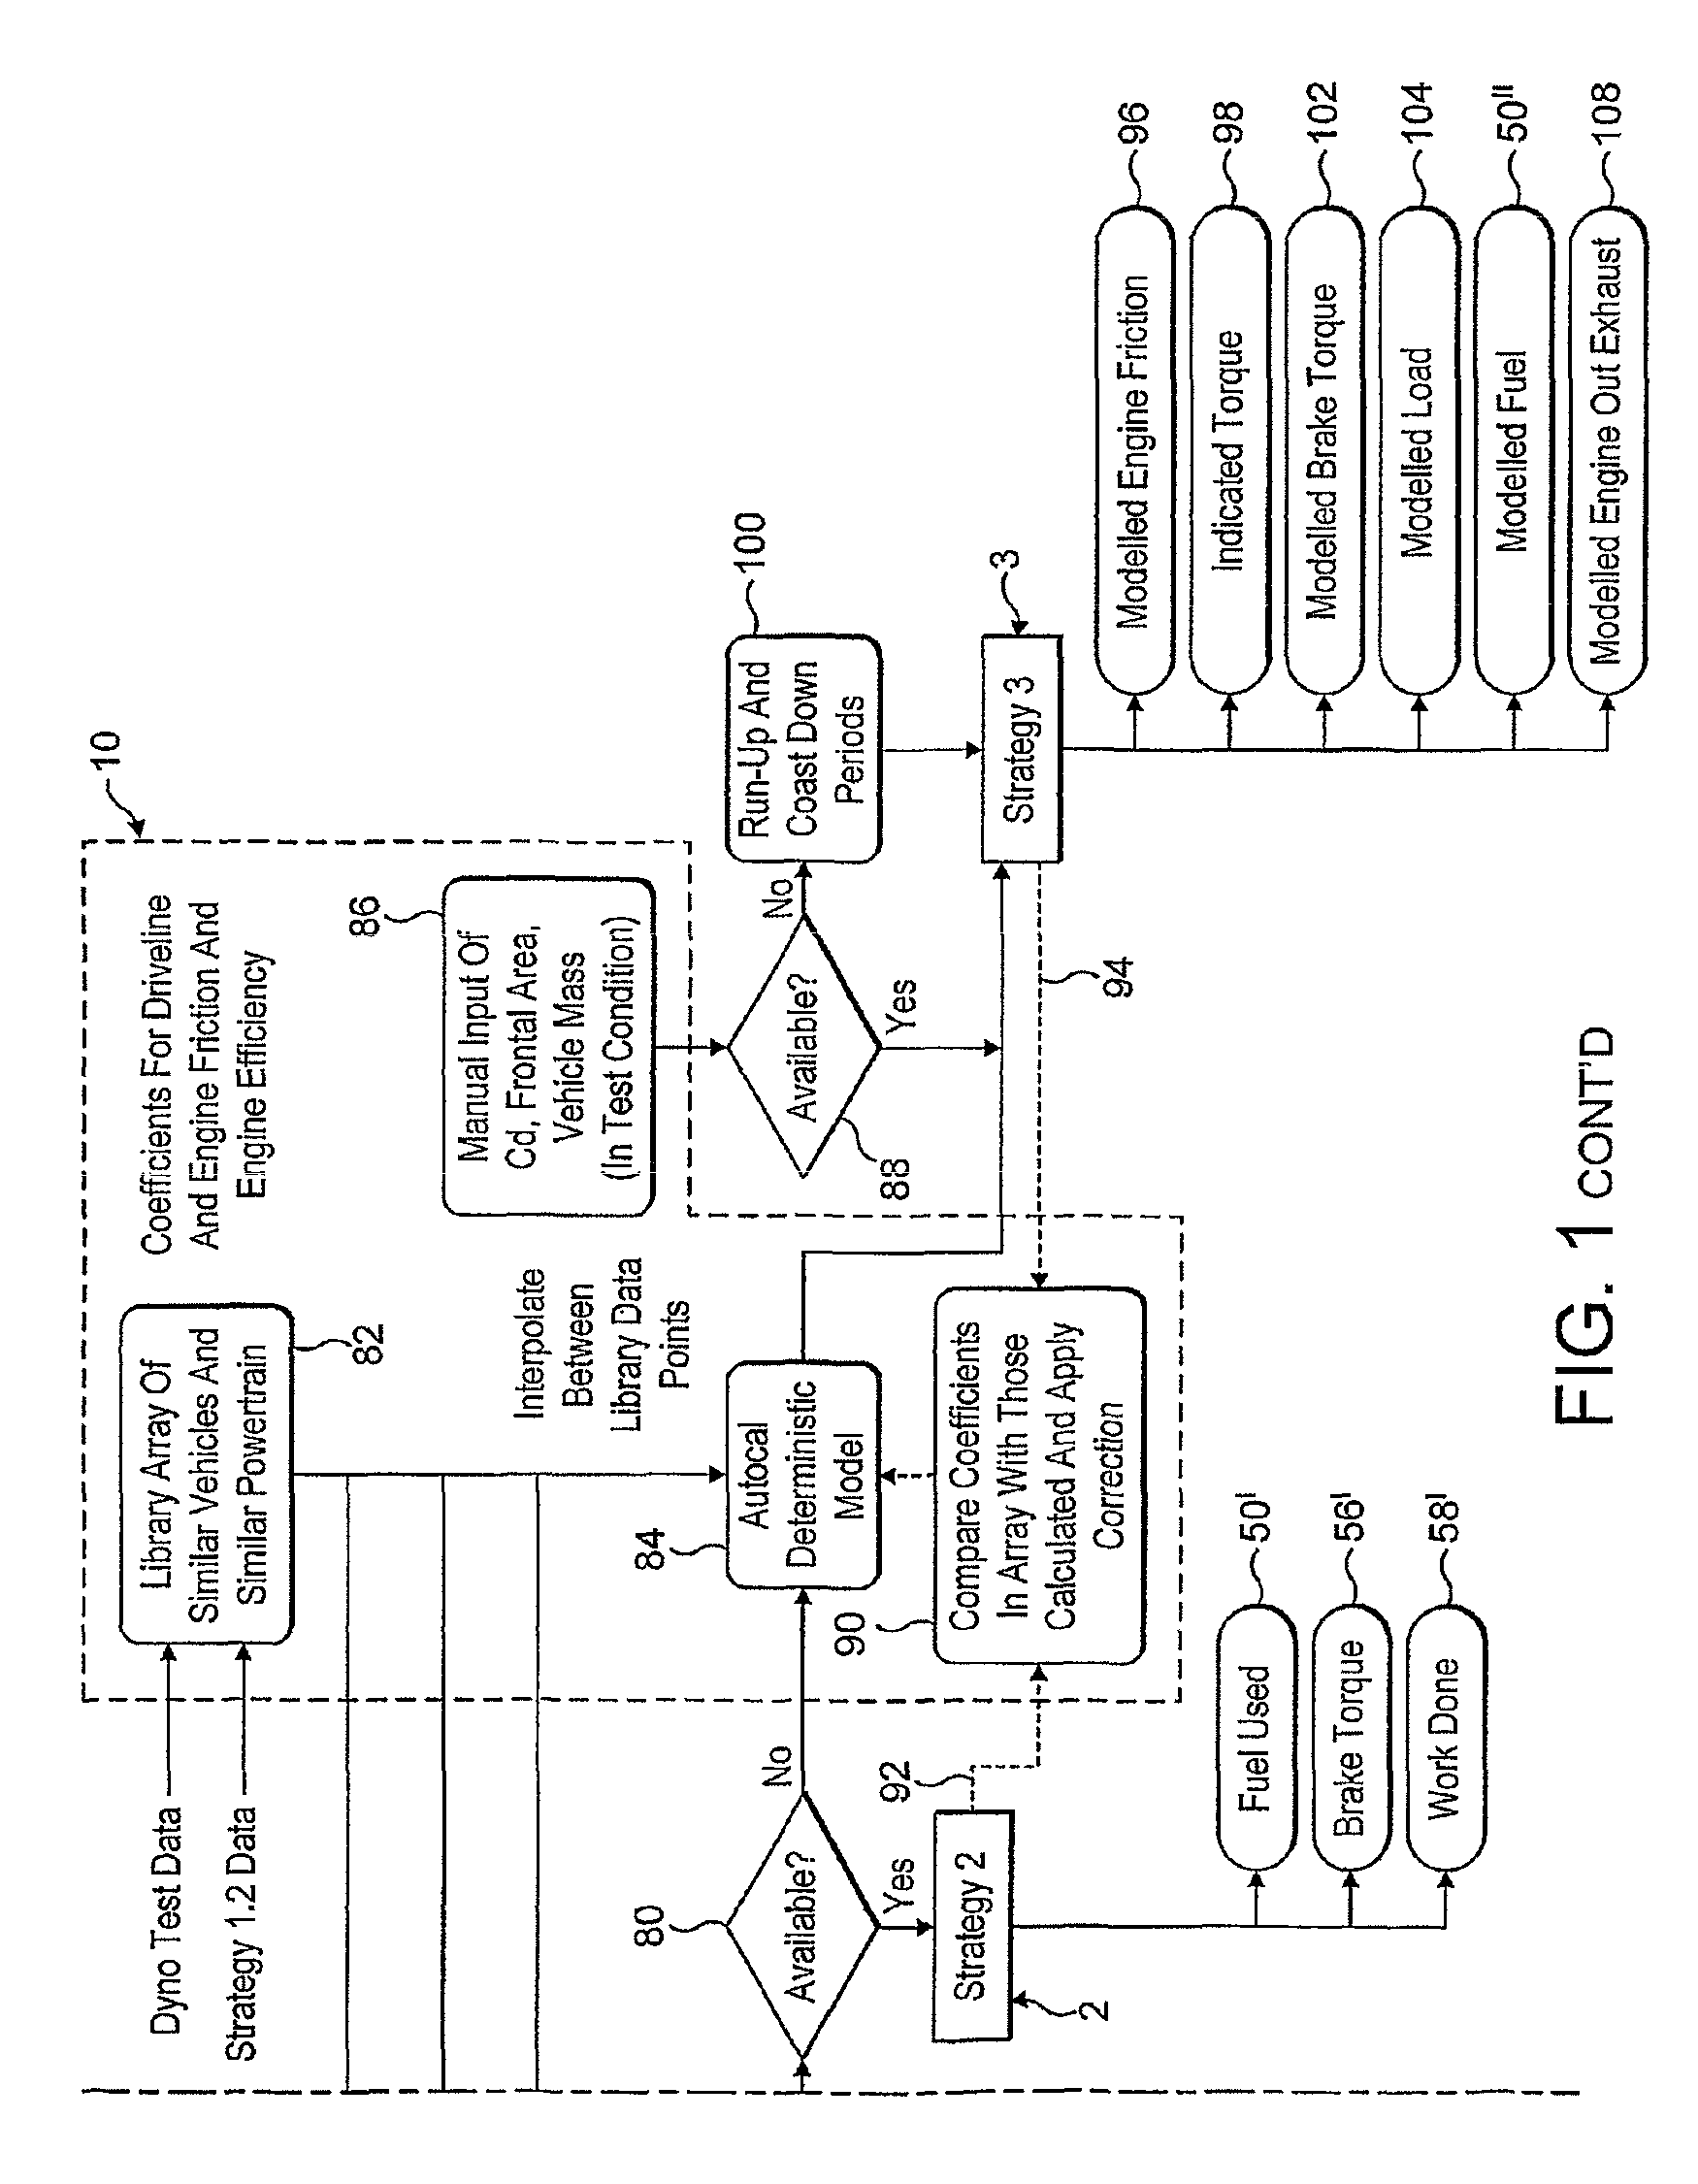
[0069]FIG. 1 represents a schematic flow chart showing a calibration tool in accordance with the invention in a typical arrangement with a vehicle monitoring device;

[0070]FIG. 2 is a schematic diagram illustrating a number of different ways in which a calibration tool in accordance with the invention can be linked to a vehicle monitoring device for calibration; and

[0071]FIG. 3 is a flow chart illustrating a calibration method for use with a calibration tool in accordance with the invention, where a vehicle operator carries out a number of predetermined actions.

[0072]Referring to FIG. 1, the diagram shows a calibration tool 10 associated with a vehicle monitoring device (VMD) 20 connected to an On-board Diagnostics port (OBD) 30 as defined, which supplies various outputs which can be accessed by the calibration tool 10 and the VMD 20.

[0073]The calibration tool and / or the ...


PUM


Abstract

The invention provides a calibration tool for a vehicle monitoring device, the tool having a processor with a clock or access to a time signal and arranged for connection to and to receive and process signals from a vehicle on-board diagnostics unit (OBD), the processor having or connected to means for storing data relating to the vehicle and its engine and codes relating to signals from the available OBD outputs and inputs, the processor being programmed to calculate and store certain coefficients derived over the vehicle's operating range and to populate an array with the said coefficients so that the processor can look up the corresponding co-efficient from the array to calculate the desired value or output. The invention extends to a method of calibrating a calibration tool or a vehicle-monitoring device mounted in a vehicle provided with such a calibration tool. The method comprises the steps of configuring the calibration tool to receive data from vehicle sensors including those indicating vehicle road and engine speed data and temperature data, operating the vehicle, processing the data received during operation of the vehicle to calculate coefficients specific to the vehicle, and populating look-up tables that are accessible to the vehicle monitoring device with the calculated coefficients.

Description

[0001]The invention relates to a method of calibrating a vehicle-monitoring device and a calibration tool for use in such a method. The calibration tool calibrates a vehicle-monitoring device to allow the device to provide vehicle-specific data.BACKGROUND[0002]When a road vehicle is equipped with a vehicle monitoring device, which is capable of outputting and / or displaying vehicle operating parameters, such as fuel economy, exhaust emissions, or engine load, the device needs to be calibrated to reflect the specific characteristics of the vehicle to which it is attached over its operating ranges, both under load and in various climatic conditions. The device may additionally need to be recalibrated on an on-going basis to reflect its load or the operating conditions or characteristics of the vehicle.[0003]The vehicle monitoring device may be programmed to be able to output the exhaust tailpipe emissions of the vehicle, for example to ensure compliance with regulations. It will also n...

Claims


Application Information

Patent Timeline
Patent Type & Authority Patents(United States)
IPC IPC(8): G01D18/00
CPCG07C5/08G01D18/00G05B23/02G01D18/008
Inventor WILLARD, ALEXANDER EDWARDHATIRIS, EMMANOUIL
Owner DASAN INVEST CO LTD
Why Eureka
Try Eureka