Process, device and system for mapping transformers to meters and locating non-technical line losses

a transformer and meter mapping technology, applied in transmission systems, data processing applications, instruments, etc., can solve the problems of inaccurate records, incorrect wiring, and inability to accurately perform transformer-to-meter mapping, and achieve quasi-real-time determination and localization of non-technical line losses. , the effect of accurate transformer-to-meter mapping

Active Publication Date: 2012-11-27
TRILLIANT NETWORKS
View PDF546 Cites 16 Cited by
  • Summary
  • Abstract
  • Description
  • Claims
  • Application Information

AI Technical Summary

Benefits of technology

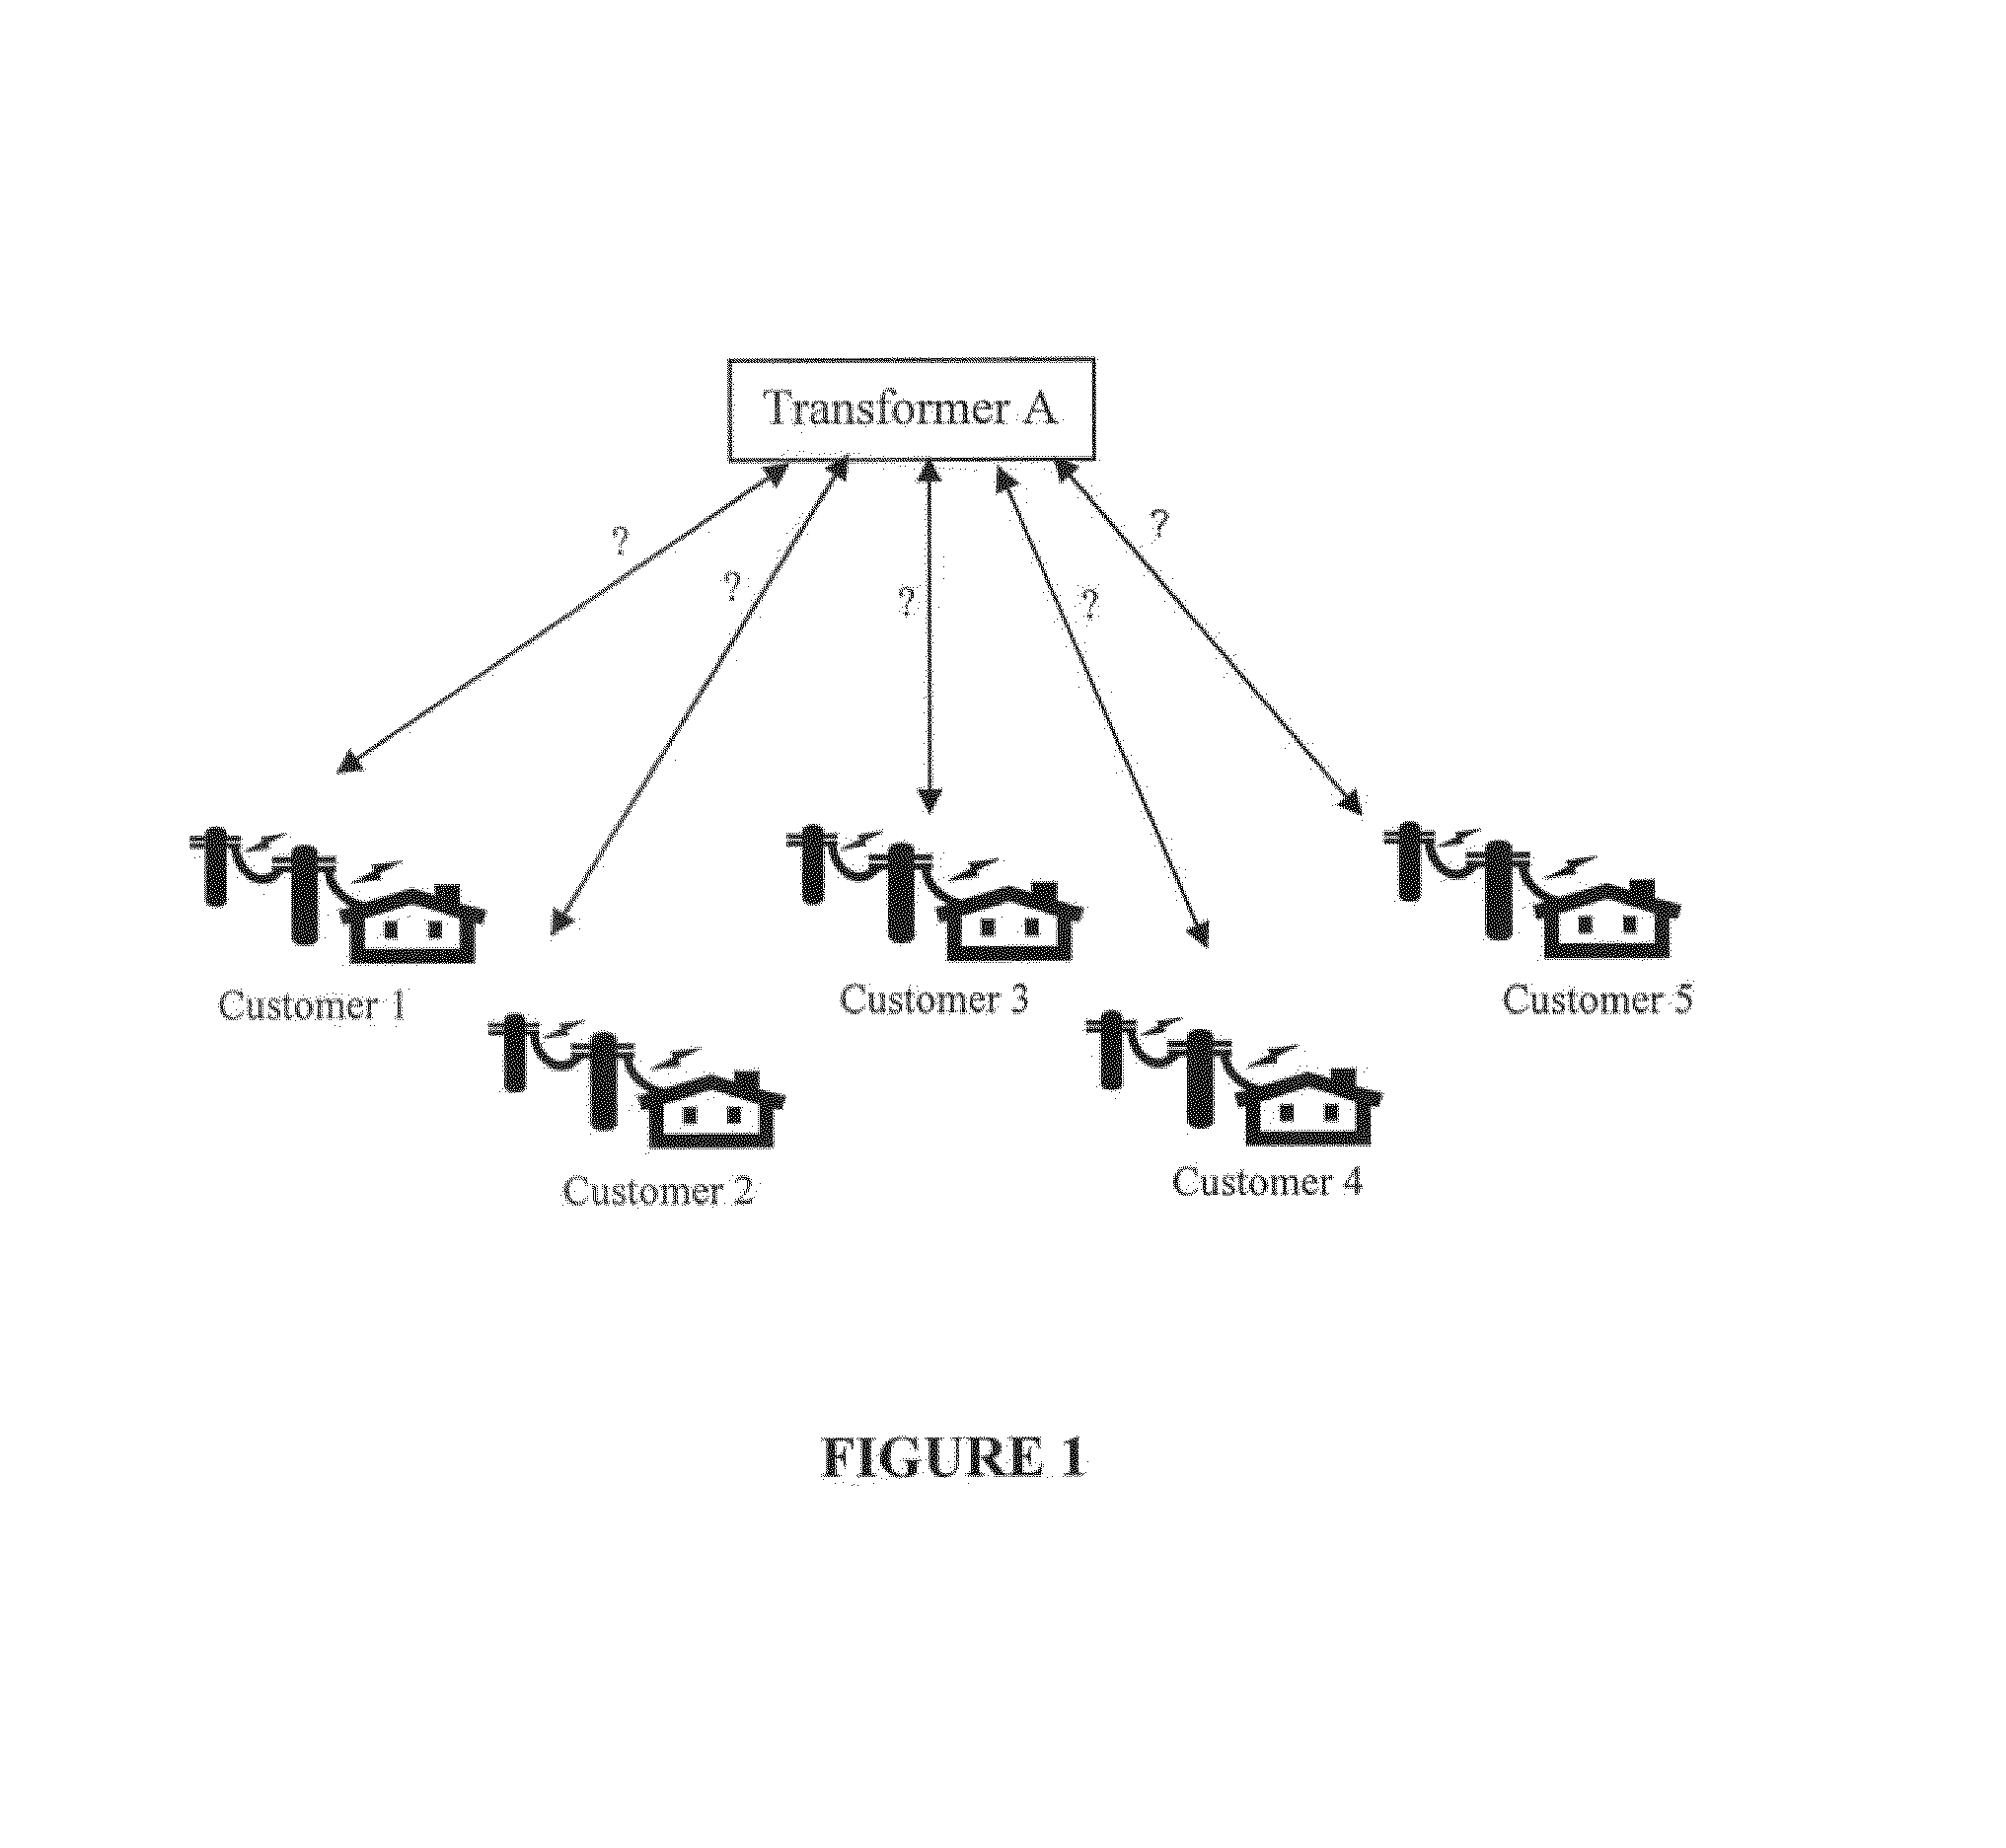
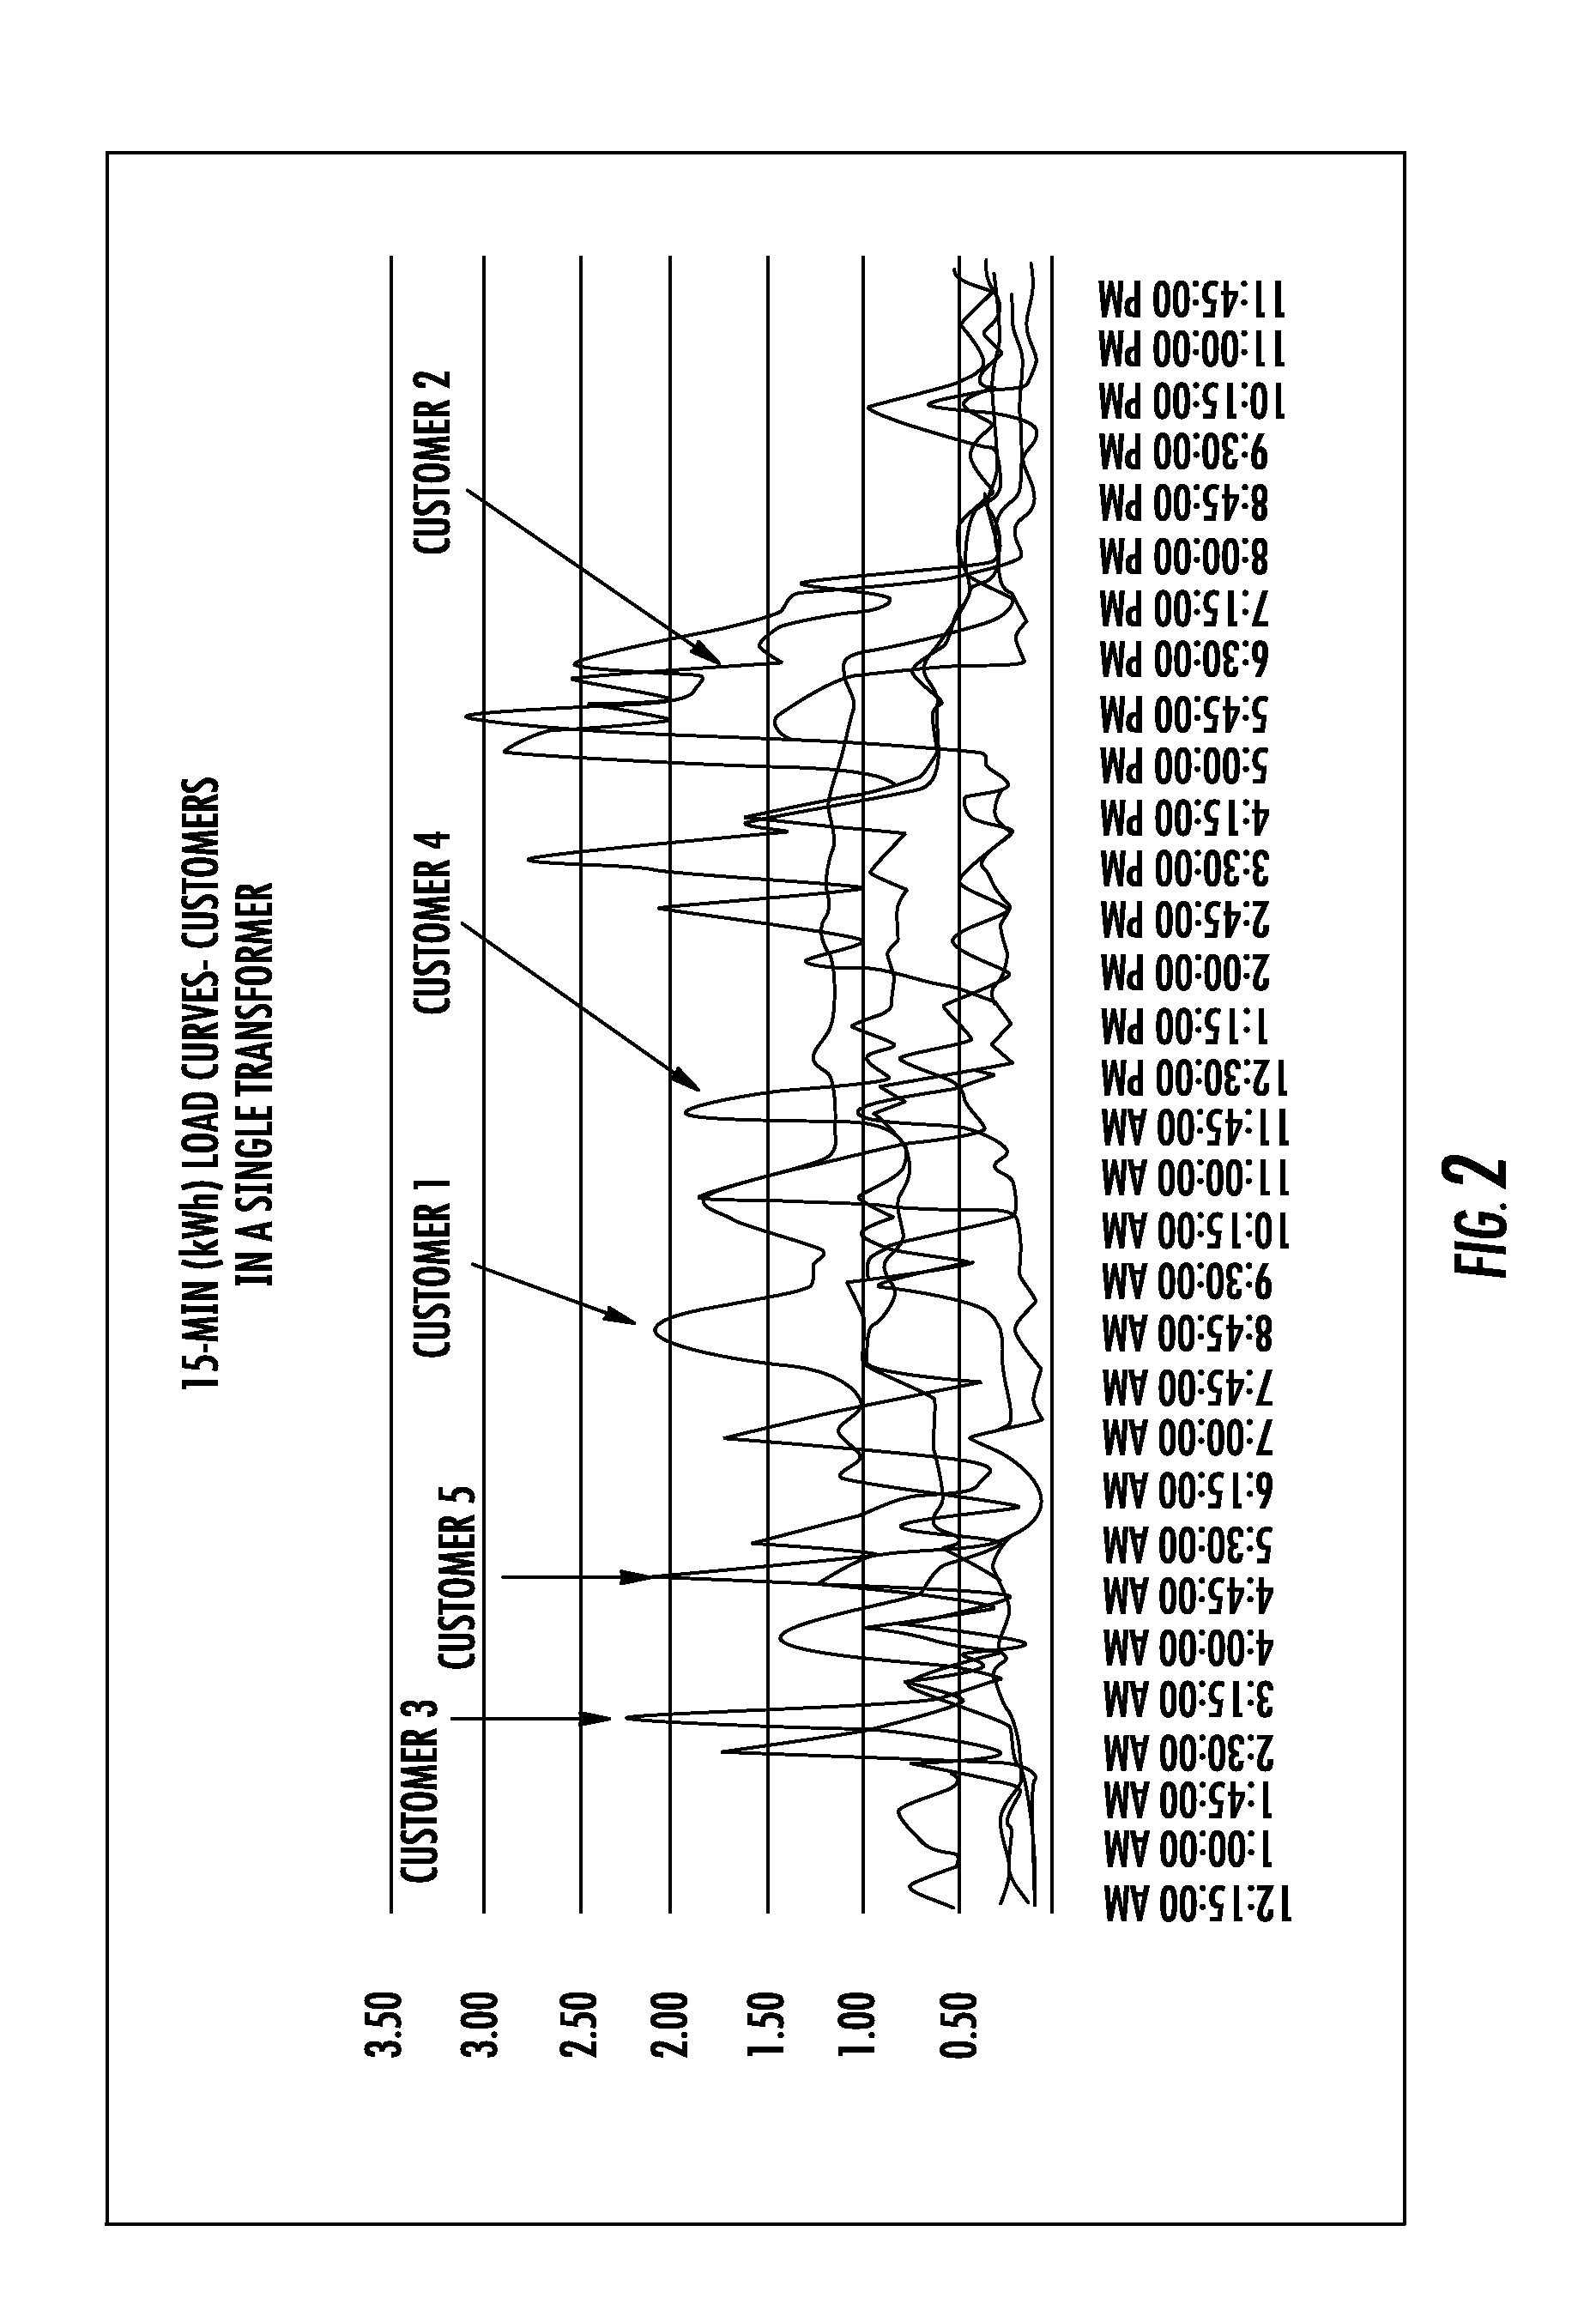
[0009]Embodiments of the present invention uses software analytics along with wired or wireless interval metering, without requiring a hard wire connection, in order to more accurately perform transformer-to-meter mapping. For example, using software analytics, the usage can be monitored at each house, and the load can also be monitored on each phase at the transformer. Then, using geographical data, such as the location of houses within a certain distance (e.g., one-half mile) from that transformer, and using a succession of combinations of load profiles from a variety of those houses, the combination of houses that best fits the load profile at the particular transformer can be determined. Further, the present invention facilitates quasi-real-time determination and localization of non-technical line losses.
[0010]More particularly, the application of embodiments of the present invention with assumptions and inputs from a multitude of devices on the utility distribution network will provide the utility provider with guidance to make more informed decisions for the use of assets and personnel. For example, there are other kinds of devices that utilities can deploy on the distribution lines in addition to transformer power monitors, such as line current monitors. Additionally, voltage information can be obtained using voltage monitors on the lines or on transformers and at houses, and voltage information can be used to determine which house is connected to which phase on which transformer. Embodiments of the present invention can be used for determining distribution phase load allocation and switched circuit status. Embodiments of the invention will provide utilities with better knowledge of the assets within a geographic region between the substation to the meters and better location for where resources need to be dispatched for work.
[0011]Embodiments of the present invention contemplate the use of interval data obtained through economical wireless solutions allowing frequent, reliable correlation and mapping between meters and transformers. It also allows quick and accurate determination of non-technical line losses associated with specific transformers by identifying unallocated consumption. This application of data can then further enhance the analysis for other utility distribution system equipment and configuration status.

Problems solved by technology

These records are often inaccurate, sometimes inaccurate more than 50% of the time.
In addition, in some cases utility commodities, e.g., electricity, are consumed by non-metered loads, referred to as “non-technical line loss;” often the result of theft.
In addition to theft, such inaccuracies in mapping can result from incorrect wiring in response to an outage and even incorrect wiring or reporting of such wiring at initial installation.
Utilities have traditionally performed the transformer-to-meter mapping with field surveys, which are expensive, time consuming, and are generally infrequent so they do not provide continuous data.
Such field surveys can actually be conducted by physically following wires from houses to the transformer drums, but the limitations to this method of mapping are fairly obvious.
Specifically, the issue is how to determine which house is connected to which transformer and to which phase on the particular transformer.
However, this solution is generally not economical as it requires the installation of individual monitors at the transformers and meters.

Method used


Image

  • Process, device and system for mapping transformers to meters and locating non-technical line losses
  • Process, device and system for mapping transformers to meters and locating non-technical line losses
  • Process, device and system for mapping transformers to meters and locating non-technical line losses

Examples


Embodiment Construction

[0031]Various aspects of the embodiments will now be described. The following description provides specific details for a thorough understanding and enabling description of these examples. Many of these specific details are optional. One skilled in the art will understand, however, that the invention and its various embodiments may be practiced without many of these specific details and options. Additionally, some well-known structures or functions may not be shown or described in detail, so as to avoid unnecessarily obscuring the relevant description.

[0032]The terminology used in the description presented below is intended to be interpreted in its broadest reasonable manner, even though it is being used in conjunction with a detailed description of certain specific examples. Certain terms may even be emphasized below; however, any terminology intended to be interpreted in any restricted manner will be overtly and specifically defined as such in this detailed description section. As...


PUM


Abstract

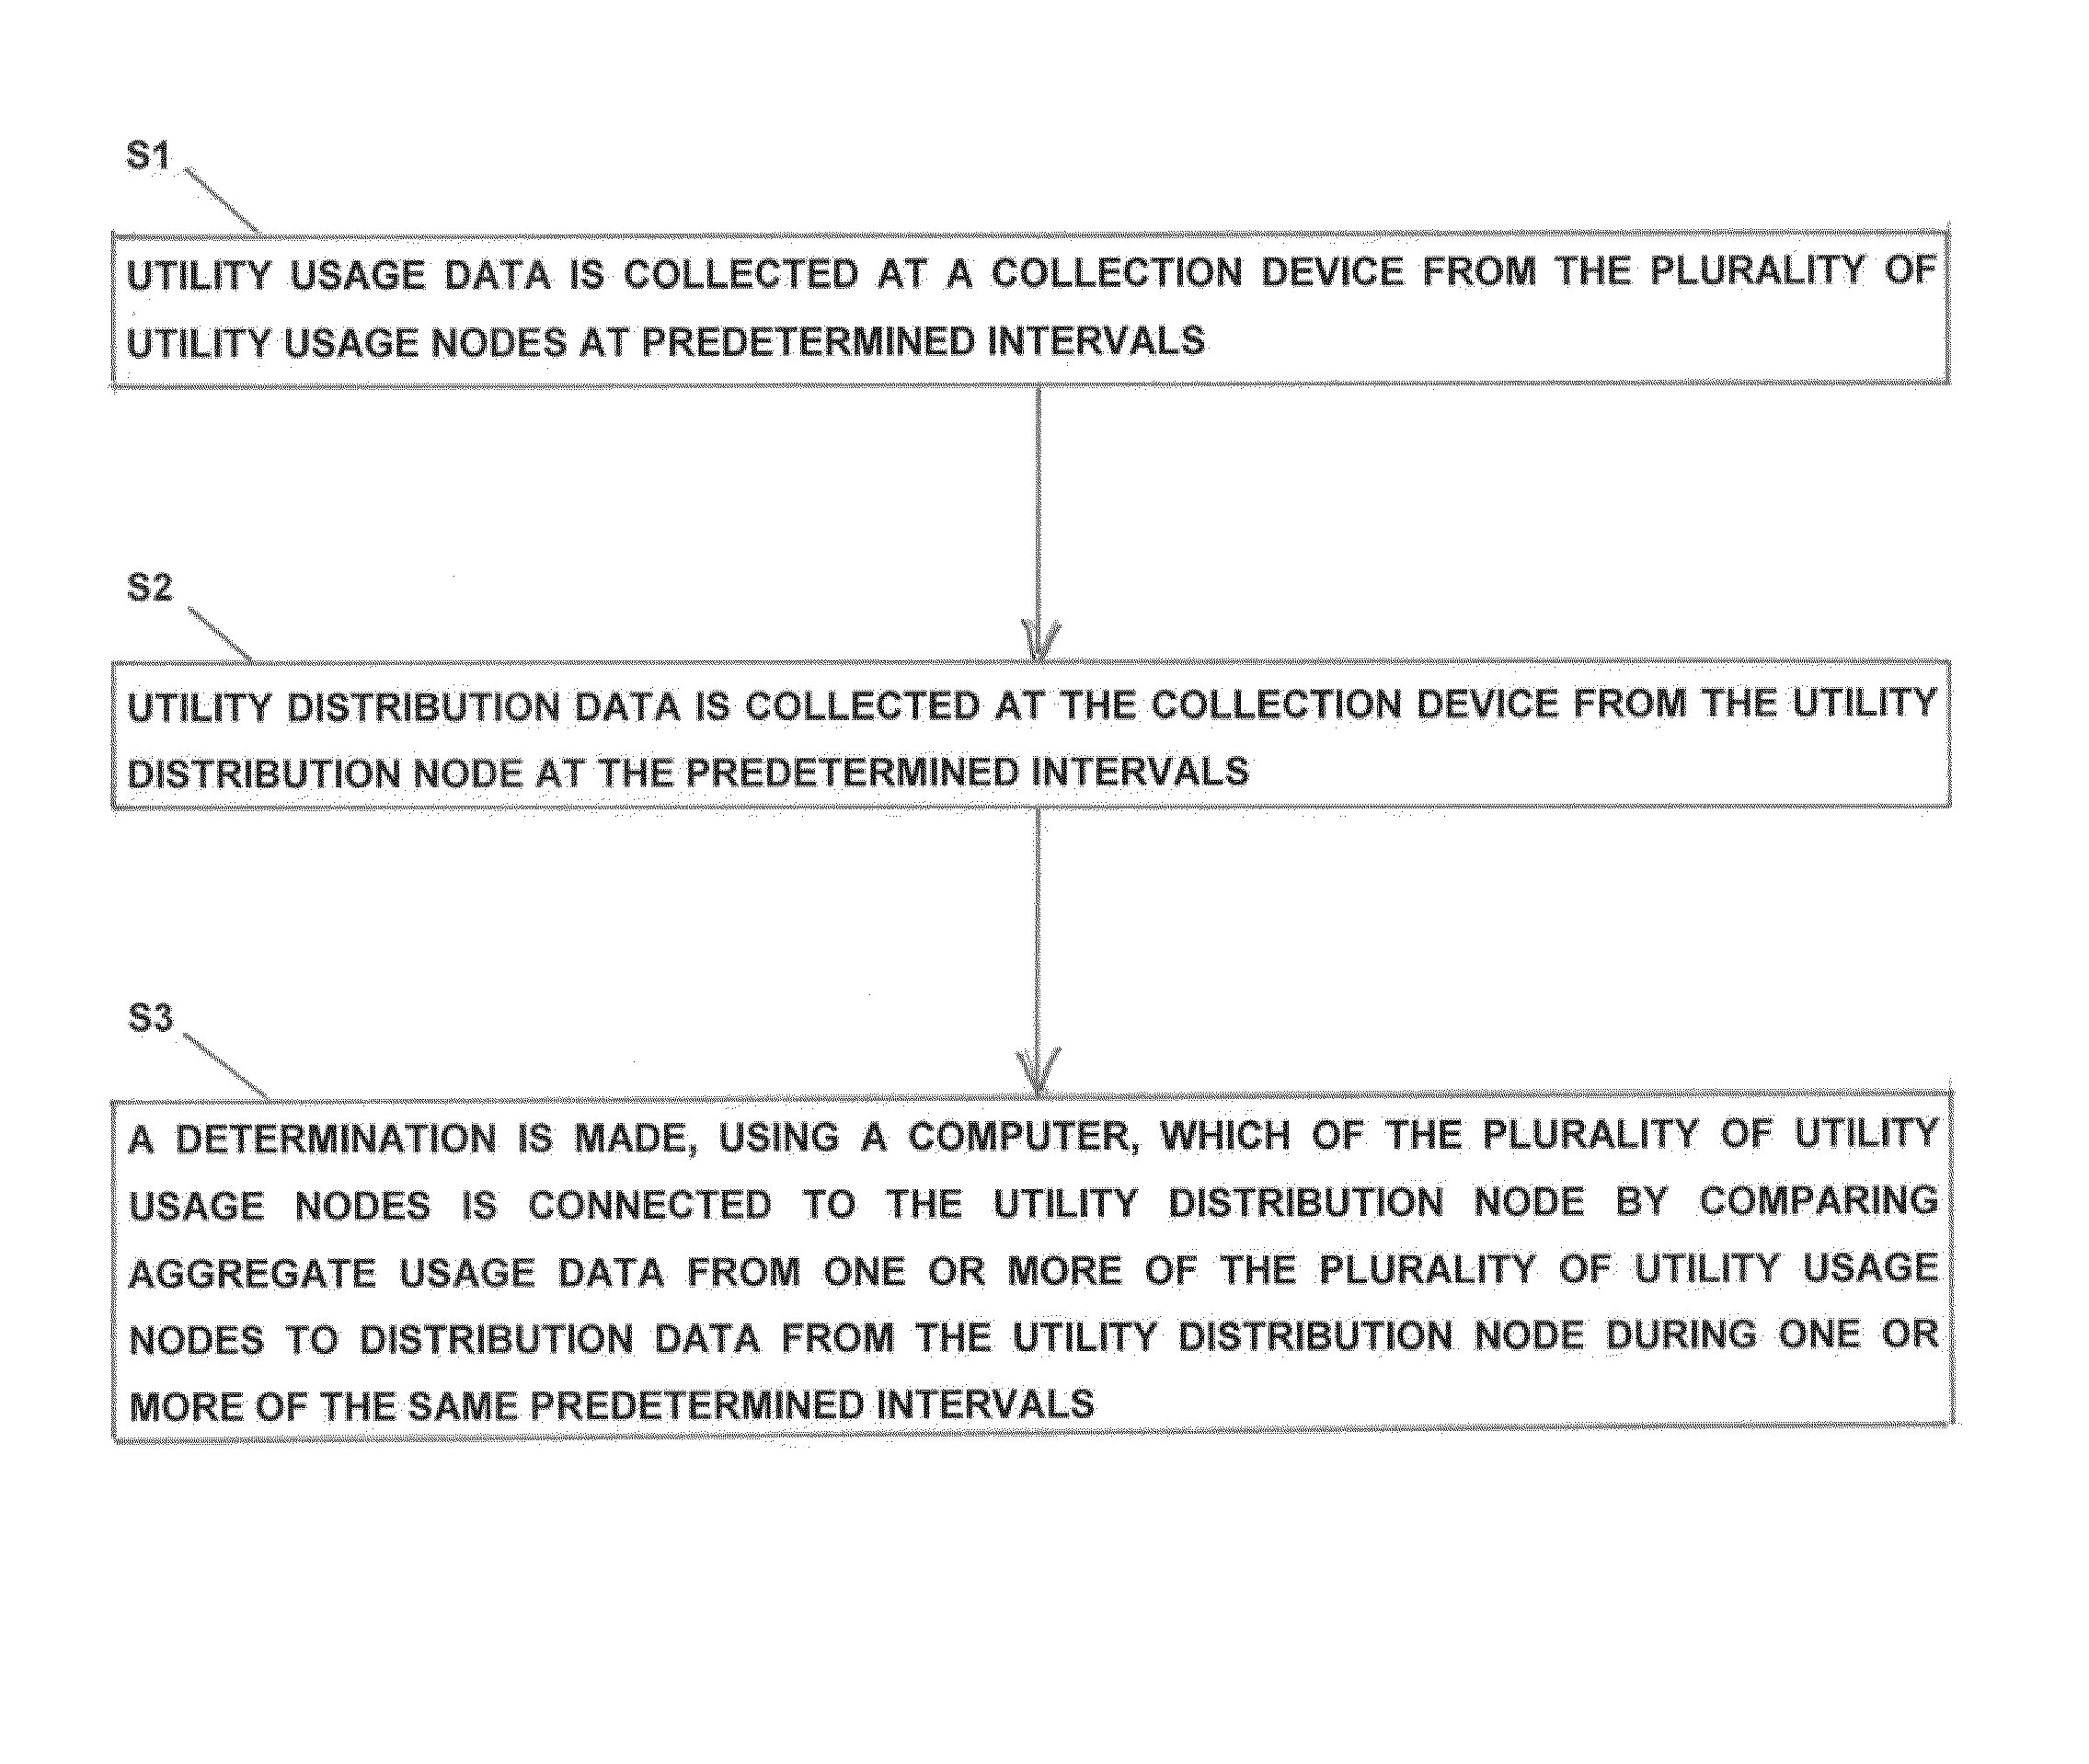
A process, device and system for mapping usage data from a plurality of utility usage nodes, such as electricity usage meters, to one or more utility distribution nodes, such as a transformer, in which utility usage data collected at a collection device from the plurality of utility usage nodes at predetermined intervals is received, and utility distribution data collected at the collection device from the utility distribution node at the predetermined intervals is likewise received. Aggregate usage data from one or more of the plurality of utility usage nodes is compared to distribution data from the utility distribution node during one or more of the same predetermined intervals to determine, using a computer, which of the plurality of utility usage nodes is connected to the utility distribution node.

Description

CROSS-REFERENCE TO RELATED APPLICATIONS[0001]This application claims priority to co-pending U.S. Provisional Application No. 61 / 159,202 filed Mar. 11, 2009 entitled “PROCESS FOR MAPPING TRANSFORMERS TO METERS AND LOCATING NON-TECHNICAL LINE LOSSES”, which is incorporated herein by this reference.[0002]This application hereby references and incorporates by reference in its entirety U.S. patent application Ser. No. 12 / 275,242 entitled “COLLECTOR DEVICE AND SYSTEM UTILIZING STANDARDIZED UTILITY METERING PROTOCOL”.FIELD OF THE INVENTION[0003]The present invention relates to utility usage node-to-utility distribution node mapping, and in particular to processes, devices and systems for mapping usage data from a plurality of utility usage nodes, such as electricity usage meters, to at least one utility distribution node, such as a transformer.BACKGROUND OF THE INVENTION[0004]Utility companies typically keep records of the electrical connections between individual service delivery points (...

Claims


Application Information

Patent Timeline
Patent Type & Authority Patents(United States)
IPC IPC(8): G08B23/00G08C15/06
CPCG06Q10/10G06Q50/06G01D4/00Y04S20/48Y04S20/36G01D2204/22G01D2204/47Y04S20/30
Inventor CONANT, ROBPRINCE, CHRIS
Owner TRILLIANT NETWORKS
Why Eureka
Try Eureka