
Method and apparatus for visualizing and interactively manipulating profile data

a technology of interactive manipulation and profile data, applied in the direction of instruments, static indicating devices, windings, etc., can solve the problem that the textual presentation can be limited in its ability to provide comprehensive views of the analysis, and achieve the effect of quick determination of potential areas of interes

Active Publication Date: 2013-08-06
NINTENDO CO LTD
View PDF15 Cites 7 Cited by
  • Summary
  • Abstract
  • Description
  • Claims
  • Application Information

AI Technical Summary

Benefits of technology

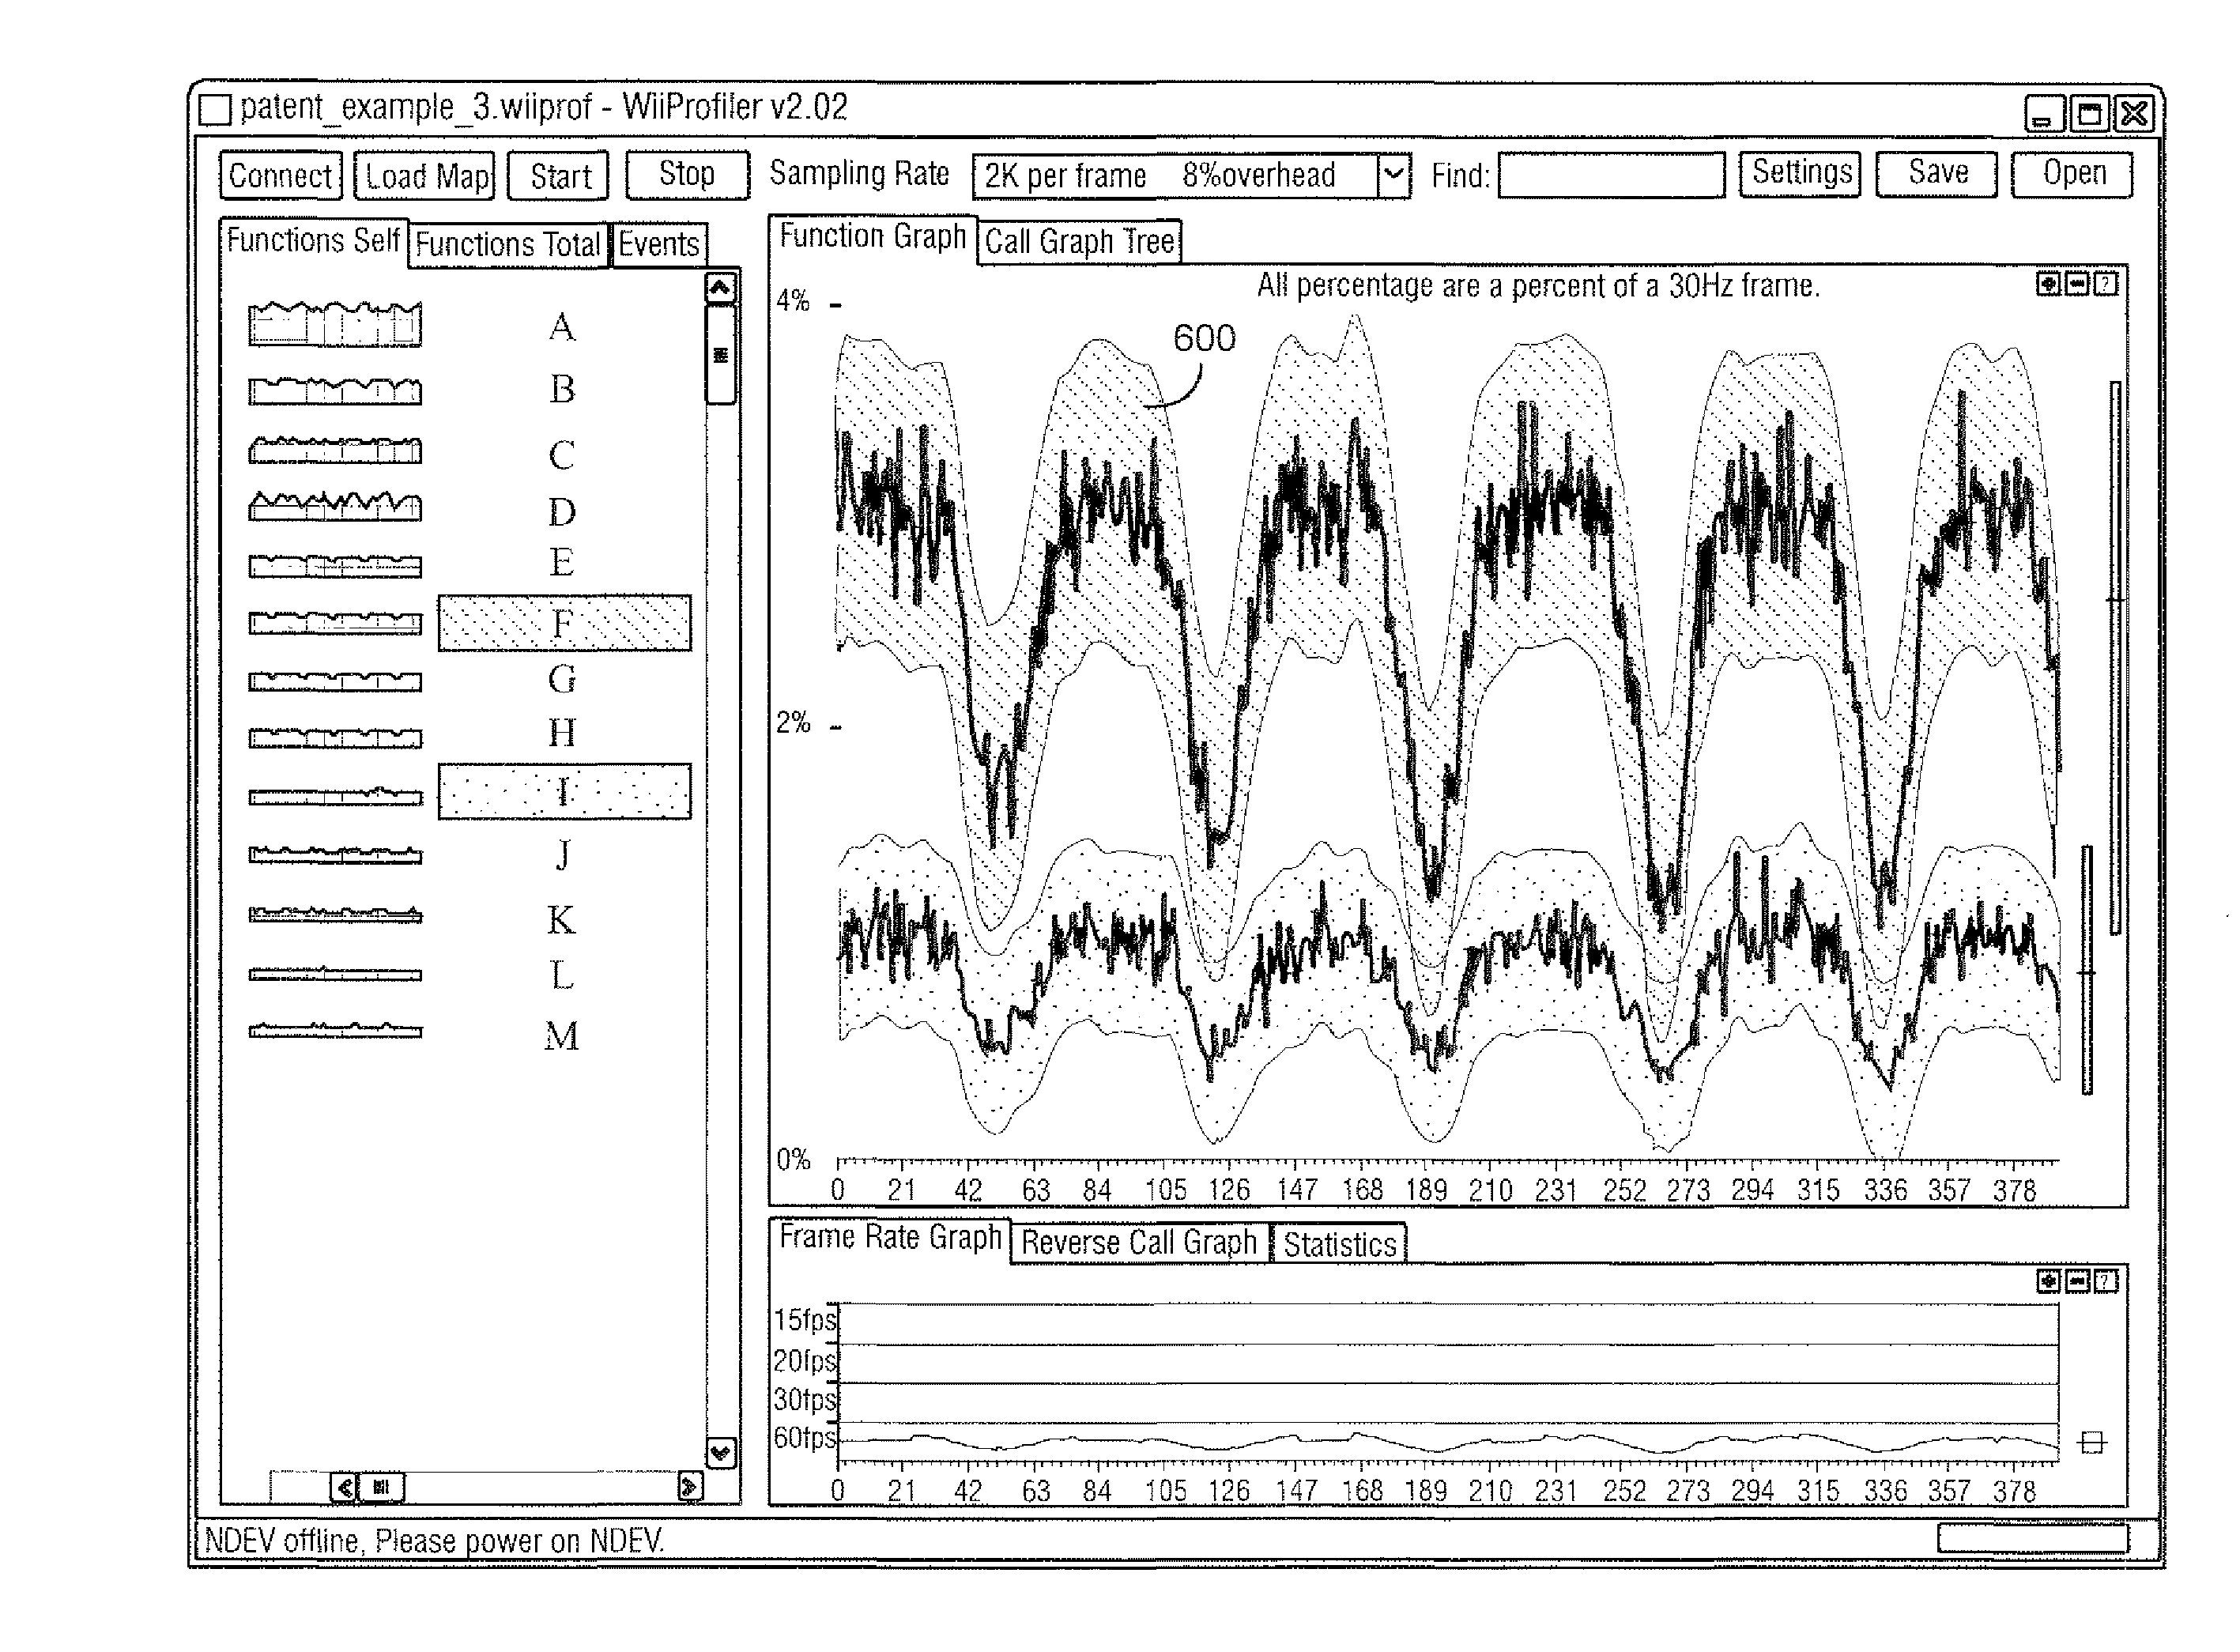
[0006]Therefore, it desirable to visually and interactively manipulate profile data, including data based on measurements from computing devices such as video games, so that the analyzed information pieces may be displayed graphically in a way that correlates the data so that a comprehensive view is presented. To put it another way, it is desirable to transform the profile data so that the profile data can be visualized. The user, e.g., software developer, can receive accurate feedback allowing him or her to quickly determine potential areas of interest, e.g., functions, for further detailed analysis and for optimization opportunities.
[0010]A list of all functions for which data is gathered is displayed in the Functions List window, each with a mini-graph of its performance over the duration of the profile data gathering. Each mini-graph effectively communicates many data points in a very small footprint, and emphasizes variation at low values and while still visualizing larger values. The mini-graphs offer a preview of the functions allowing the user to quickly determine which function or functions may be of interest.
[0013]Each highlight band follows a moving average or some other moving statistical representation of the function's data line. Smoothing is applied to the highlight band to minimize noise. Where the data line abruptly changes, the highlight band follows the data line very closely or even exactly so that the highlight band is on the data line. The smoothed highlight band improves the overall readability of the graph.

Problems solved by technology

However, such textual presentation can be limited in its ability to easily provide comprehensive views of the analysis.

Method used


Image

  • Method and apparatus for visualizing and interactively manipulating profile data
  • Method and apparatus for visualizing and interactively manipulating profile data
  • Method and apparatus for visualizing and interactively manipulating profile data

Examples


Embodiment Construction

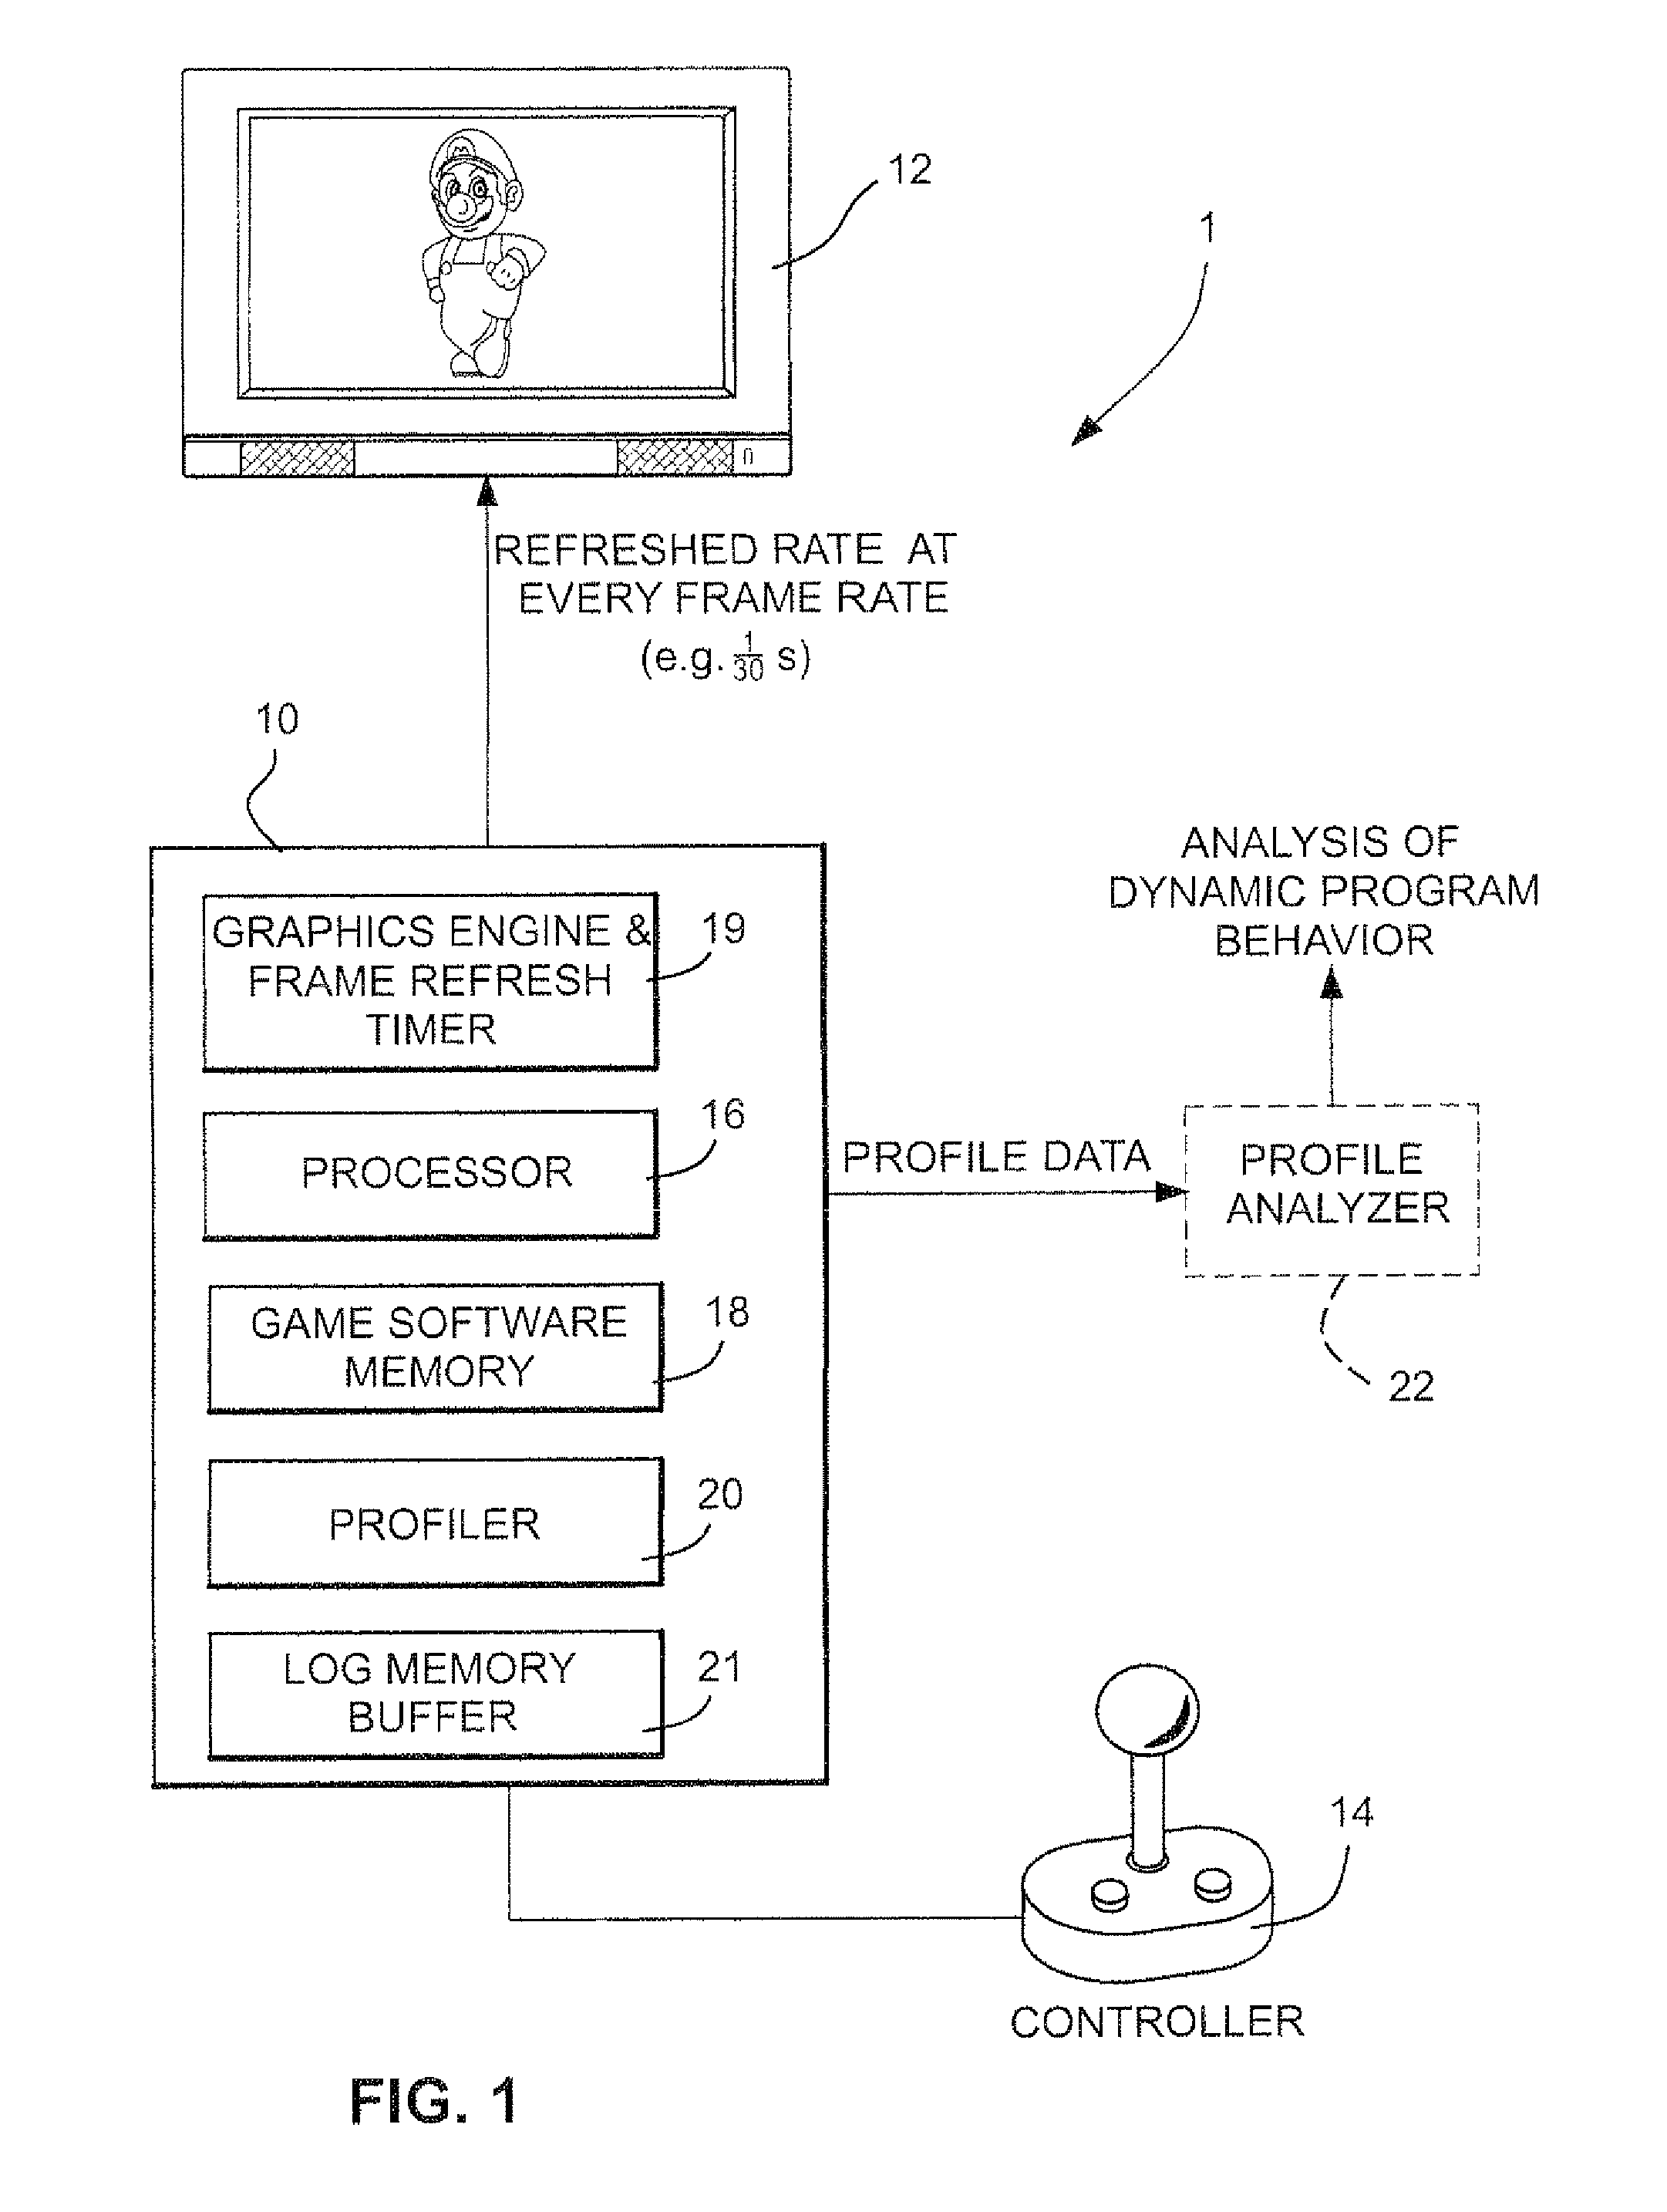
[0032]FIG. 1 shows in a block diagram form an illustrative non-limiting software development system 1 for a video game system, which can be, e.g., an embedded computing device. The software development system 1 includes a computing system 10 connected to a display 12 and a hand-held controller 14. The computing system 10 includes a processor 16, which executes a video game program stored in a game software memory 18 and includes a graphics engine 19 that generates graphics for display on the display 12. The graphics engine 19 includes a frame buffer memory that composes images periodically (e.g., every 1 / 30th or 1 / 60th of a second) and reads out the images for display on the display 12. Frame refresh rate may be controlled by a frame refresh timer 19 that interrupts the processor 16 periodically or non-periodically.

[0033]The computing system 10 further includes a profiler 20 used in gathering the program execution data when the processor 16 executes the game program. The profiler 20...


PUM


Abstract

Profile data collected through sampling is transformed and visually and interactively manipulated and displayed. In one scenario, the profile data is collected through statistical profiling of a program for a video game. The game program profile data is visually and interactively manipulated and displayed to visually present a dynamic behavior of the video game that shows correlation of impacts that the functions of the program have on the video game's performance. This allows the developer to identify inefficient sections of the program for optimization.

Description

CROSS-REFERENCES TO RELATED APPLICATIONS[0001]The application claims the benefit of U.S. provisional patent application 61 / 170,509 entitled “METHOD AND APPARATUS FOR VISUALIZING AND INTERACTIVELY MANIPULATING PROFILE DATA” filed Apr. 17, 2009, which in turns claims priority to U.S. provisional patent application 61 / 101,164 entitled “METHOD AND APPARATUS FOR EFFICIENT STATISTICAL PROFILING OF VIDEO GAME AND SIMULATION SOFTWARE” filed Sep. 30, 2008, both of which are incorporated herein by reference in their entirety.TECHNICAL FIELD[0002]The technology described herein relates to visualizing and interactively manipulating profile data, which may be generated based on performance measurements from computing devices including but not limited to video game programs.BACKGROUND AND SUMMARY[0003]In general, profiling is a way to analyze dynamic behavior of a computer program, e.g., for optimizing its performance or finding bugs or other problems. Profiling results can be used, e.g., to iden...

Claims


Application Information

Patent Timeline
Patent Type & Authority Patents(United States)
IPC IPC(8): G06T11/20G06T11/40G09G5/20
CPCG06T11/206G06T11/40G06T11/203G09G5/20H02K3/48H02K15/063G06F3/04817G06F11/3419G06F11/3466G06F11/3664G06F2201/81G06F2201/865
Inventor RABIN, STEVE
Owner NINTENDO CO LTD
Learn More