
Process and method for data assurance management by applying data assurance metrics

a technology of data assurance management and data assurance metrics, applied in the field of data assurance management by applying data assurance metrics, can solve the problems of large amounts of data in their business processes that do not know the absolute and relative value of their data assets or the economic life of such assets, and achieve the effects of less reliable, general applicability, and reliable comparison

Inactive Publication Date: 2014-09-23
BLACK OAK PARTNERS
View PDF13 Cites 262 Cited by
  • Summary
  • Abstract
  • Description
  • Claims
  • Application Information

AI Technical Summary

Benefits of technology

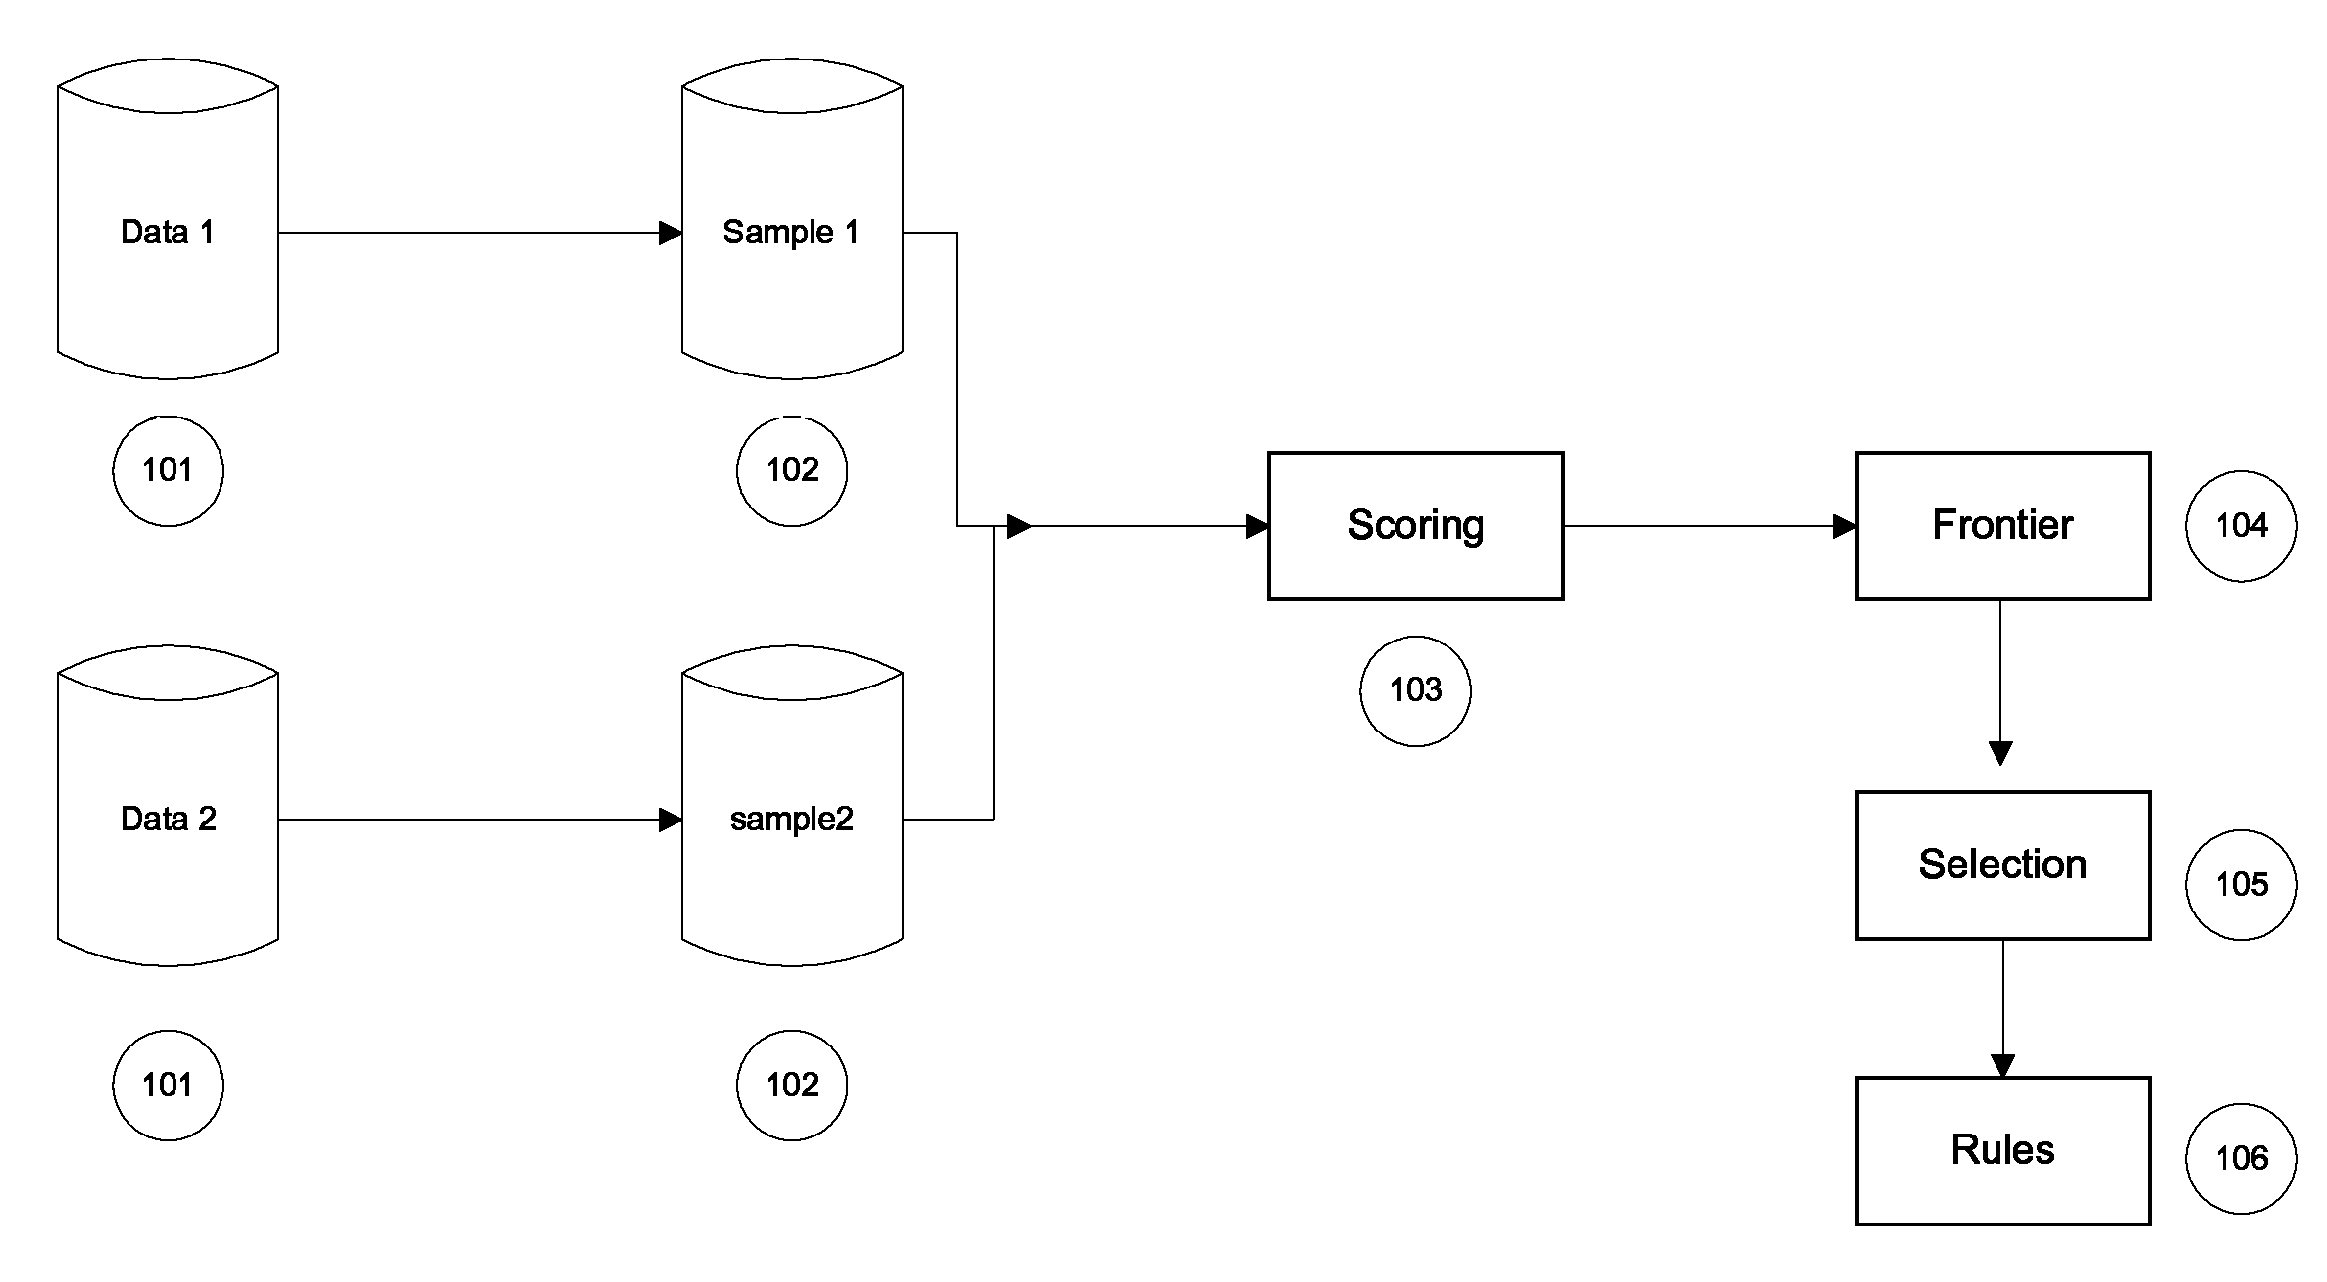
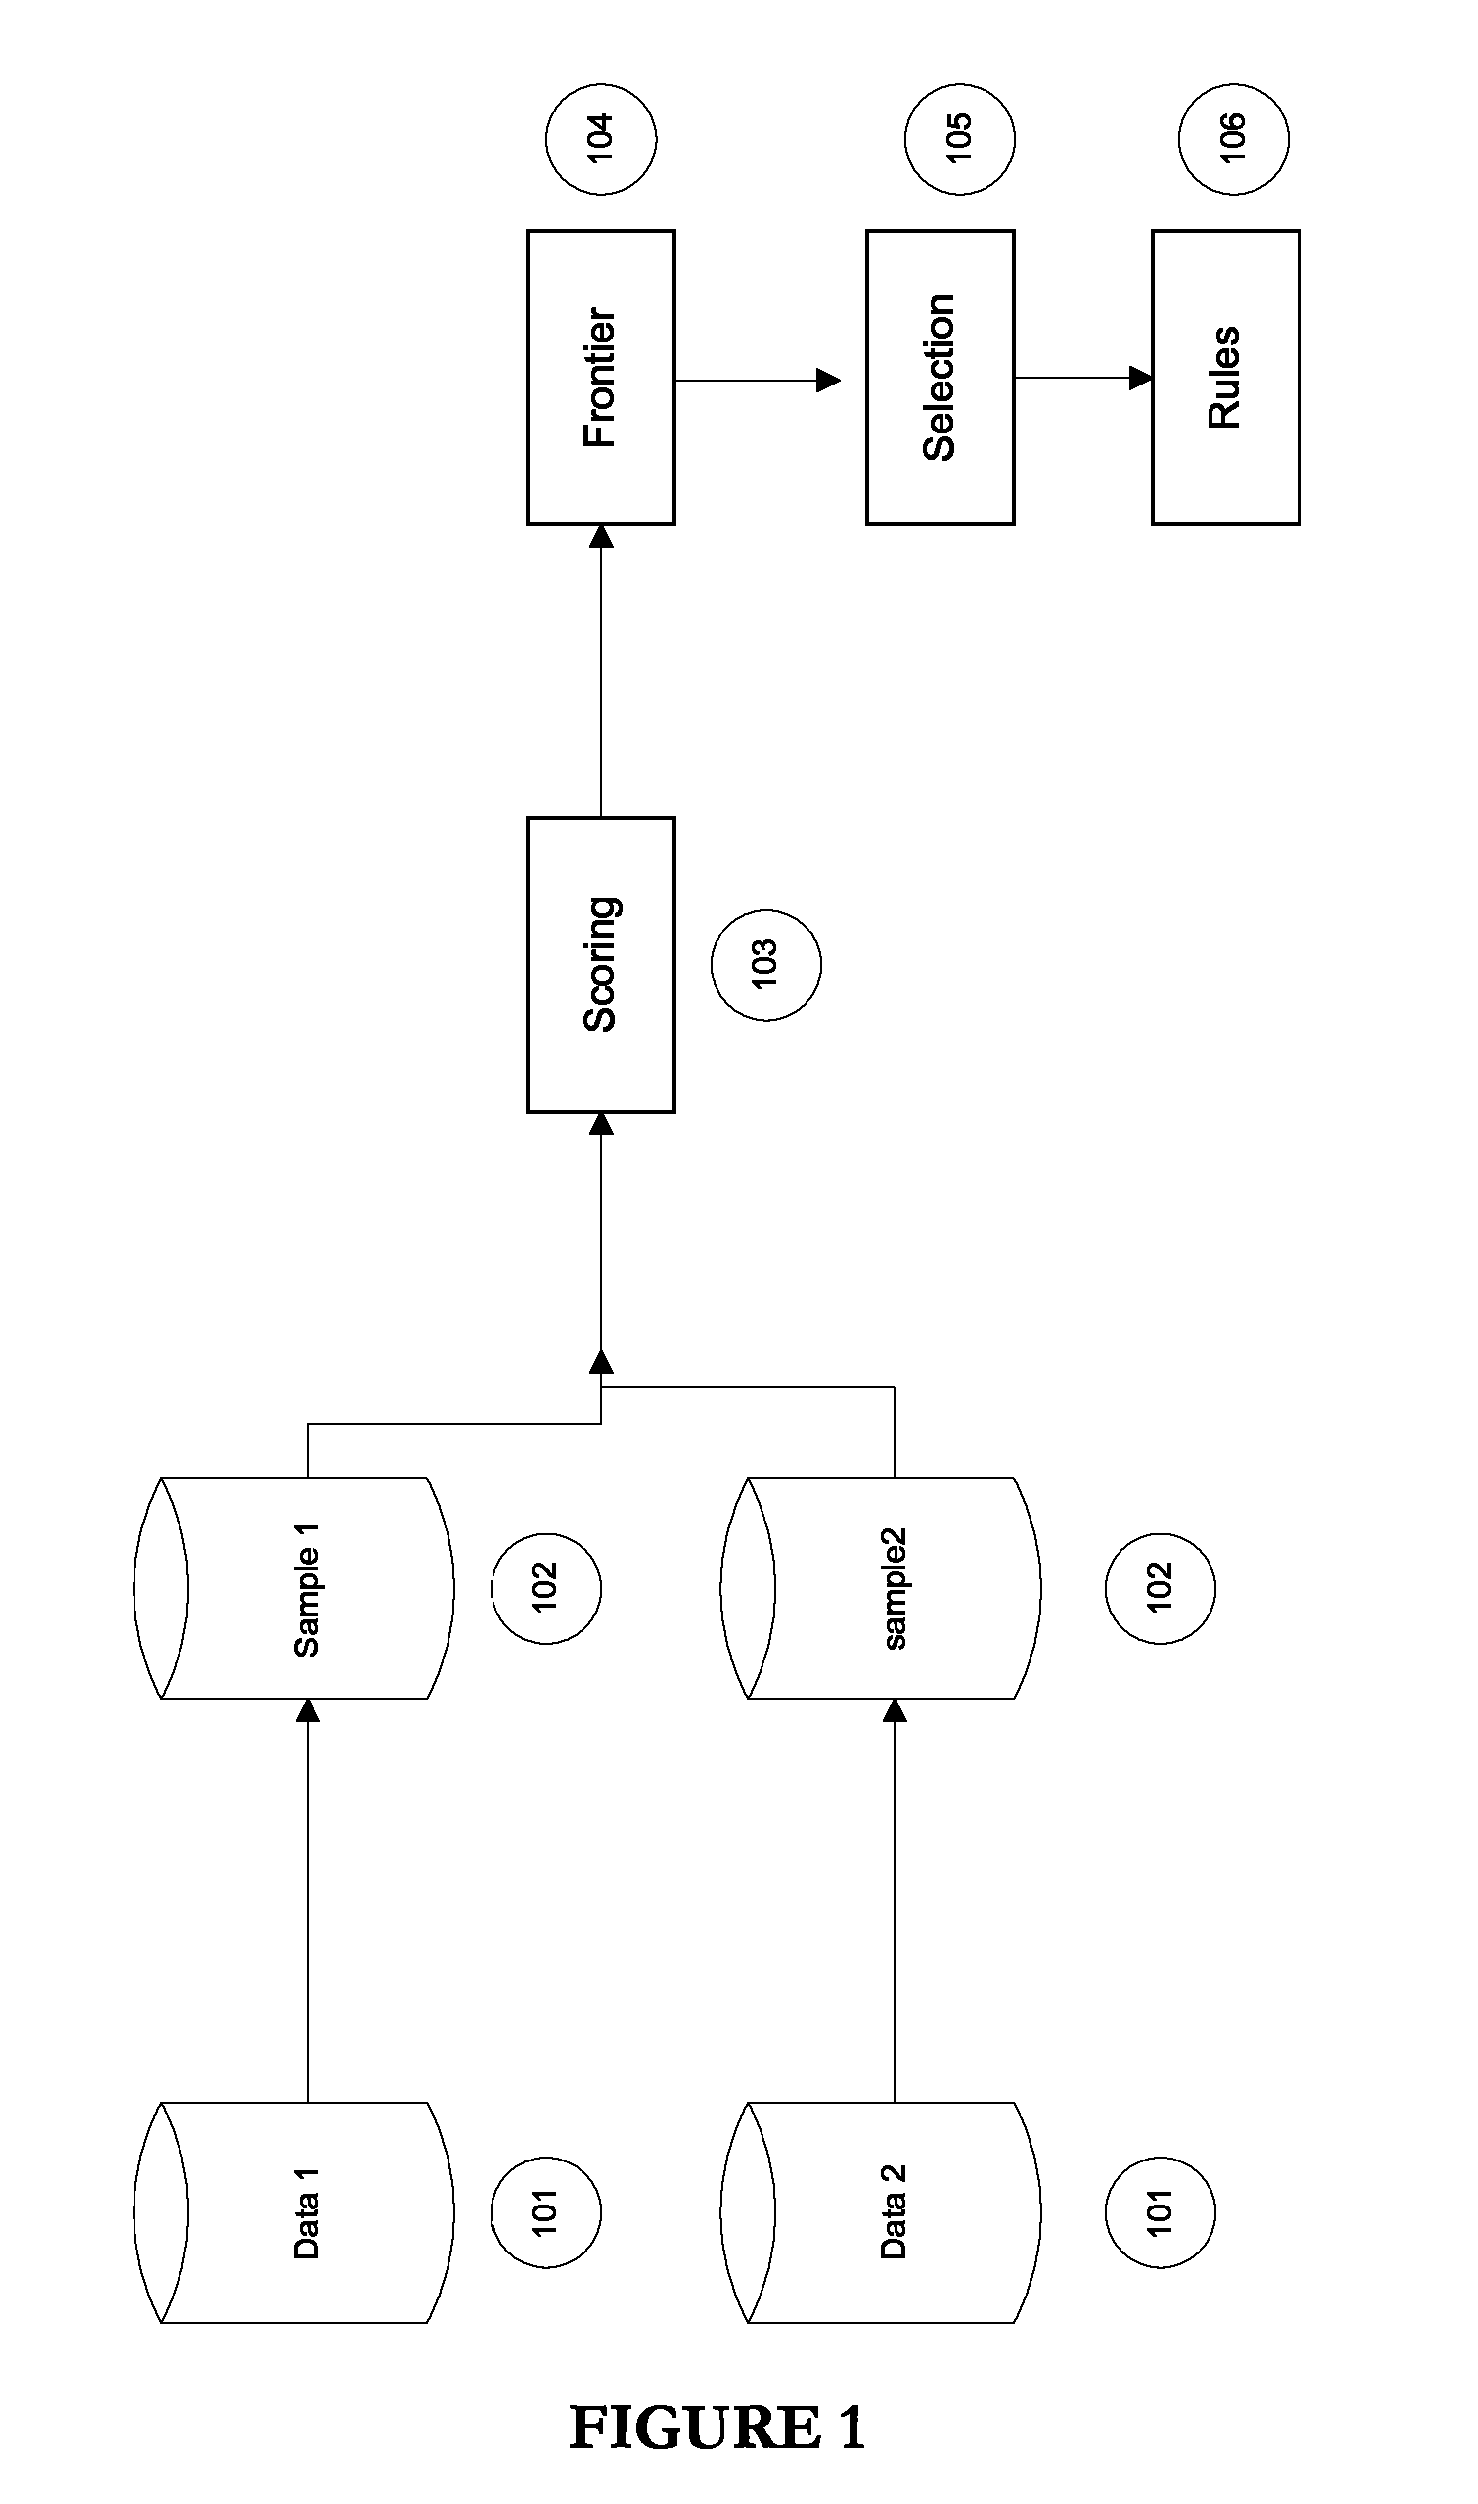
This invention is about a system and method for managing data to improve its quality and usefulness for various applications like income validation, asset validation, and more. The system uses data assurance management to score data quality metrics based on factors like accuracy, redundancy, velocity, and consistency, and then selects the optimal data aggregation for use in the output database. The system can also include rules in a data hygiene engine to determine if the data is valid and save it in the production database. The technical effects of this invention are better data quality, improved data management, and better data analysis for various applications.

Problems solved by technology

The data elements they extract and use may be wrong or incomplete, or worse yet, the information may be correct but not timely or not have enough coverage from which to glean valuable decisions.
Companies which use large amounts of data in their business processes do not presently know the absolute and relative value of their data assets or the economic life of such assets, as measured and scored by the implementation of data metrics.
These same companies do not presently know how to best use their data assets.
While these functions are appropriate, they do not include any form of data assurance management.
These same companies, however, rarely have a data optimizing or data governance strategy.
Further, there are no systems for predicting and systematically verifying data assurance in the marketplace.

Method used


Image

  • Process and method for data assurance management by applying data assurance metrics
  • Process and method for data assurance management by applying data assurance metrics
  • Process and method for data assurance management by applying data assurance metrics

Examples


example 1

[0151]Example 1 describes the process of combining three data sources along with their cost and number of unique records, to examine the cost and number of unique records for each combination.

[0152]

TABLE 1Example data sets showing the cost of each data set and the number of unique records provided in the data set.Data SourceCostUnique RecordsA$1015,000B$1525,000C$2010,000

[0153]There are seven possible combinations: (A), (B), (C), (AB), (AC), (BC), and (ABC). For each combination the total cost and the number of unique records needs to be calculated. The total cost for a particular combination is simply the sum of the costs of each data set making up the combination, where this value is in Table 1.

[0154]However, the total number of unique records cannot be determined from Table 1 because there may be overlap between the data sources that comprise the combination. For example, the combination (AB) has at least 25,000 unique rows because B alone has this many unique rows. Further, ther...

example 2

[0195]An analysis of five different sources injecting the dimension of Completeness is below. Each source file was selected on the same set of geographic criteria. For purposes of this analysis, the five elements were chosen by the customer: Name, Address, Phone, Income Level and Presence of Credit. Baseline sources are selected based solely on the completeness dimension; no other factors were considered for purposes of this report. The analysis matrix is generated by comparing each of the four remaining sources with the baseline source, element by element.

[0196]

TotalNumberNumberPercentagePrice perNumber ofof Duplicateof Uniqueof Unique ThousandRecordsRecordsRecordsRecordsRecordsS1  4 million234,9873,765,01394.13%$8S21.4 million89,7891,310,21193.59%$5S34.7 million126,4304,573,57097.00%$4S44.9 million908,9503,991,05081.45%$9S53.2 million276,7412,923,25991.35%$6

[0197]In this instance, a consistent ID was not provided. A deduplication process based solely on Name (using character strin...

example 3

[0209]Scientific or environmental data, especially which collected on a massive scale by persons who are not professional scientists, may also be the subject of data assurance management. In this example, data assurance management was applied to the collection, processing, storage and later use of large quantities of scientific and environmental data.

[0210]The data collector was a company for science and environmental data collectors (“SEDC”) engaged to collect and report data for air, soil, tar ball and water sampling activities being conducted as a result of a massive off shore oil spill and where there are approximately 2,500 data collection points spanning a geographic area along the Gulf Coast from New Iberia, La. to Tallahassee, Fla. Over 20 teams consisting of approximately 800 people collected and reported data samples every fifteen (15 minutes).

[0211]SEDC also managed several other data streams related to the project:

[0212]Off-Shore Vessel AreaRAE Data (71 AreaRAE Units)

[02...


PUM


Abstract

The present invention relates generally to methods, software and systems for measuring and valuing the quality of information and data, where such measurements and values are made and processed by implementing objectively defined, measurable, comparable and repeatable dimensions using software and complex computers. The embodiments include processes, systems and method for identifying optimal scores of the data dimension. The invention further includes processes, systems and method for data filtering to improve the overall data quality of a data source. Finally, the invention further includes processes, systems and method for data quality assurance of groups of rows of a database.

Description

CROSS-REFERENCE TO RELATED APPLICATIONS[0001]This application claims the benefit of U.S. Provisional Application No. 61 / 234,825, filed Aug. 18, 2009. Priority is claimed to all of the above-mentioned applications, and each application is hereby incorporated by reference.BACKGROUND[0002]1. Field of the Invention[0003]The present invention relates generally to methods, software and systems for measuring and valuing the quality of information and data, where such measurements and values are made and processed by implementing objectively defined, measurable, comparable and repeatable dimensions using software and complex computers.[0004]2. Description of Related Art[0005]Commercial companies and government agencies purchase, generate, collect and acquire large amounts of data and information, both externally and internally, to run their businesses or governmental functions. This data is used to manufacture an information product, designed to improve the outcome of a process such as the ...

Claims


Application Information

Patent Timeline
Patent Type & Authority Patents(United States)
IPC IPC(8): G06F17/30
CPCG06F17/30303G06Q30/02G06F16/215
Inventor MCGRAW, THOMAS RICKETTBURKS, LARRY WARDKOLO, BRIAN
Owner BLACK OAK PARTNERS
Learn More