Method and apparatus for enhanced static IR drop analysis

a static ir drop and analysis method technology, applied in the field of electronic devices, can solve the problems of escalating gate counts, escalating gate counts, shrinking wire widths, and complicated power delivery network signoffs,

Active Publication Date: 2014-11-04
QUALCOMM INC
View PDF10 Cites 3 Cited by
  • Summary
  • Abstract
  • Description
  • Claims
  • Application Information

AI Technical Summary

Problems solved by technology

Today's ultra-deep sub-micron very large scale integration (VLSI) circuit designs are extremely complex, and are characterized by escalating gate counts, shrinking wire widths, and bigger die size.
The combination of higher peak current demand and higher PG grid resistance degrades on-chip IR (i.e., current*resistance) drop and makes Power Delivery Network (PDN) signoff a complicated and challenging task.
However, there is limited availability of representative current demand profiles that can model the numerous applications for SoC devices.
Dynamic Voltage Drop Analysis is also time consuming, complicated, and a cumbersome effort that often entails elaborate and error-prone setup, large analysis runtimes, and complicated post-processing of results.
Thus, Dynamic Voltage Drop Analysis often does not provide timely feedback to a circuit designer about the robustness and quality of the PDN during the early physical design stages.
Though testing using Static IR Analysis based on average power is easy to setup and can generate quick feedback in a reasonable amount of time, the power distribution used is based on average power, which does not account for changes in on-chip power distribution as a function of time.
Thus, Static IR Analysis based on average power cannot determine if a power grid is robust enough to withstand peak current demand.
Relying solely on average power-based Static IR Analysis based on average power results to assess PDN bottlenecks early in the design process can provide unexpected detrimental results.

Method used


Image

  • Method and apparatus for enhanced static IR drop analysis
  • Method and apparatus for enhanced static IR drop analysis
  • Method and apparatus for enhanced static IR drop analysis

Examples


Embodiment Construction

Introduction

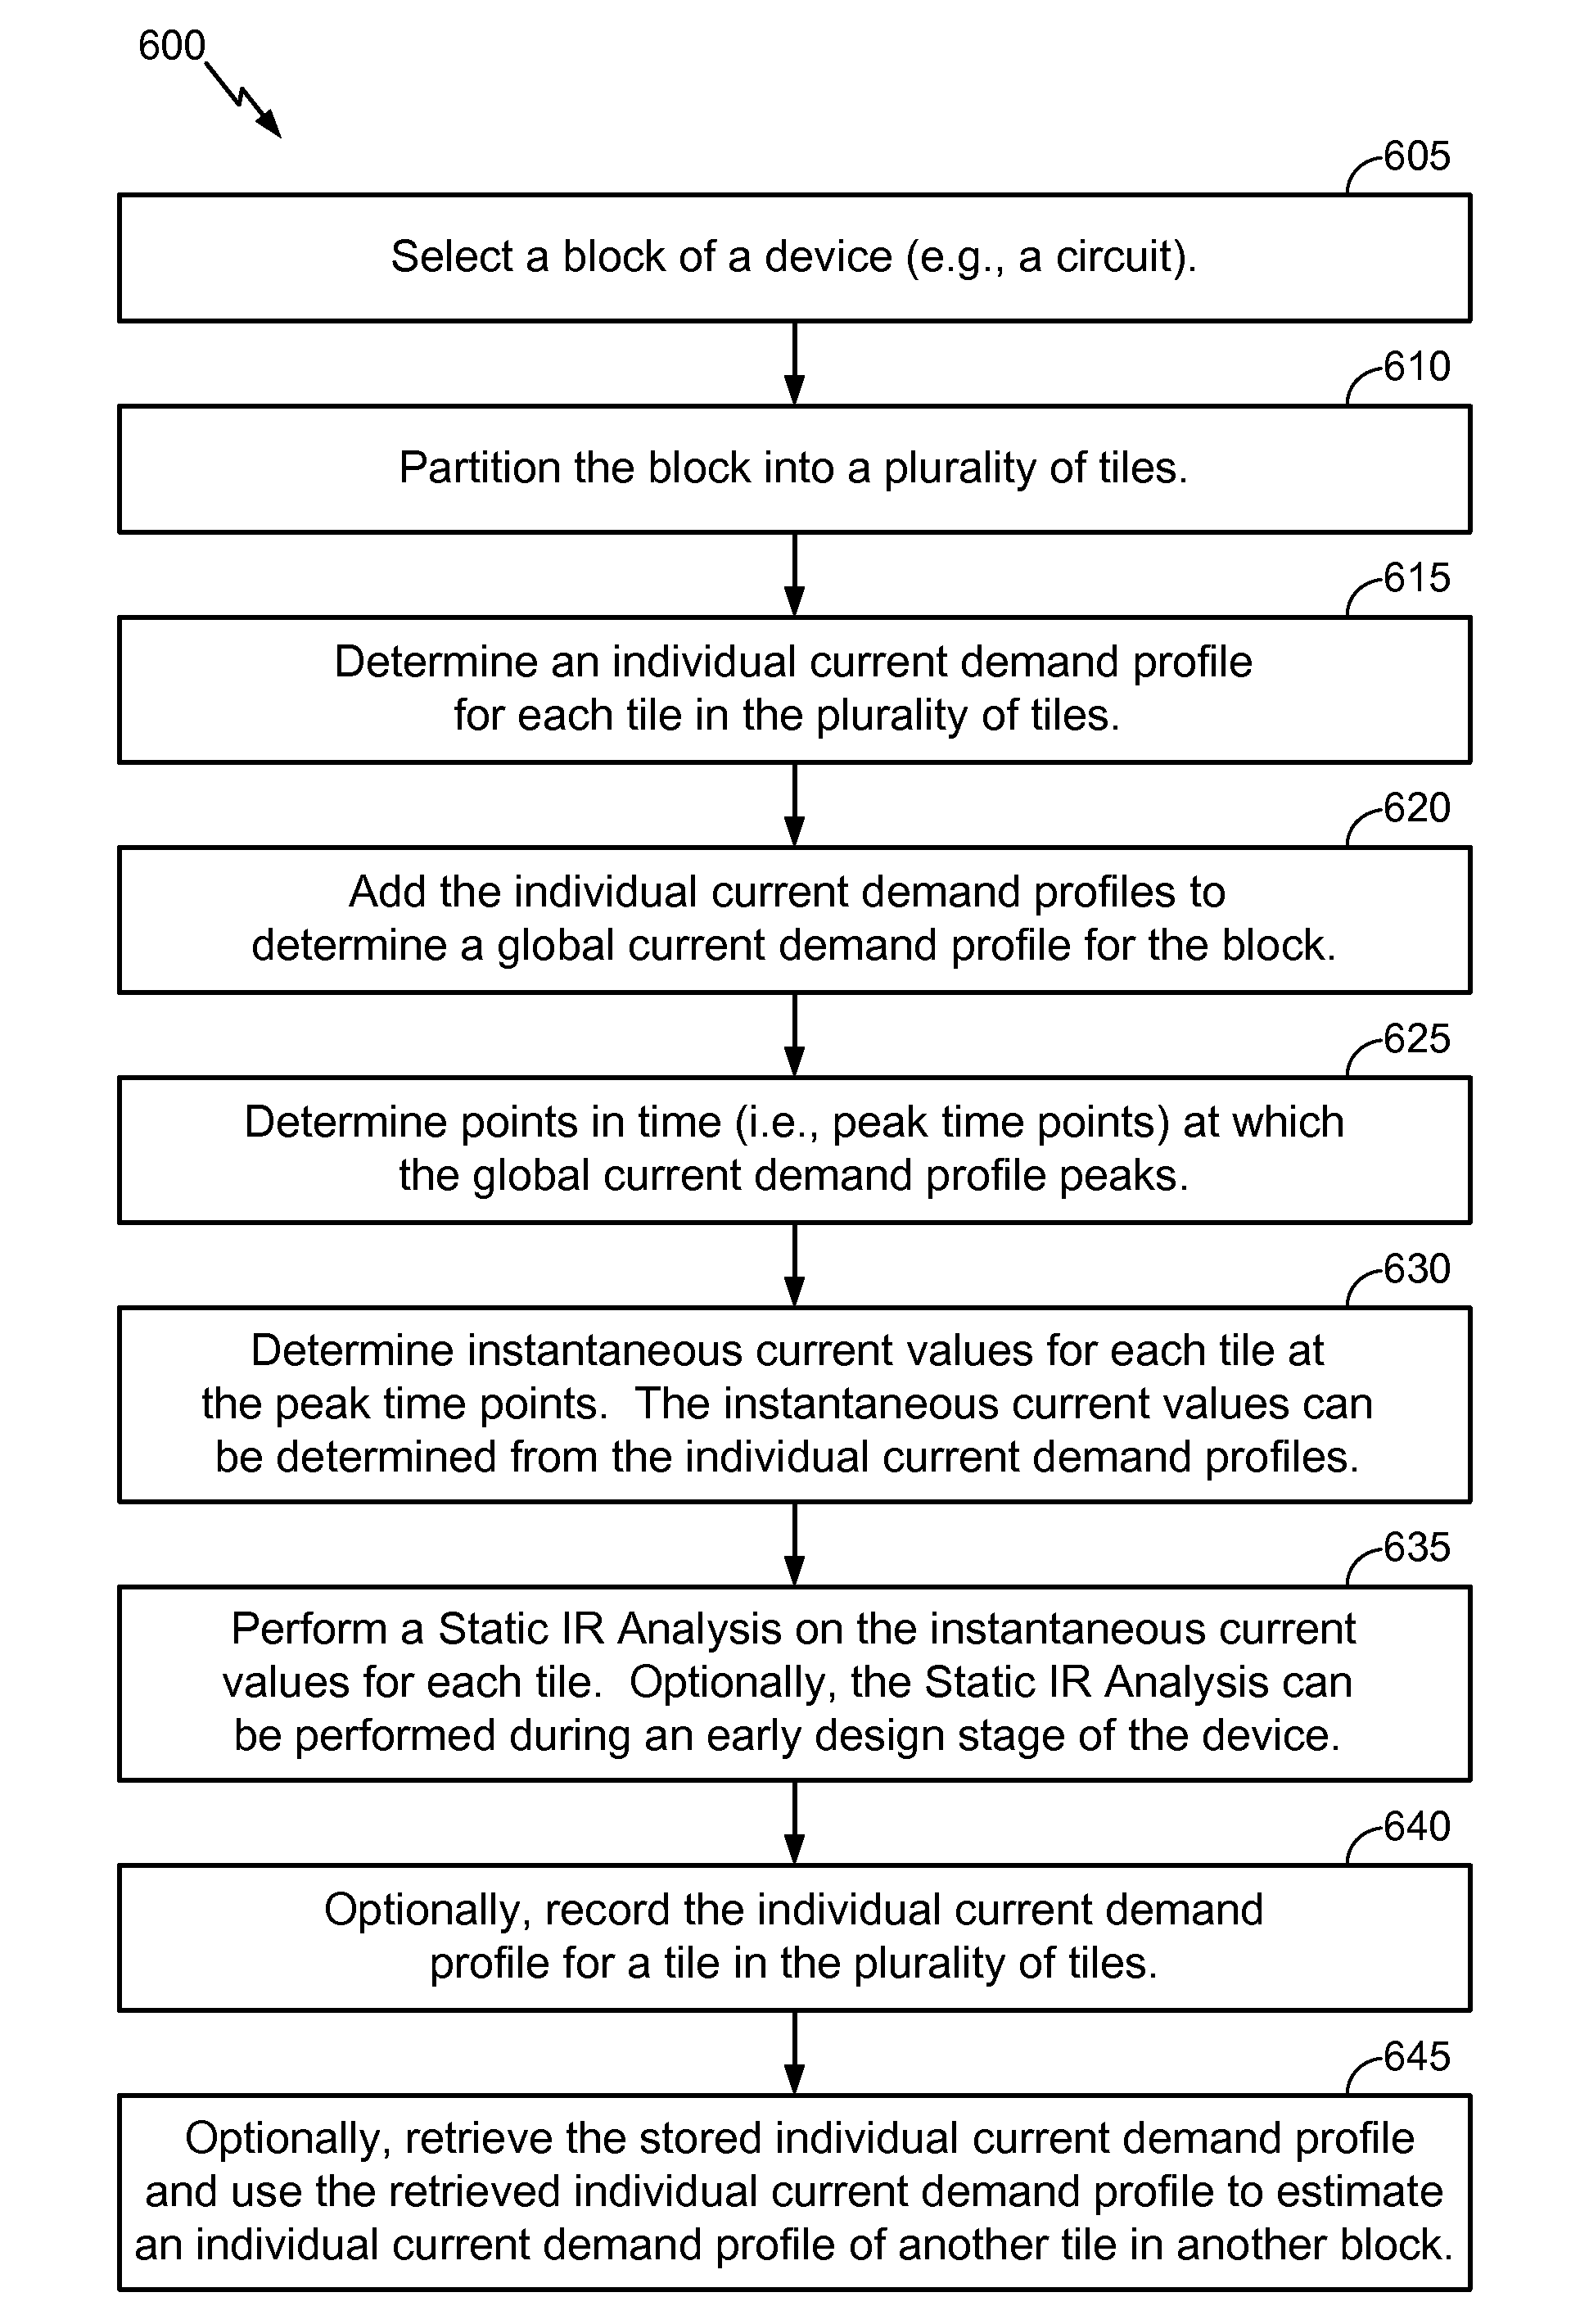
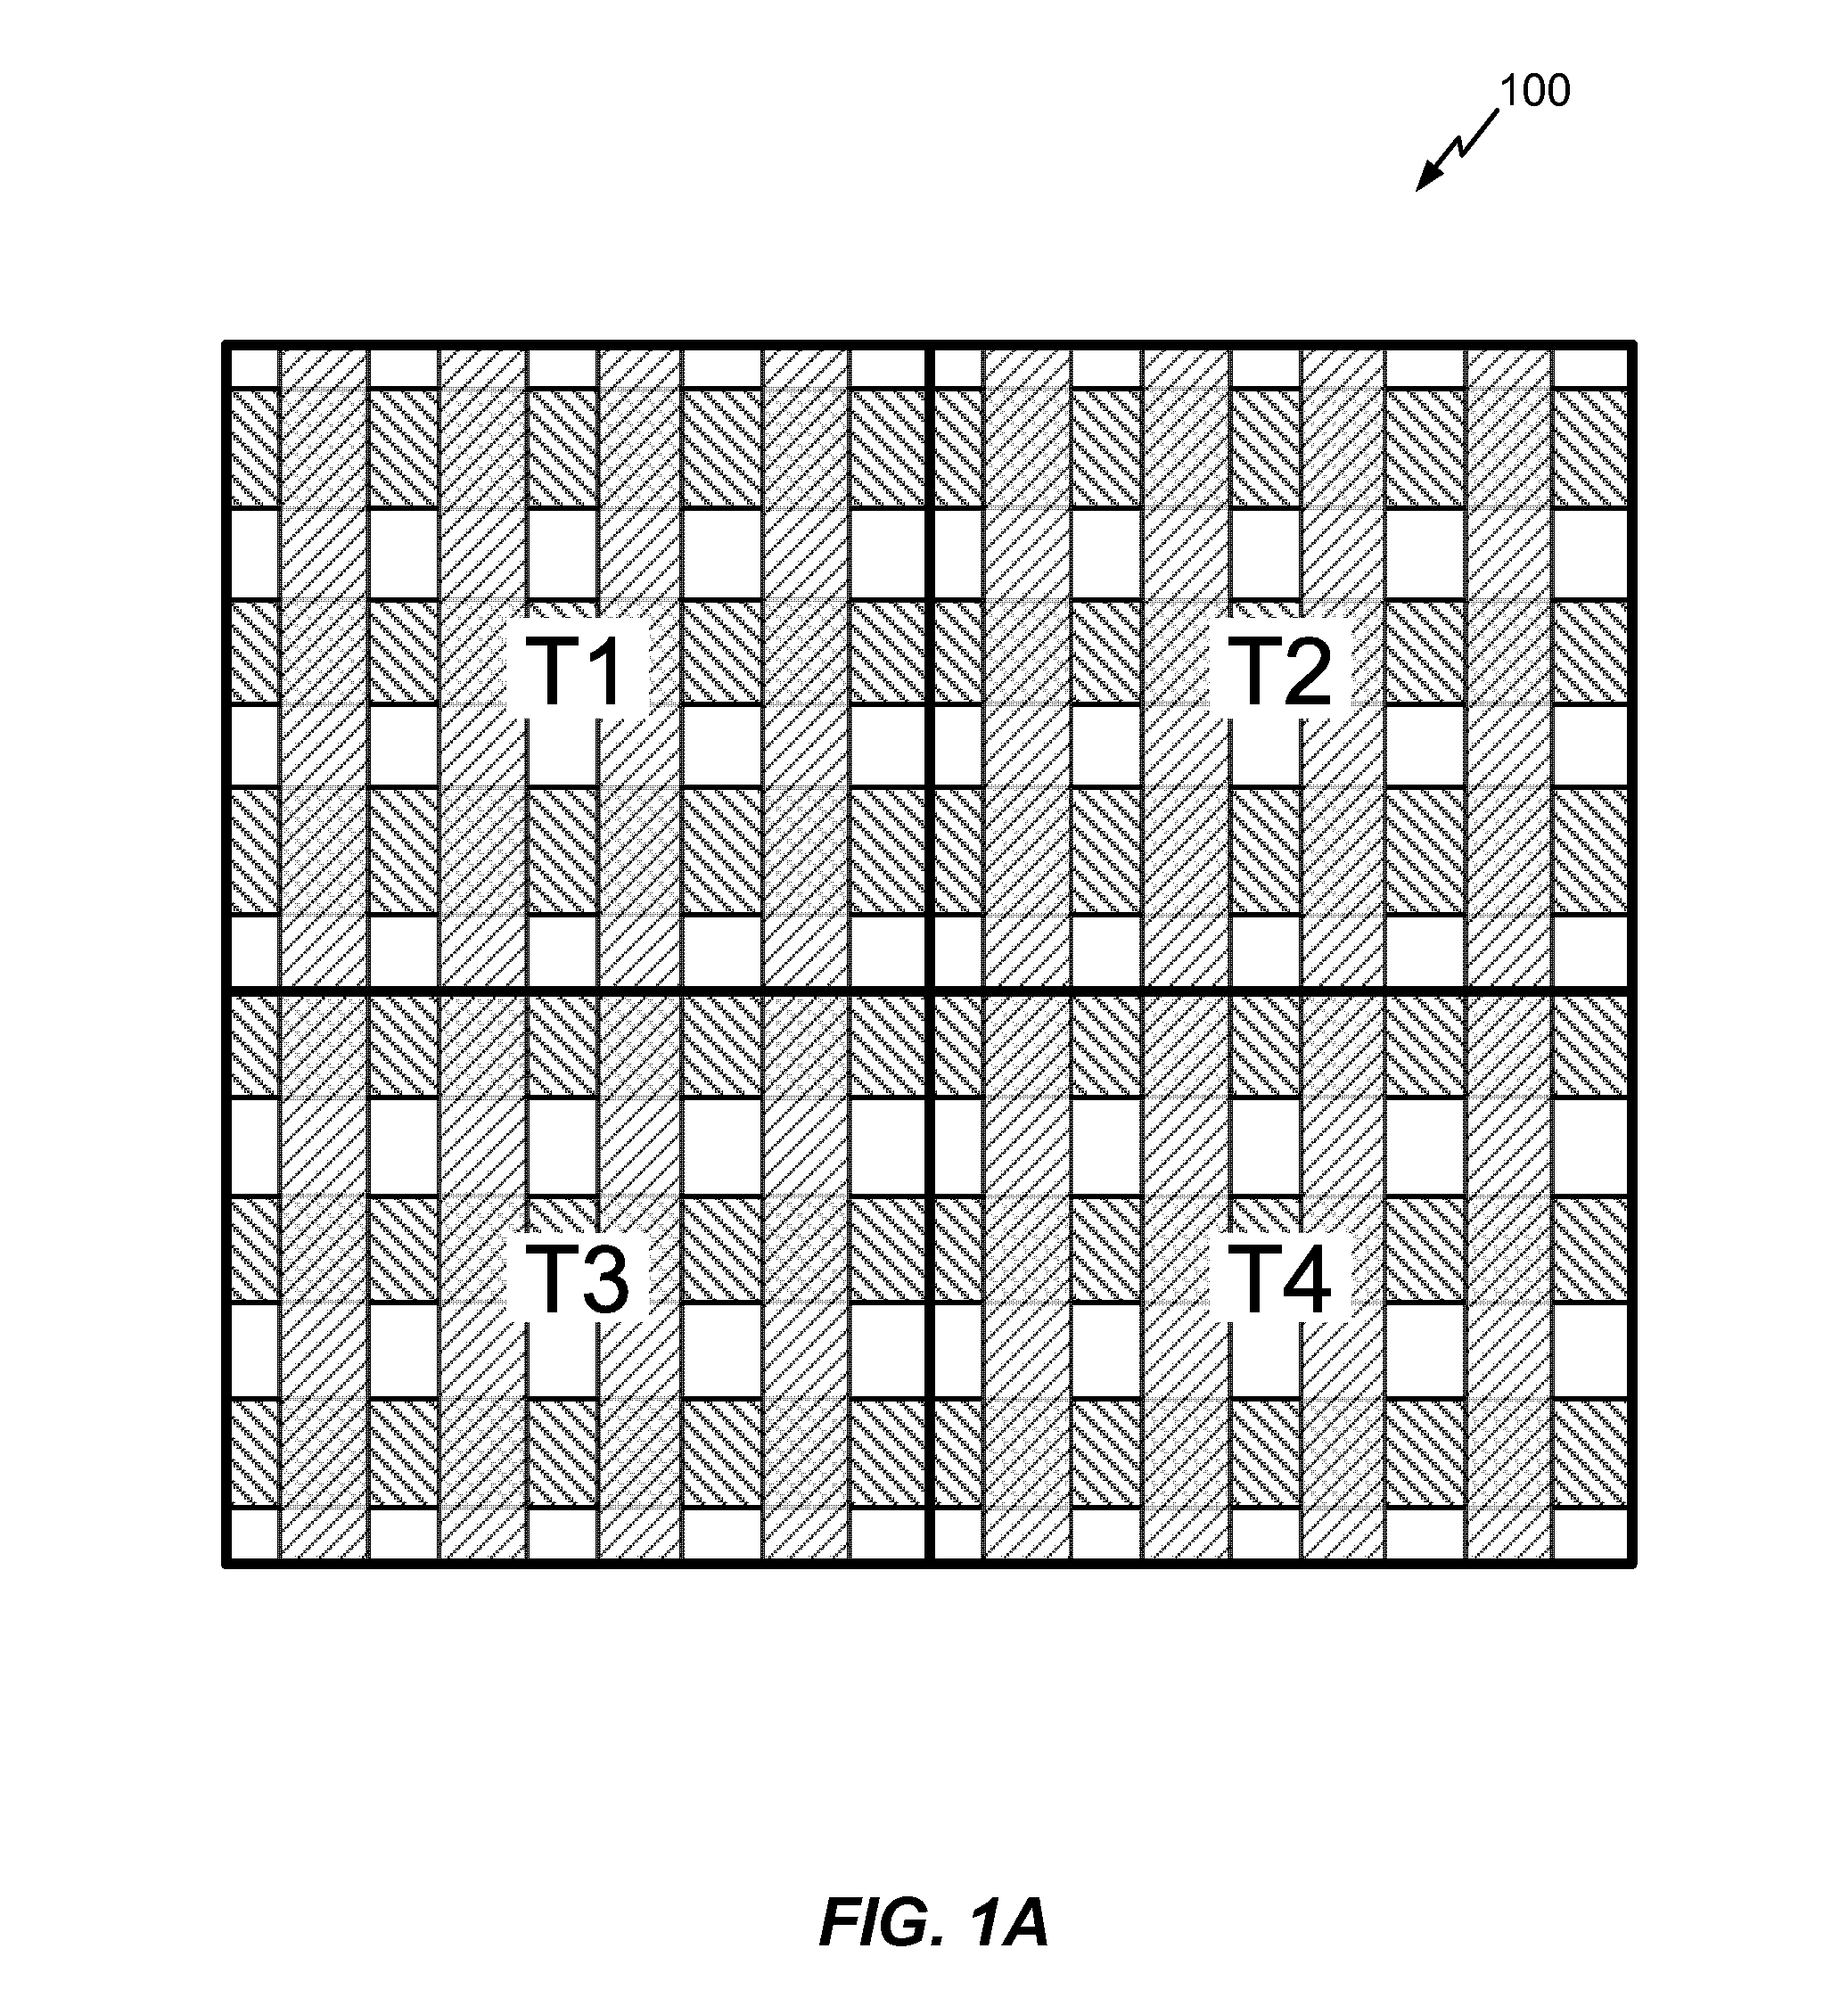
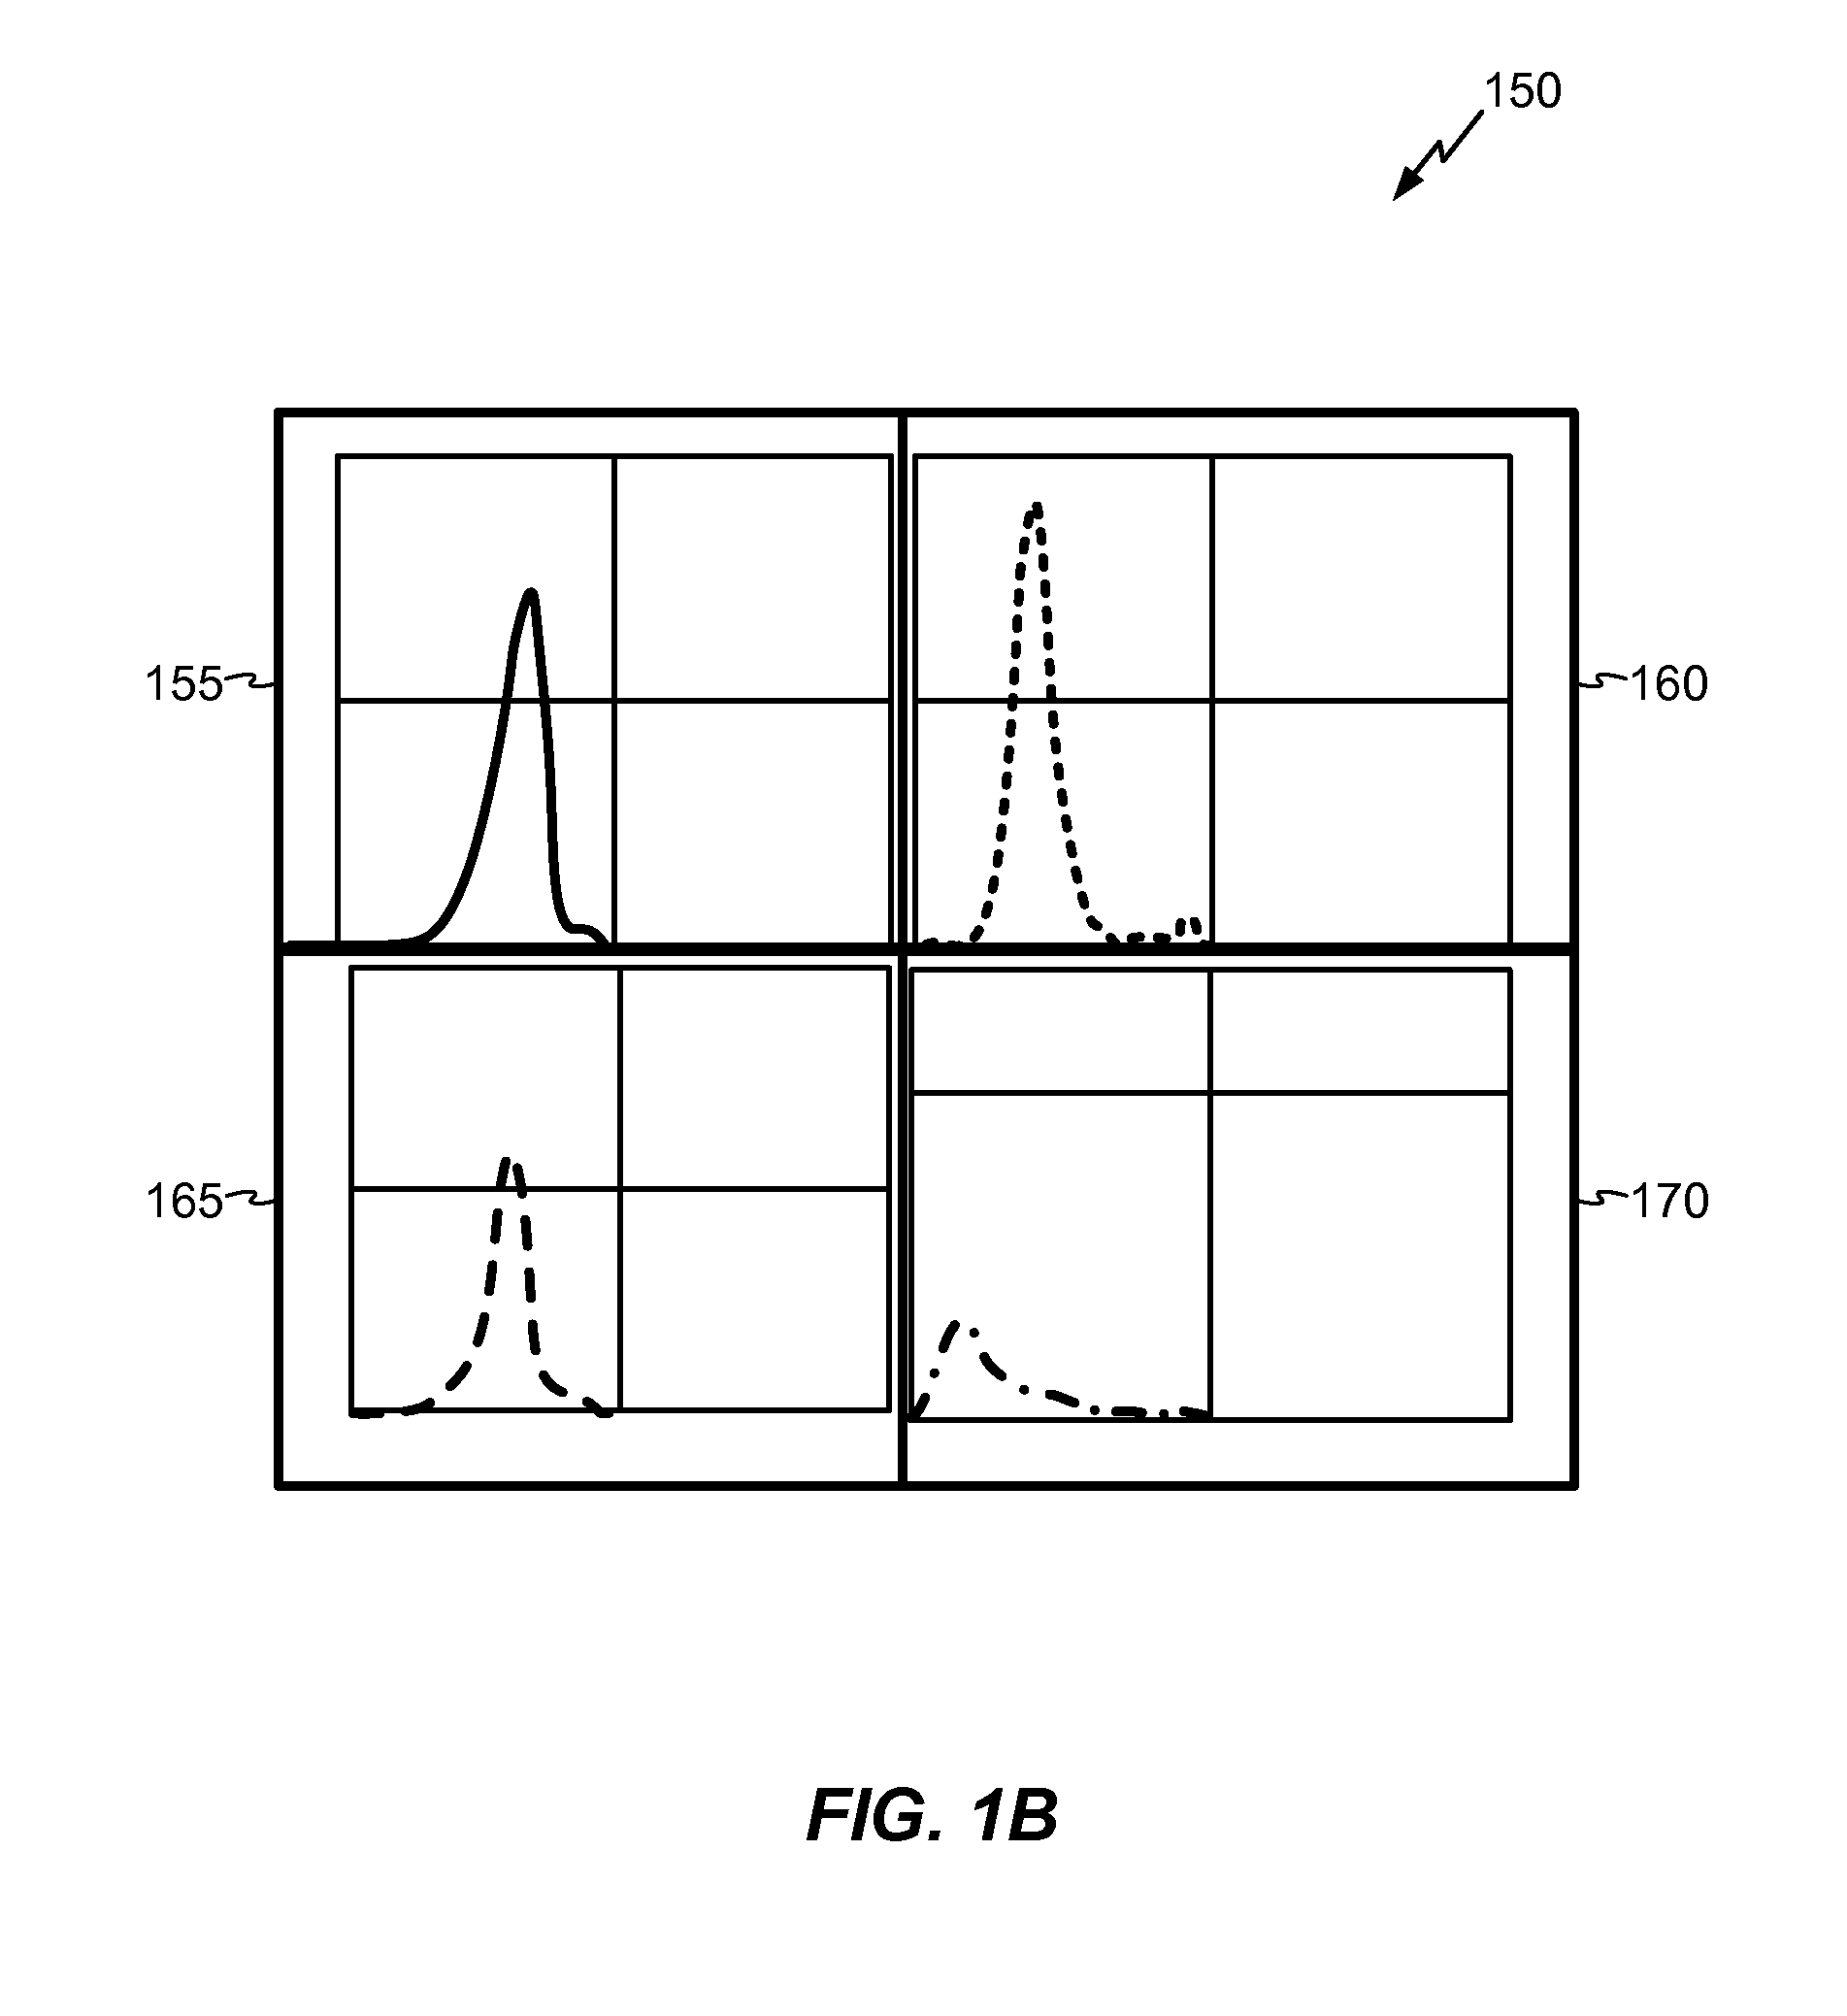
[0029]Methods and apparatus for Enhanced Static IR (i.e., current*resistance) Drop Analysis are provided. Enhanced Static IR Drop Analysis can be used to determine a quality and robustness of a power distribution network in a circuit. Enhanced Static IR Drop Analysis can be used for quick assessment of peak current distribution and determining how the peak current distribution stresses a power distribution network (PDN). Enhanced Static IR Drop Analysis is useful during earlier stages of circuit design, when quickly producing circuit performance data is imperative and conventional techniques require significant resources.

[0030]Enhanced Static IR Drop Analysis uses peak current demand data instead of average power distribution data. In examples, Enhanced Static IR Drop Analysis includes recording time points at which global current demand profile peaks, sampling instantaneous current from individual tile-based current demand profiles at each time point, and running Static...


PUM


Abstract

Methods and apparatus for Enhanced Static IR Drop Analysis are provided. Enhanced Static IR Drop Analysis can be used to determine a quality and robustness of a power distribution network in a circuit. In examples, Enhanced Static IR Drop Analysis includes recording time points at which global current demand profile peaks, sampling instantaneous current from individual tile-based current demand profiles at each time point, and running Static IR Analysis for the tiles at the time points to determine tile current use by the tiles during the time points. Enhanced Static IR Drop Analysis can be used for quick assessment of peak current distribution and determining how the peak current distribution stresses the power distribution network. Enhanced Static IR Drop Analysis is useful during earlier stages of circuit design, when quickly producing circuit performance data is imperative and conventional techniques require significant resources.

Description

FIELD OF DISCLOSURE[0001]This disclosure relates generally to electronics, and more specifically, but not exclusively, to methods and apparatus for Enhanced Static IR Drop Analysis.BACKGROUND[0002]Today's ultra-deep sub-micron very large scale integration (VLSI) circuit designs are extremely complex, and are characterized by escalating gate counts, shrinking wire widths, and bigger die size. The higher gate count leads to worsening on-chip average and peak current demand, while smaller wire widths directly contribute to higher power grid (PG) mesh resistance. The combination of higher peak current demand and higher PG grid resistance degrades on-chip IR (i.e., current*resistance) drop and makes Power Delivery Network (PDN) signoff a complicated and challenging task. PDN analysis and verification has emerged as a key component in modern power sign-off methodology.[0003]Industry-standard methods for analyzing overall PDN robustness and quality include Dynamic Voltage Drop Analysis bas...

Claims


Application Information

Patent Timeline
Patent Type & Authority Patents(United States)
IPC IPC(8): G06F17/50
CPCG06F17/5081G06F17/5036G06F30/367G06F30/398
Inventor SAJID, KHUSROBANSAL, MAMTAARABI, KARIM
Owner QUALCOMM INC
Why Eureka
Try Eureka