Method for assisting judgment of abnormality of reaction process data and automatic analyzer

a technology of reaction process data and abnormality detection, applied in chemical methods analysis, instruments, material analysis, etc., can solve the problems of preventing any measurement guarantee, and achieve the effect of reducing the abnormality occurrence site, facilitating the detection of certain abnormalities, and efficient device maintenan

Active Publication Date: 2015-12-22
HITACHI HIGH-TECH CORP
View PDF19 Cites 4 Cited by
  • Summary
  • Abstract
  • Description
  • Claims
  • Application Information

AI Technical Summary

Benefits of technology

[0012]Through a method for assisting judgment of abnormality that computes a feature parameter of a given change in absorbance, it is possible to make it easier to find certain abnormalities. It is possible to narrow down the abnormality occurrence site in the device, and device abnormality can thus be found quickly. In addition, through a method for assisting judgment of abnormality that presents an abnormality occurrence frequency, device state estimation using reaction process data becomes possible, and it becomes possible to achieve more efficient device maintenance and improved device reliability without the addition of any new parts.

Problems solved by technology

Thus, if it is judged that there is an abnormal change in absorbance, it would signify that some abnormality had occurred in the device, sample or reagent at the time of measurement, thereby precluding any guarantee of the measurement results.

Method used


Image

  • Method for assisting judgment of abnormality of reaction process data and automatic analyzer
  • Method for assisting judgment of abnormality of reaction process data and automatic analyzer
  • Method for assisting judgment of abnormality of reaction process data and automatic analyzer

Examples


embodiments

Embodiment 1

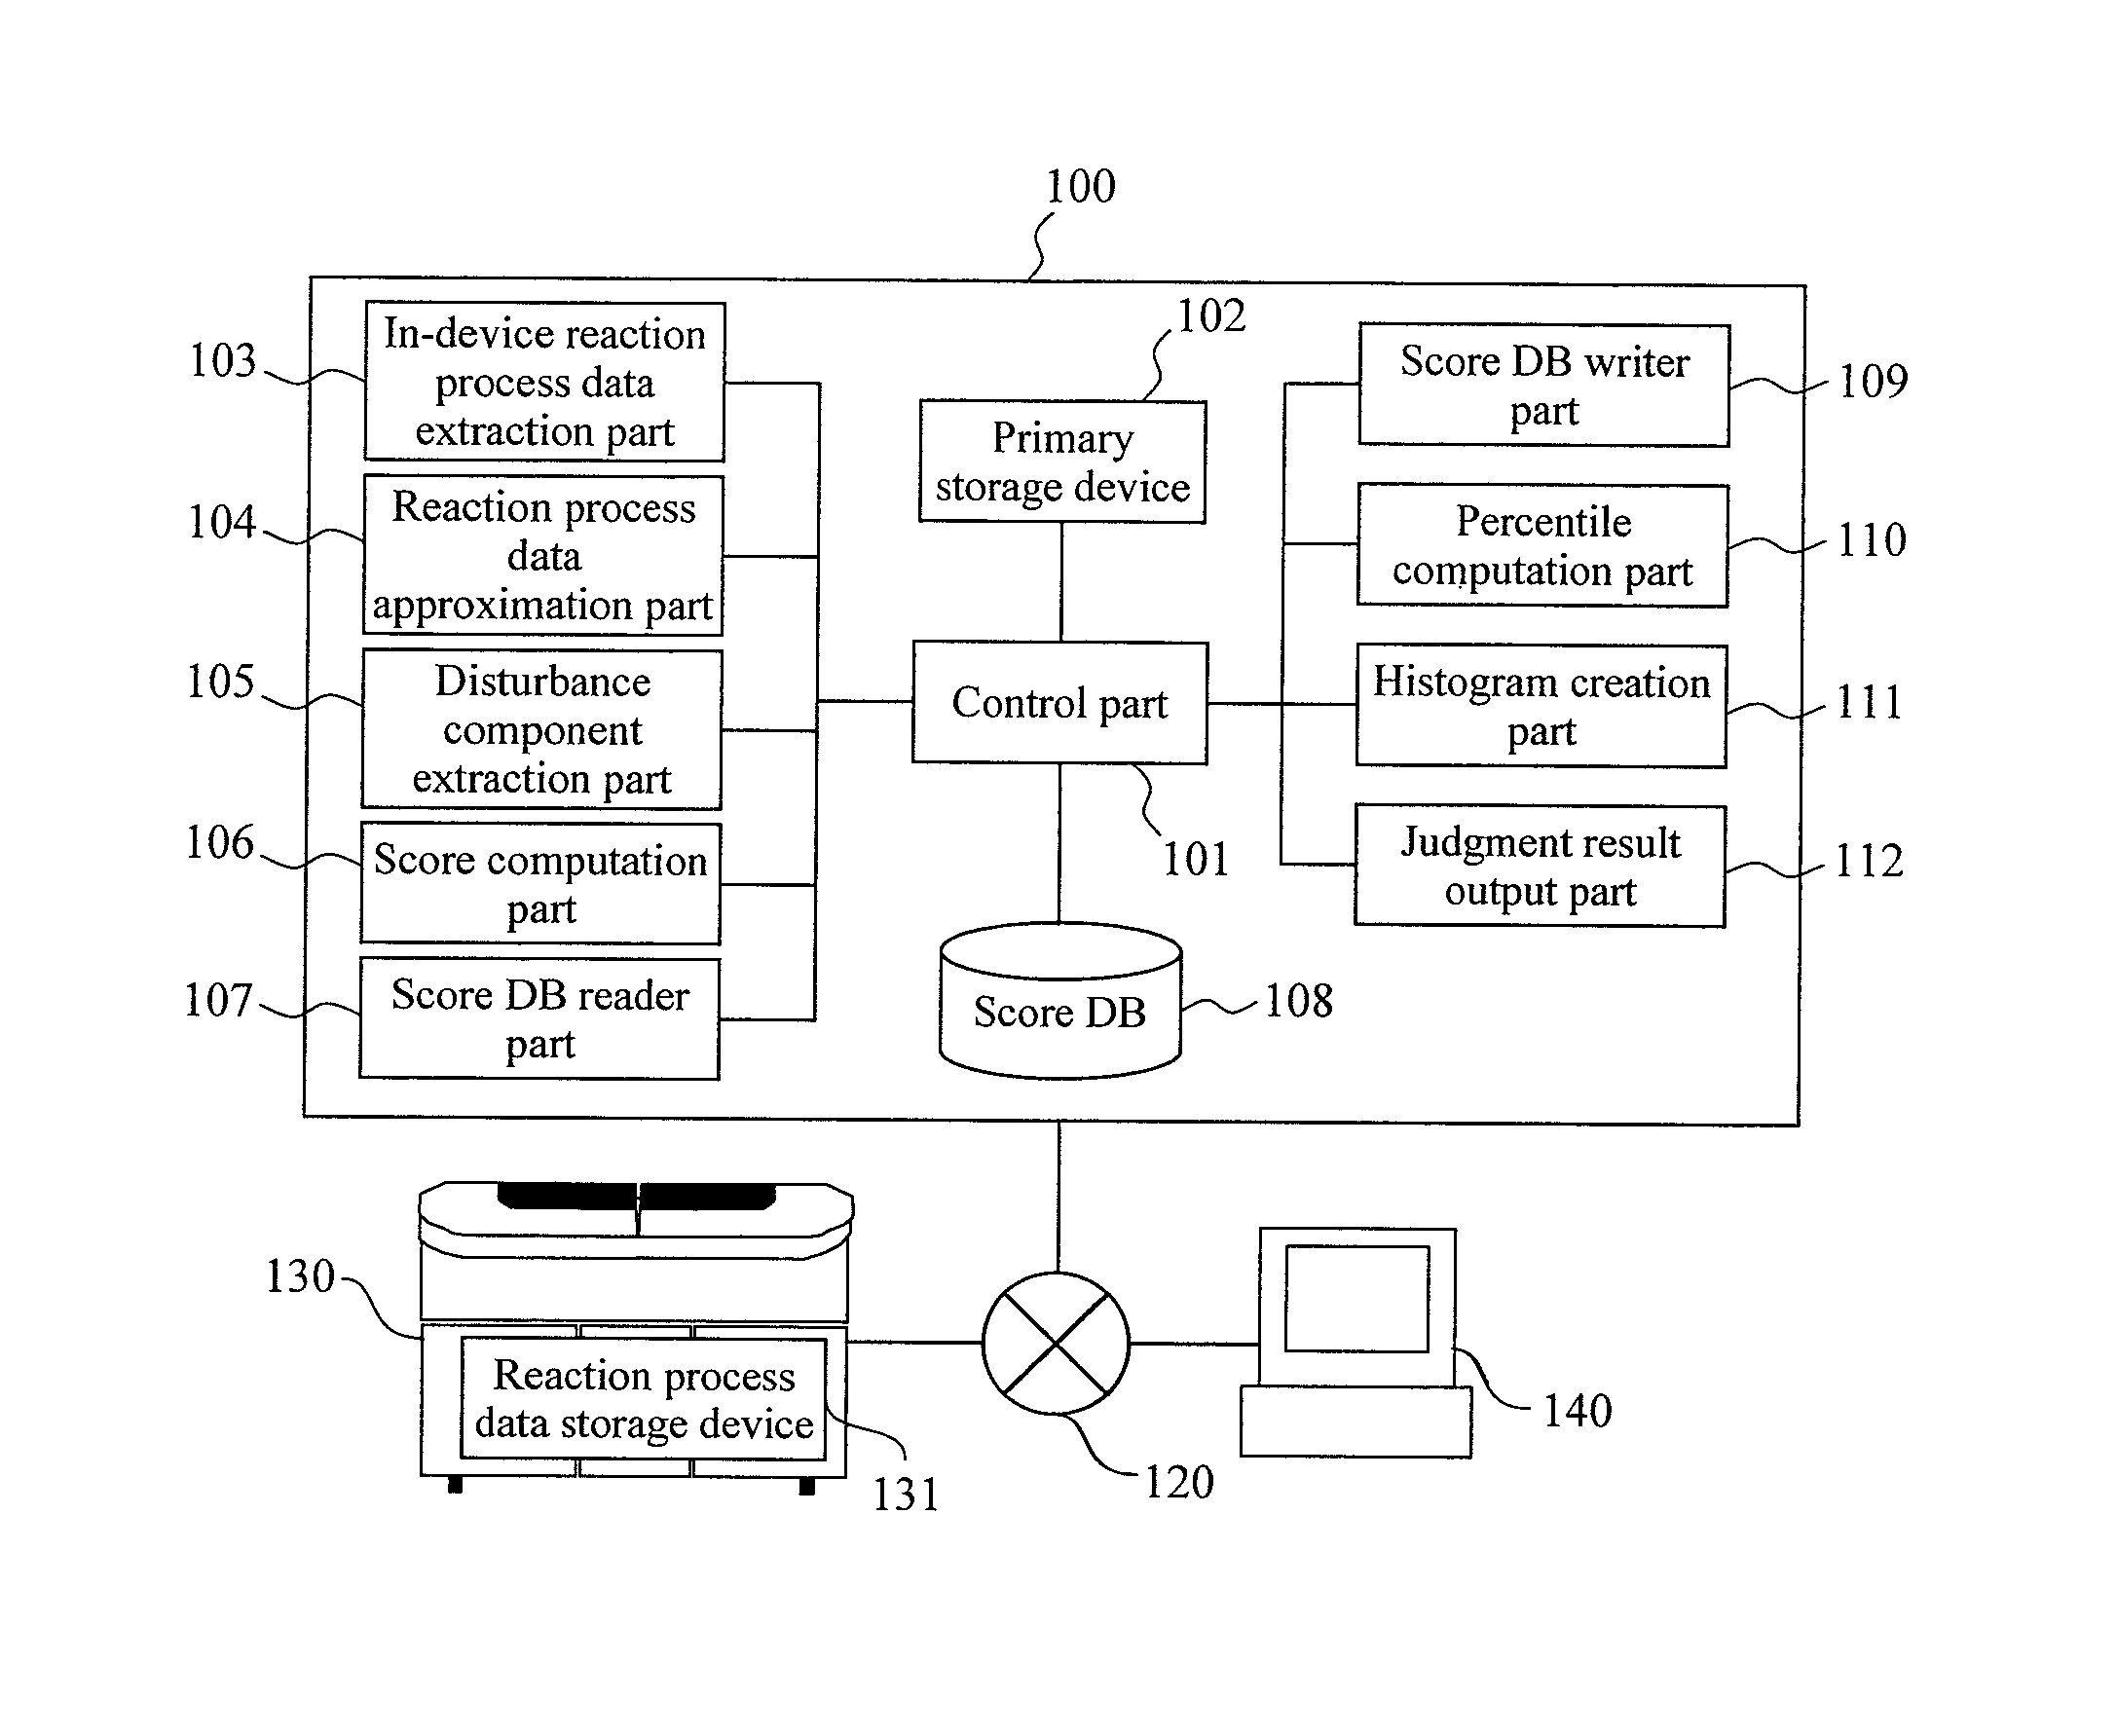
[0025]A configurational diagram of a system 100 for assisting judgment of abnormality as a first embodiment of the present invention is shown in FIG. 1.

[0026]The present system 100 comprises: a control part 101; a primary storage device 102; an in-device reaction process data extraction part 103; a reaction process data approximation part 104; a disturbance component extraction part 105; a score computation part 106; a score DB reader part 107; a score DB 108; a score DB writer part 109; a percentile computation part 110; a histogram creation part 111; and a judgment result output part 112.

[0027]Although the present system 100 is described in terms of hardware configuration, the functions of the present system 100 may also be configured with software.

[0028]The present system 100 is capable of communicating with an automatic analyzer 130 via a network 120. In addition, the present system 100 is capable of communicating with an input / output terminal 140 via the network 120...

embodiment 2

[0069]Next, the second embodiment of the present invention is described. The present embodiment is one in which there has been added a process of extracting an absorbance change component caused by disturbances by removing from the reaction process data an absorbance change component caused by the reaction. The other features and processes are generally the same as those in the first embodiment.

[0070]There is shown in FIG. 9 a flowchart for quantifying the magnitude of a jump based on reaction process data that is obtained by measuring a quality control sample.

[0071]First, step 901, which is the same as step 301 mentioned above, is executed.

[0072]Next, the control part 101 activates the reaction process data approximation part 104, and executes step 902 wherein an approximate function for the reaction process data is computed. For example, assuming Equation (2) is a model of the approximate function, approximate parameters k, A0 and A1 are computed, and an approximate value is found...

embodiment 3

[0086]Next, the third embodiment of the present invention is described. The configuration of the device is the same as in Embodiments 1 and 2. FIG. 12 shows a process flow for judging the presence / absence of an abnormality in the reaction process data in the present embodiment. It is noted that process steps that perform the same processes as those in FIG. 9 describing the process flow used in the description for Embodiment 2 are designated with the same symbols.

[0087]Since the processes across process steps 901-912 are the same as the process steps of the same reference numerals in FIG. 9 with respect to Embodiment 3, descriptions will be omitted. In addition, the processes of process steps 1210-1230 discussed below are performed at the control part. The determination as to whether or not to compute the percentile value in process step 907 is set in advance by the user. Percentile computation may be executed with respect to all items, or with respect to only a portion of the items....


PUM

PropertyMeasurementUnit
concentrationaaaaaaaaaa
wavelengthsaaaaaaaaaa
timeaaaaaaaaaa

Abstract

In the event of a suspected abnormality in the device, sample or reagent, a laboratory technician had to examine the abnormal reaction process data item by item, and infer the cause of the abnormality, which took effort and time in some cases. Abnormality judgment is assisted using: indicator computation means that computes an indicator indicating a feature parameter of a given waveform by applying a pre-defined evaluation formula to time series data of photometric values; relative indicator computation means that computes a value indicating a relationship of the indicator of target data to the indicator computed in the past; and indicator display means that simultaneously displays a value computed by the indicator computation means and the value computed by the relative indicator computation means. According to the present method, which is a method for assisting judgment of abnormality wherein a feature parameter of a given absorbance change is computed, it can be made easier to find certain abnormalities, and it becomes possible to attain more efficient device maintenance and improved device reliability without the addition of any new parts.

Description

TECHNICAL FIELD[0001]The present invention relates to a technique and an automatic analyzer for measuring the concentration and activity value of a component of interest in a sample, as well as to software and a system that utilize the data from the measurement.BACKGROUND ART[0002]An automatic analyzer is a device that causes a chemical reaction by dispensing a sample and a reagent into a cell, measures the absorbance of this mixture, calculates the amount of change in absorbance and / or the rate of change in absorbance based on time series data of absorbance caused by the chemical reaction (hereinafter referred to as reaction process data), and computes the concentration and / or activity of a component of interest in the sample.[0003]Such automatic analyzers are used in biochemical tests, immunological tests, etc., mainly at medical facilities. Results of such tests play an extremely important role when doctors make various diagnoses such as learning about a patient's disease conditi...

Claims


Application Information

Patent Timeline
Patent Type & Authority Patents(United States)
IPC IPC(8): G06F19/00G01N21/77G01N35/00G01N21/00
CPCG01N35/00603G01N21/77G01N21/272G01N21/78G01N2035/0097
Inventor MITSUYAMA, SATOSHIFUKUYAMA, YUKITAKADA, HIDEKATSUBAN, HIDEYUKIMIMURA, TOMONORI
Owner HITACHI HIGH-TECH CORP
Why Eureka
Try Eureka