Data overlay for animated map weather display and method of rapidly loading animated raster data

a technology of animated map and data overlay, which is applied in the direction of navigation instruments, instruments, wireless commuication services, etc., can solve the problems of cumbersome and costly implementation of the method of displaying animated data when a user zooms in or out, and the technique does not lend itself well to accurate display of raster imagery, so as to reduce the amount of data transferred, reduce the transfer time, and accept the appearance

Active Publication Date: 2017-07-18
DTN LLC
View PDF3 Cites 0 Cited by
  • Summary
  • Abstract
  • Description
  • Claims
  • Application Information

AI Technical Summary

Benefits of technology

[0008]It is therefore one objective of the present invention to provide a system and method of presenting raster imagery in an overlay that displays changes in information such as weather data over time. This is accomplished by displaying such weather data in an animated raster layer, such as for example describing forecasted air temperature as it changes over time. Because such layers have an acceptable appearance if they are stretched or squished, once the client has loaded a tile of data representing a smaller slice of a larger image, it will be manipulated (by stretching or “squishing” it as necessary) when the user zooms in and out to reduce the amount of data transferred. In the present invention, this raster data is initially loaded for a coarser zoom level than the current view, and is then manipulated as necessary as the client would do if the user had started at the coarser view and zoomed in. In this manner, the present invention intentionally loads a seemingly incorrect resolution, resulting in reduced transfer times. Further, when the user zooms in or out, the client application or browser manipulates the coarser view rather than reloading the data from scratch at a new resolution. Using this approach, and in a further objective, the present invention reduces the load time and data transfer requirements of raster imagery for animation by as much as 90% while still maintaining acceptable image quality. This improves the user experience by sacrificing unnecessary precision in exchange for reducing load times from minutes to seconds, and in the process, realizes significant savings in bandwidth costs.

Problems solved by technology

However, these techniques do not lend itself well to accuracy in the display of raster imagery such as weather data in slippymap technology, since the image selected for zooming in or out must still be separately downloaded when selected.
These existing methods of displaying animated data when a user zooms in or out are therefore cumbersome due to lengthy download times resulting from high bandwidth consumption, and they are costly to implement for the same reason.

Method used


Image

  • Data overlay for animated map weather display and method of rapidly loading animated raster data
  • Data overlay for animated map weather display and method of rapidly loading animated raster data
  • Data overlay for animated map weather display and method of rapidly loading animated raster data

Examples


Embodiment Construction

[0015]In the following description of the present invention reference is made to the accompanying figures which form a part thereof, and in which is shown, by way of illustration, exemplary embodiments illustrating the principles of the present invention and how it is practiced. Other embodiments will be utilized to practice the present invention and structural and functional changes will be made thereto without departing from the scope of the present invention.

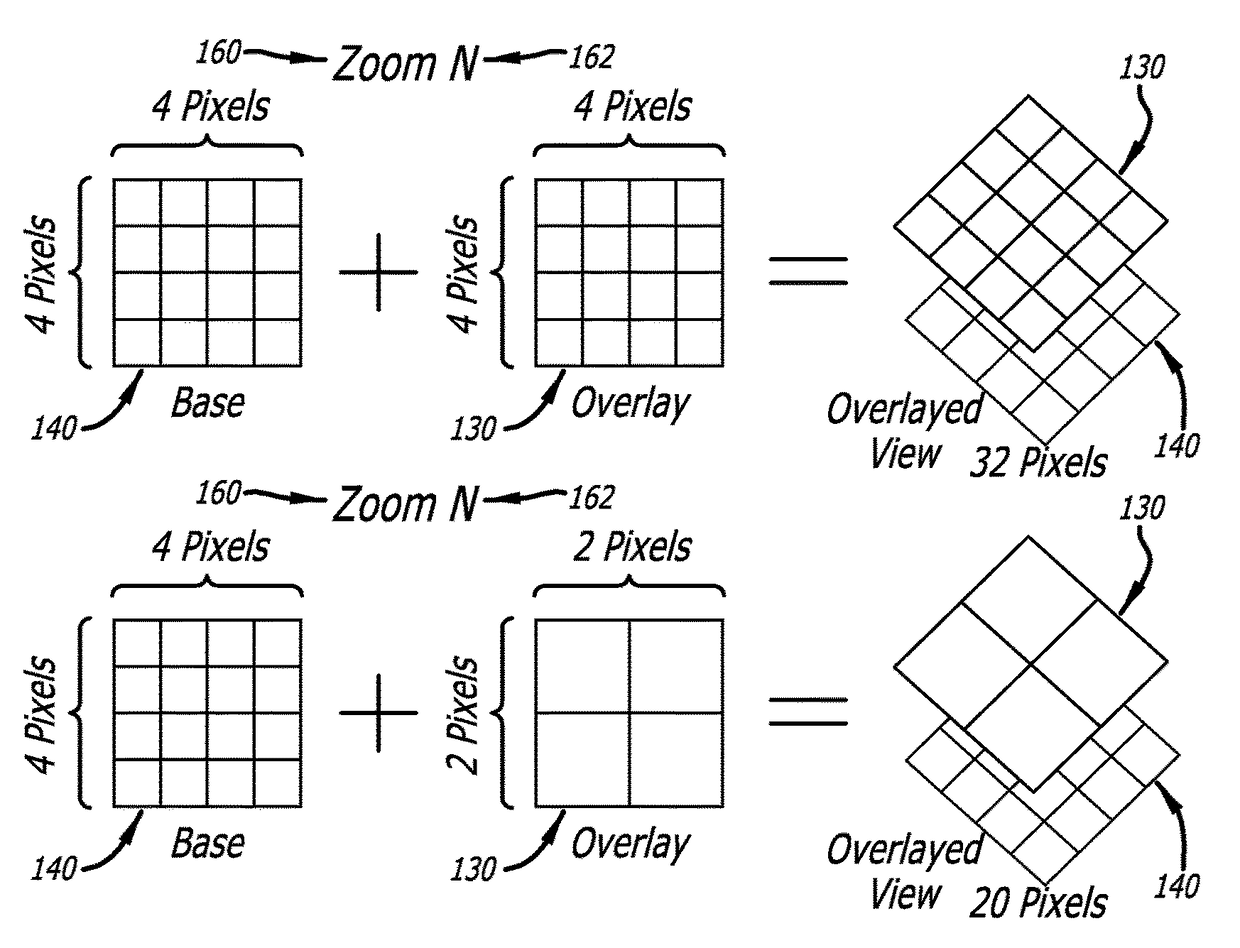
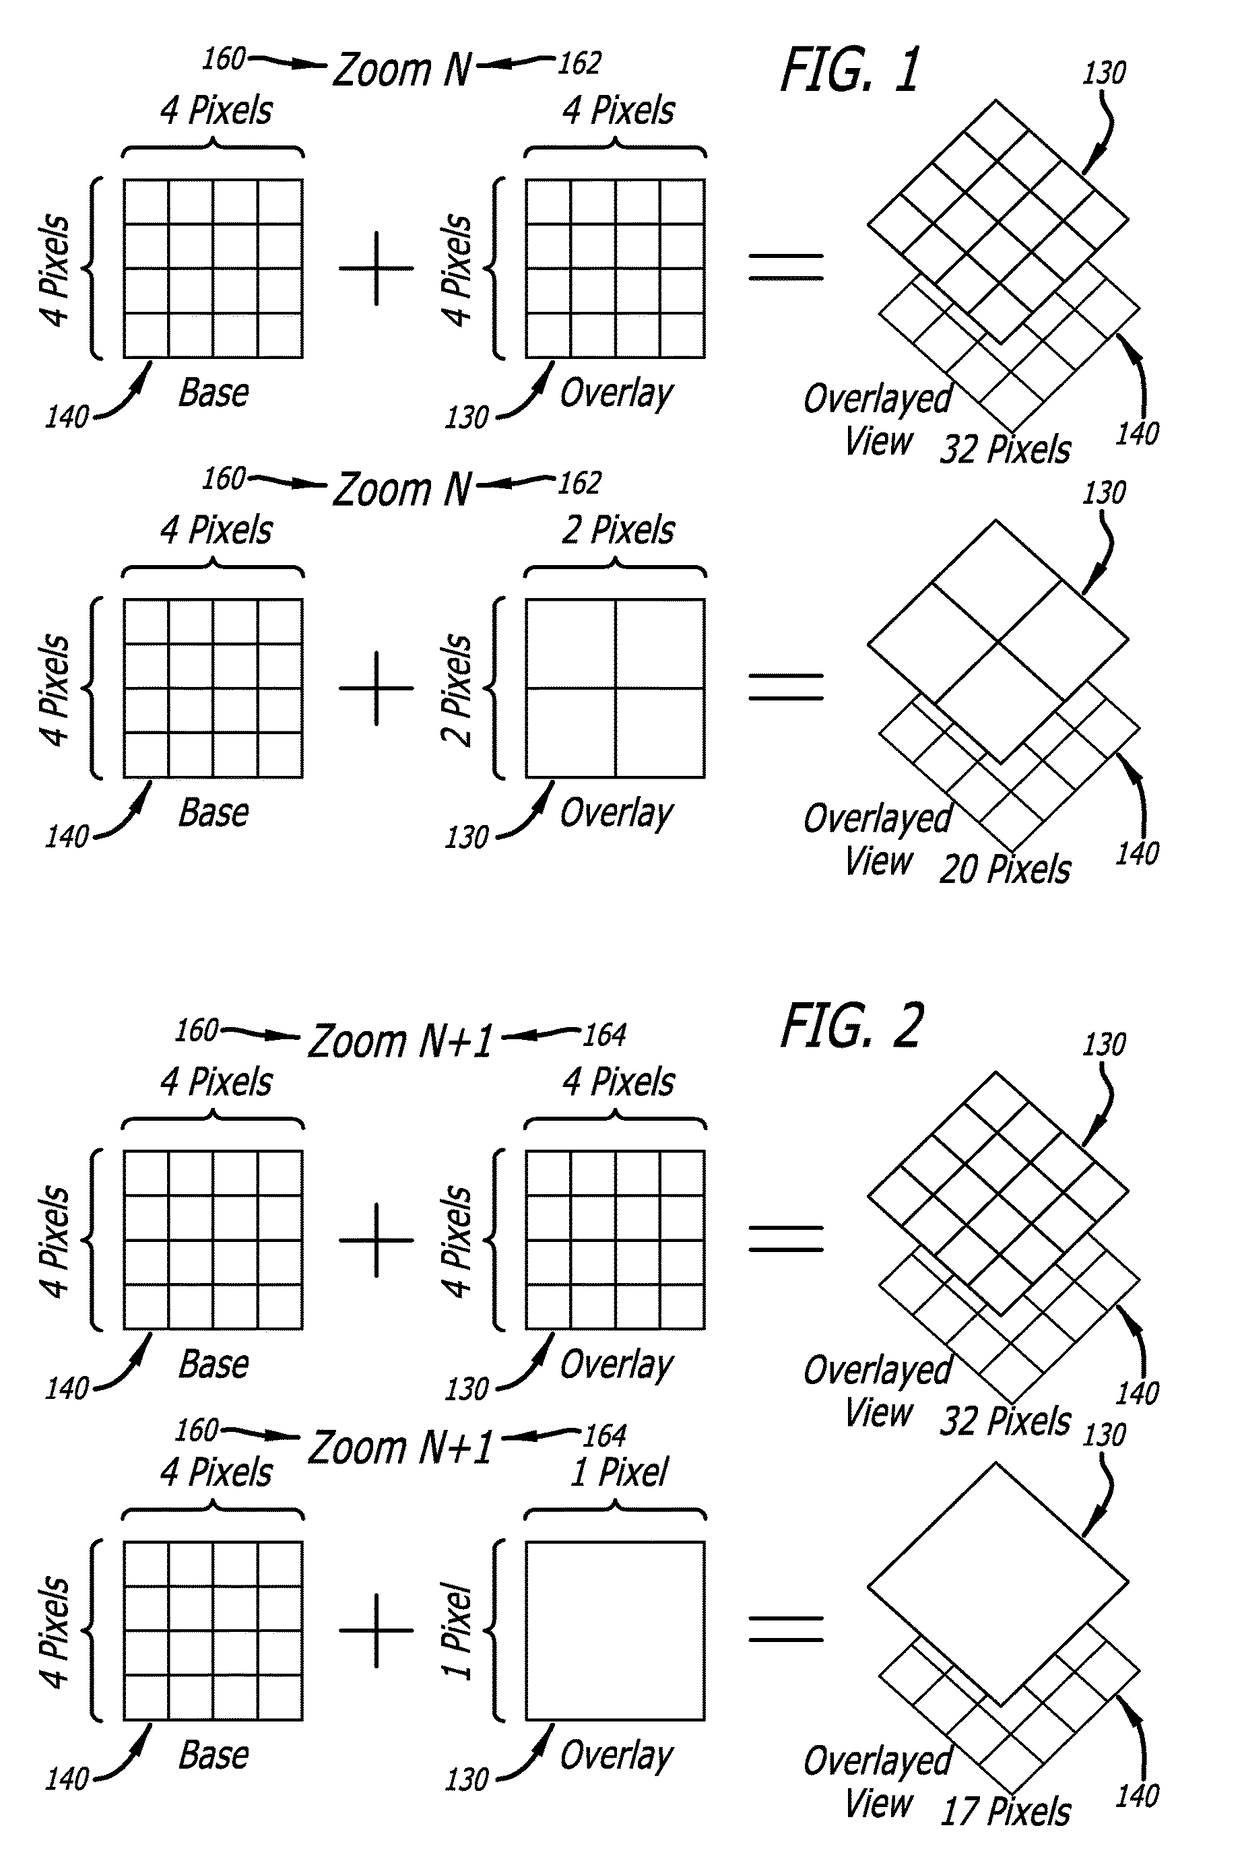
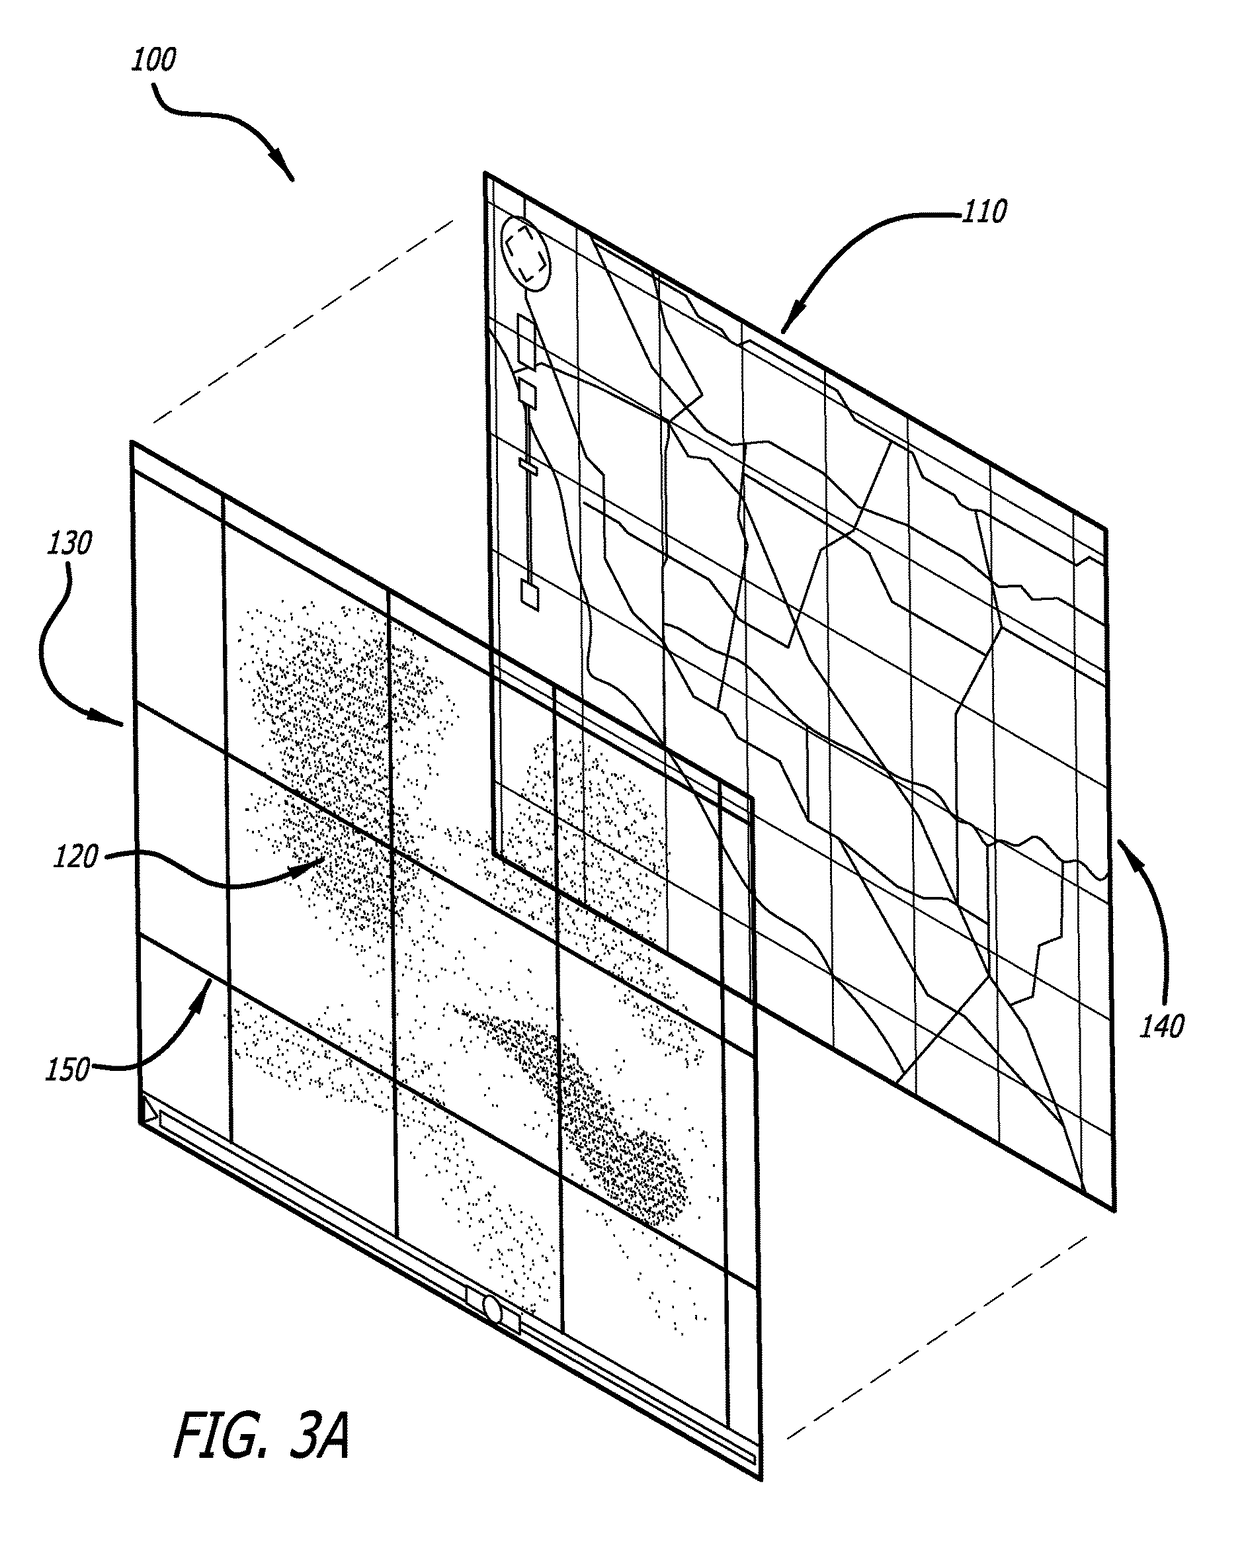
[0016]The present invention provides a data visualization technique 100, which represents a system and method of displaying data 120 in an animated map 110 such as a “slippymap” which significantly improves data transfer time and reduces costs from bandwidth usage. The present invention provides a quick-loading method of presenting animated raster imagery 130 on such a map 110, independent from and overlaid on top of a base layer 140. In a slippymap implementation, these raster overlays 130 are displayed as tiles 150 that are...


PUM


Abstract

A data visualization technique rapidly loads images to decrease data transfer time and associated bandwidth cost for animation effects in displays of data, and includes initially loading raster imagery at a coarser zoom level than a current view on the display, and then manipulating the imagery using general-purpose image manipulation algorithms to interpolate data points as a user adjusts the zoom level. In this manner, the data visualization technique intentionally displays a coarser view than that selected, rather than transferring entirely new imagery or datasets, and manipulates the imagery as necessary to avoid loading more data from a remote server to the local client each time the user adjusts the view.

Description

CROSS-REFERENCE TO RELATED PATENT APPLICATIONS[0001]This patent application claims priority to U.S. provisional application 61 / 839,069, filed on Jun. 25, 2013,the contents of which are incorporated in their entirety herein.FIELD OF THE INVENTION[0002]The present invention relates to a method of data transfer for an animated display of raster imagery. Specifically, the present invention relates to transfer and display of information such as weather data as an animated overlay on a base map that allows for significant savings in bandwidth cost and time by performing pixel and image size calculations at a local client, so that images of a certain resolution do not need to be loaded each and every time a different view of the image is requested at the local client.BACKGROUND OF THE INVENTION[0003]There are many existing methods of displaying information on an animated map. In animated map technology, a “slippymap” is a tile-based map that permits a user to perform pan and zoom display c...

Claims


Application Information

Patent Timeline
Patent Type & Authority Patents(United States)
IPC IPC(8): G09B29/00G06T3/40G06T17/05H04W4/00G01C21/36G09G5/14
CPCG06T3/40G01C21/367G06T17/05G09B29/003G09G5/14H04W4/00G06T2210/36G09G2340/04G01C21/3691G06T2210/08G09G2340/045G09G2340/12G09G2350/00
Inventor KJELDERGAARD, ERIC DEANPEDERSEN, LEIF
Owner DTN LLC
Why Eureka
Try Eureka