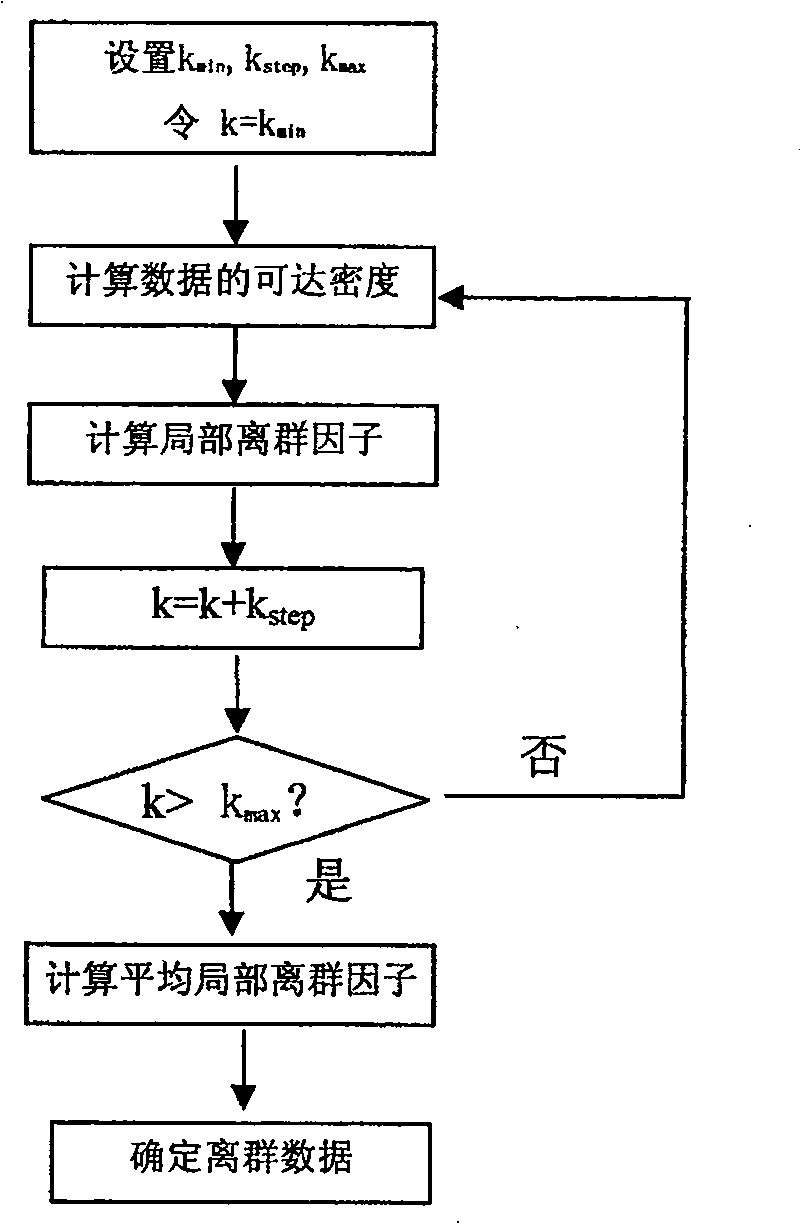
Method for recognizing outlier traffic data
A traffic data and outlier data technology, applied in the field of identifying outlier traffic data, can solve the problems of vague model points and inability to reflect the essence of the real system.
- Summary
- Abstract
- Description
- Claims
- Application Information
AI Technical Summary
Problems solved by technology
Method used
Image
Examples
Embodiment 1
[0038] Example 1: Traffic Flow Modeling
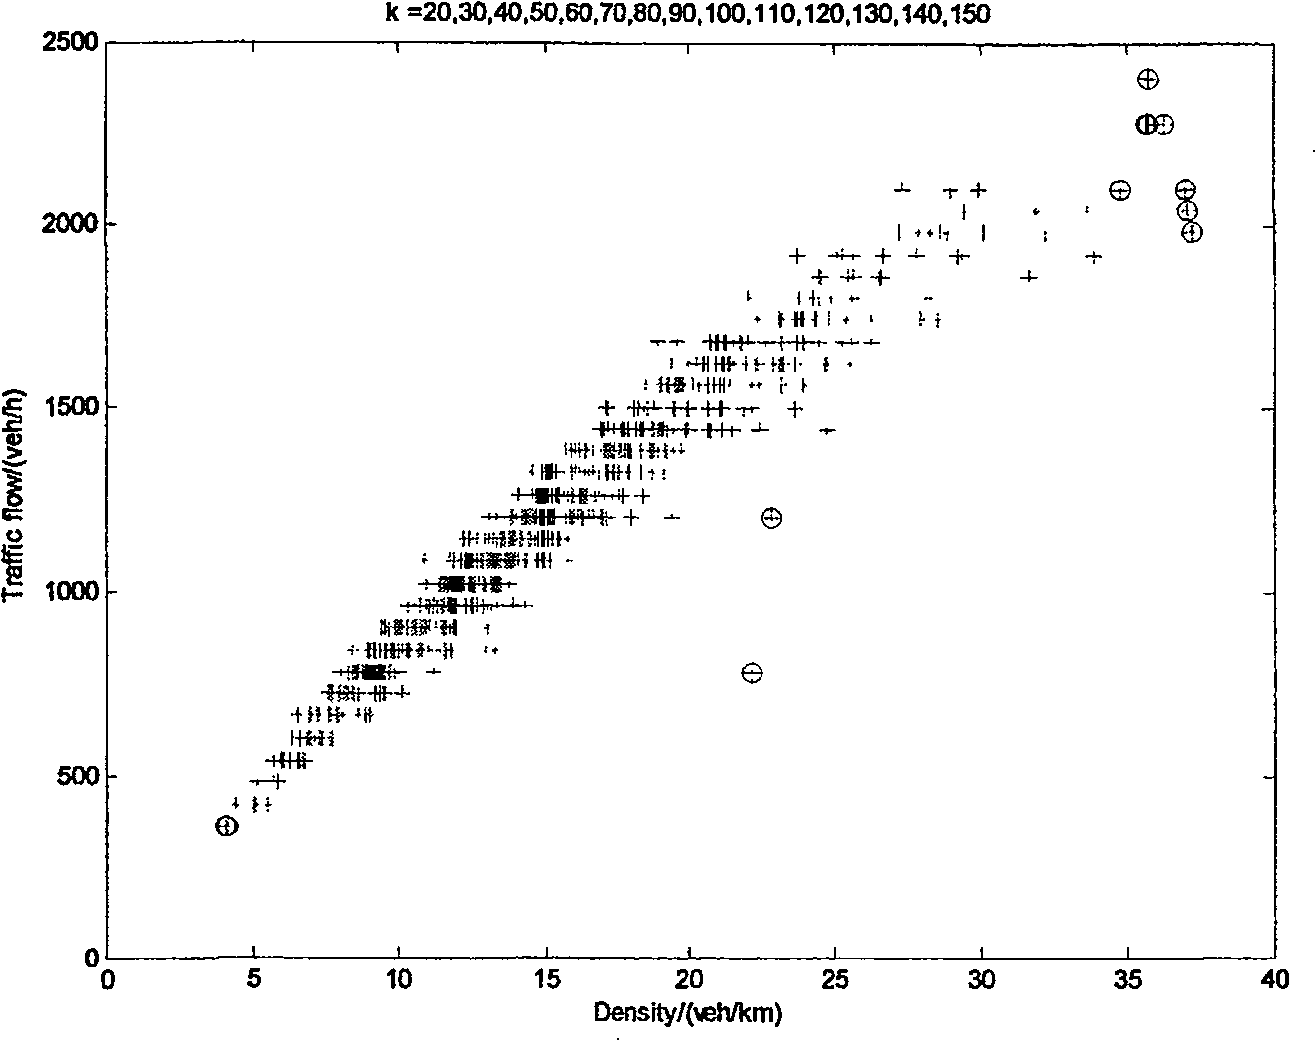
[0039] Expressway traffic flow is usually described by average vehicle speed, arrival rate, and density. The relationship between arrival rate and density can be described by a graph, which is called the basic graph of traffic flow. Errors in detection equipment or transmission equipment, and unexpected traffic events may cause abnormal changes in traffic flow data. Whether it is sampling errors or outlier data generated by abnormal traffic events, the characteristics of the model will become blurred and cannot truly reflect the system. inner law. Therefore, it is necessary to find out and remove outlier data before building a model to reduce the influence of outlier data and improve the accuracy and reliability of the built model.
[0040] At present, 709 pieces of traffic flow data of Nanjing Lukou Airport Expressway have been collected, and the sampling period is 1 minute. A model between arrival rate and density is proposed to be ...
Embodiment 2
[0042] Embodiment 2: Application of road surface roughness test
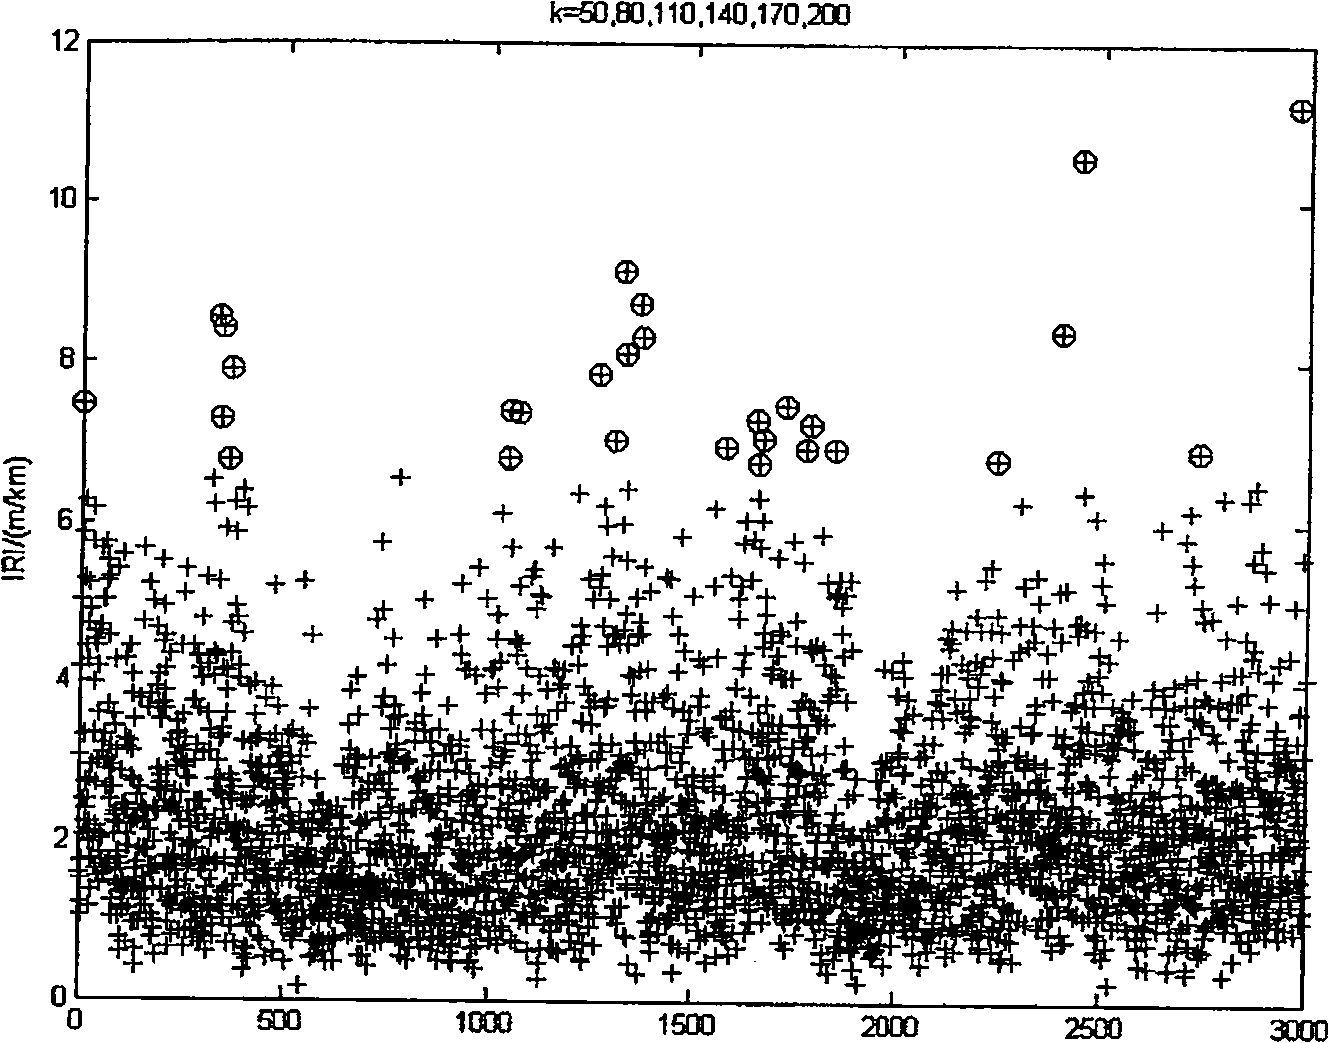
[0043] Pavement roughness is an important index of pavement surface function, which not only reflects the driving comfort of the pavement, but also reflects the health of the pavement from the side. The international roughness index IRI (International Roughness Index) has been widely adopted by countries all over the world. It is defined as the ratio of the total displacement (unit m) of the standard body suspension to the driving distance (unit km), and the unit is m / km. There are currently 8,000 IRI samples, and the data is collected every one meter. It is tested with a road surface roughness test vehicle imported from Australia.
[0044] Use the density-based detection method LOF to find specific samples, let k start from 50 as the initial value, increase with a step size of 10, and calculate the local abnormal factors of all samples. Then the average local outlier factor of all samples is calculated. Here,...
PUM
 Abstract
Description
Claims
Application Information
 - R&D
- Intellectual Property
- Life Sciences
- Materials
- Tech Scout
- Unparalleled Data Quality
- Higher Quality Content
- 60% Fewer Hallucinations
Browse by: Latest US Patents, China's latest patents, Technical Efficacy Thesaurus, Application Domain, Technology Topic, Popular Technical Reports.
© 2025 PatSnap. All rights reserved.Legal|Privacy policy|Modern Slavery Act Transparency Statement|Sitemap|About US| Contact US: help@patsnap.com


