Dynamic debugging method and system in embedded software running state

An embedded software and operating state technology, applied in the field of embedded systems, can solve problems such as it is difficult to clearly grasp the current operating state and the relationship between variables, unfavorable problem solving, program dead ends, etc.

Inactive Publication Date: 2009-07-15
ZTE CORP
View PDF0 Cites 23 Cited by
  • Summary
  • Abstract
  • Description
  • Claims
  • Application Information

AI Technical Summary

Problems solved by technology

[0002] At this stage, the most commonly used solution to software failures is that after a problem occurs in the software operation, first compile the debugging file, then load it into the system debugger, and finally run the debugger to set breakpoints for single-step tracking and debugging; such debugging methods mainly It is used to track some static program failures that inevitably occur. This method can be used to analyze and track conventional problems, but this method is absolutely useless for some occasional problems that appear in the project and need to meet certain conditions in the dynamic state. It is useless, because the occurrence of such problems often depends on the environment and the trigger conditions at that time. Such dynamic problems must be dynamically tracked during the dynamic running of the program to be resolved. If the debugger is running, the environment and conditions of the fault are likely to be It will be completely destroyed, which is not conducive to the solution of the problem; in addition, the embedded software is compiled into a debugging program and the sintering program is processed differently. Some problems occur when the software is running, and the problem does not appear after loading the debugger. up
[0003] At present, there have been some solutions to this problem, such as using the ASCII (American Standard Code for Information Interchange, American Standard Code for Information Interchange) code stream function to print and monitor program variable values ​​in real time. This method cannot fundamentally To solve the problem, because some programs have dead-end variable tracking, it is necessary to gradually analyze the correlation of variables in single-step tracking, and finally find out the crux and hidden dangers of the problem, and what is printed in ASCII code stream is the dynamic running data of the program, which is very difficult. It is difficult to grasp the relationship between the current running status and variables. In addition, every time a doubtful point is found, it is unrealistic and troublesome to modify the ASCII code stream function of the software, recompile and redownload the software. Debugging method in running state

Method used


Image

  • Dynamic debugging method and system in embedded software running state
  • Dynamic debugging method and system in embedded software running state

Examples


specific Embodiment 1

[0059] Specific Embodiment 1: The method is described by taking the single-step debugging mode as an example, wherein the instruction debugging task is the highest priority task of the system.

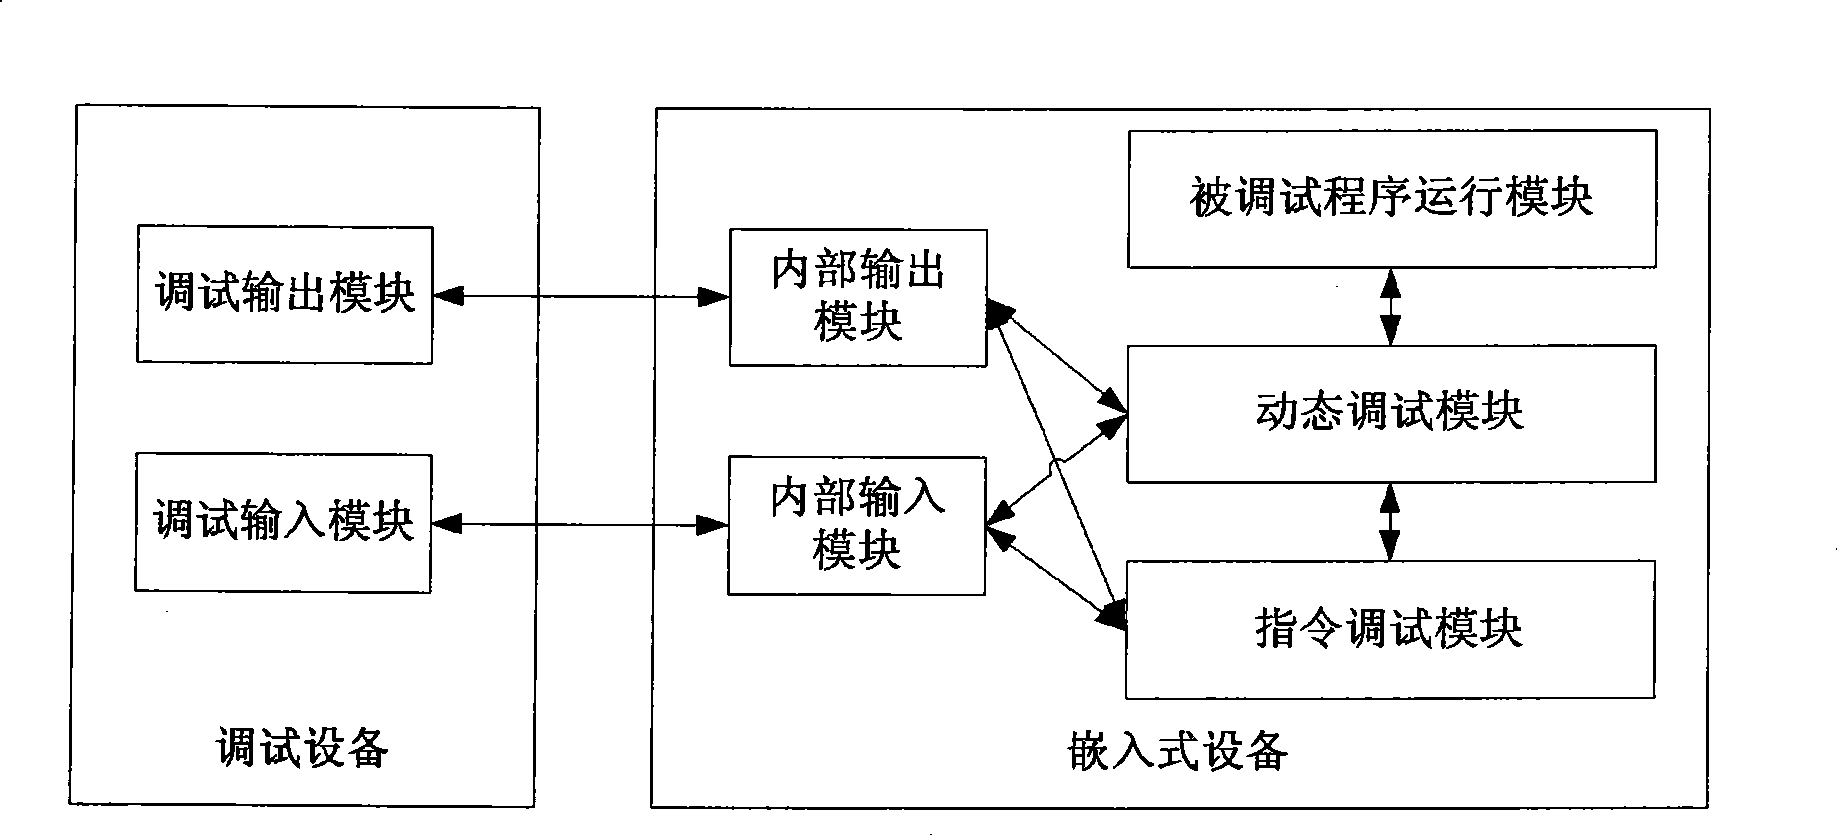
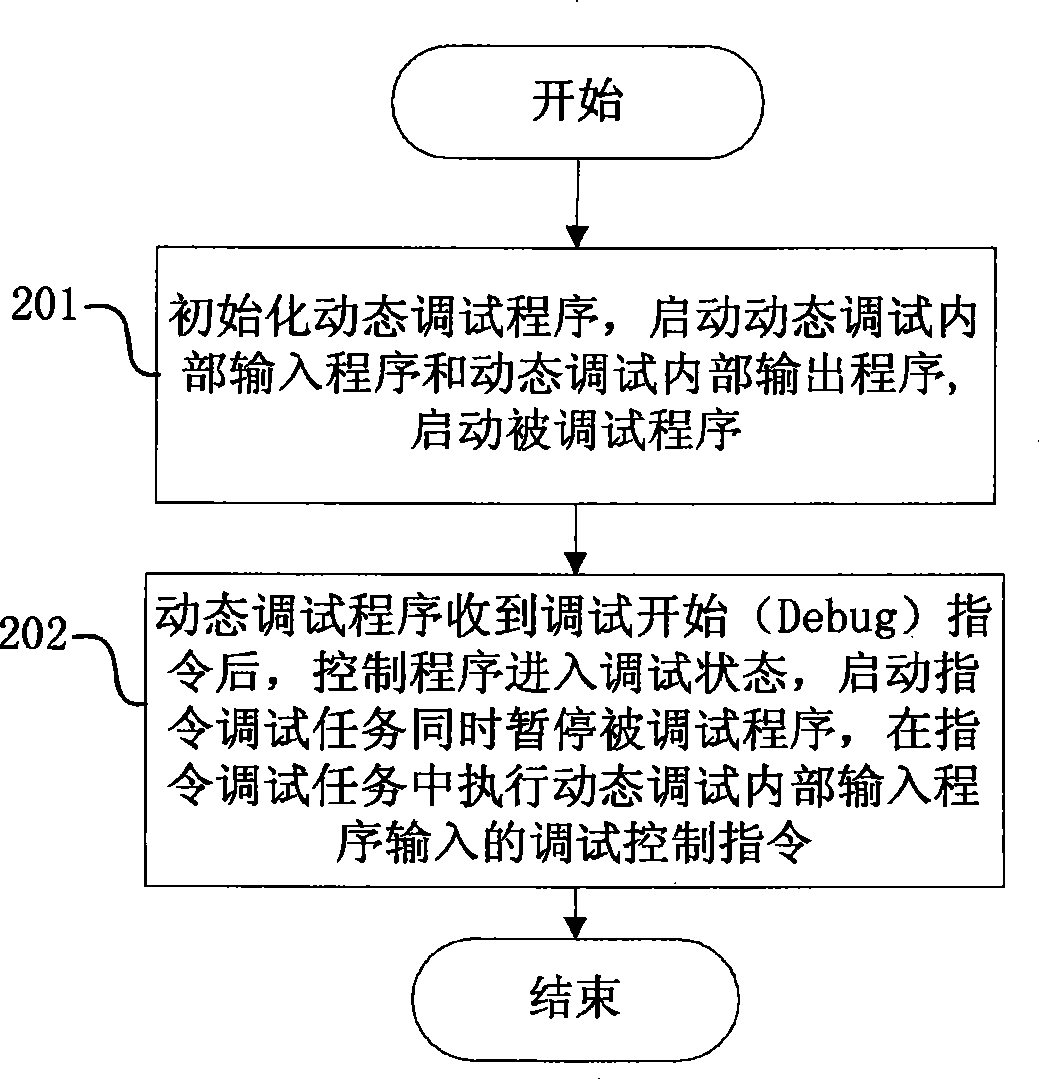
[0060] Step 1, the debugging input program uses the external ASCII code stream to input the debugging start (Debug) instruction to the internal module, and the internal input module debugging converts this instruction into an instruction recognizable by the dynamic debugging program and sends it to the dynamic debugging program, and the dynamic debugging program After receiving this command, start the highest priority task and suspend the running of the debugged program at the same time;

[0061] Step 2: Debug the input program and input the Step Over N instruction to the internal input module in the form of external ASCII code stream, and the internal input module debugs and converts this instruction into an instruction that can be recognized by the highest priority task Send it to th...

specific Embodiment 2

[0064] Embodiment 2: The method is described by taking setting a breakpoint as an example, wherein the command debugging task is the highest priority task of the system.

[0065] Step 1, the debugging input program uses the external ASCII code stream to input the debugging start (Debug) instruction to the internal module, and the internal input module debugging converts this instruction into an instruction recognizable by the dynamic debugging program and sends it to the dynamic debugging program, and the dynamic debugging program After receiving this command, suspend the running of the debugged program and start the highest priority task;

[0066] Step 2, Debugging The input program uses the external ASCII code stream to input the current position search (Search Position) debugging command to the internal input module, and the internal input module debugging converts this command into a command that can be recognized by the highest priority task and sends it to the highest pri...


PUM


Abstract

The present invention discloses a dynamic debugging method in the operating state of embedded software and a system thereof, wherein the dynamic debugging method comprises the following steps: inputting debugging for beginning to control instruction DEBUG in the operating state of embedded software, activating an instruction debugging task, pausing each operating task of debugged program, inputting debugging control instruction, and executing the debugging control instruction in the instruction debugging task. The dynamic debugging can be executed in the operating state of program with a special program debugger according to the method and the system according to the invention. The finding of software fault is facilitated, especially the occasional fault in program. Furthermore the system of the invention can be connected with the operating state of multi-task software in any field for directly debugging and tracking.

Description

technical field [0001] The invention relates to an embedded system, in particular to a dynamic debugging method and system under the running state of embedded software. Background technique [0002] At this stage, the most commonly used solution to software failures is that after a problem occurs in the software operation, first compile the debugging file, then load it into the system debugger, and finally run the debugger to set breakpoints for single-step tracking and debugging; such debugging methods mainly It is used to track some static program failures that inevitably occur. This method can be used to analyze and track conventional problems, but this method is absolutely useless for some occasional problems that appear in the project and need to meet certain conditions in the dynamic state. It is useless, because the occurrence of such problems often depends on the environment and the trigger conditions at that time. Such dynamic problems must be dynamically tracked du...

Claims


Application Information

Patent Timeline
IPC IPC(8): G06F11/36
Inventor 李凯航
Owner ZTE CORP
Why Eureka
Try Eureka