Method and system for statistical analysis of ethernet traffic

A traffic statistics, Ethernet technology, applied in the field of Ethernet traffic statistics and analysis, can solve the problems of reducing the sending and receiving flow, reducing the traffic rate, unable to accurately reflect the actual network traffic, etc., to achieve the effect of improving management and maintenance efficiency

Active Publication Date: 2010-06-09
ZTE CORP
View PDF0 Cites 8 Cited by
  • Summary
  • Abstract
  • Description
  • Claims
  • Application Information

AI Technical Summary

Problems solved by technology

[0005] However, the existing Ethernet traffic statistical analysis method can only analyze the traffic information of the node port, but cannot analyze the corresponding data of the link, and cannot accurately reflect the actual traffic of the network
For example, in image 3 In , the link between nodes S1 and S2 fails and is not completely disconnected. Data can still be transmitted, but there is a large amount of packet loss on the link. At this time, neither nodes S1 nor S2 can collect statistics on the link of packet loss
The traffic rate graph of port 12 of node S1, which is counted by traffic analysis node A, is as follows Figure 4 As shown, it can be observed that the traffic rate of port 12 of node S1 has decreased, but this decrease in traffic rate may also be caused by normal users reducing the flow of sending and receiving. The link corresponding to port 12 of S1 is faulty. Figure 4 Network abnormalities cannot be observed in the network, but in fact the connection between nodes S1 and S2 has failed

Method used


Image

  • Method and system for statistical analysis of ethernet traffic
  • Method and system for statistical analysis of ethernet traffic
  • Method and system for statistical analysis of ethernet traffic

Examples


Embodiment 1

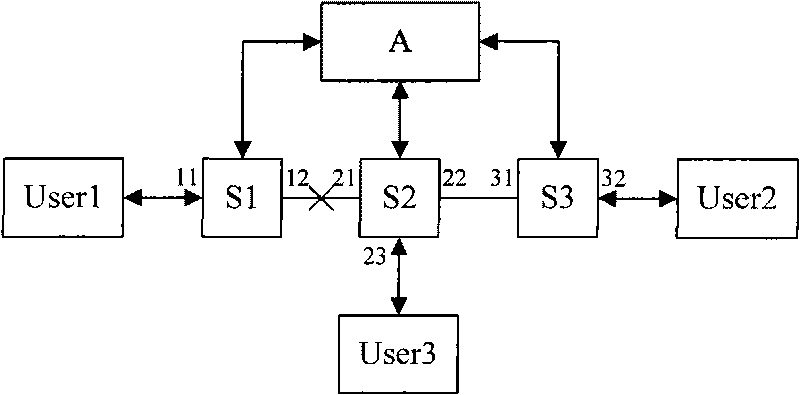
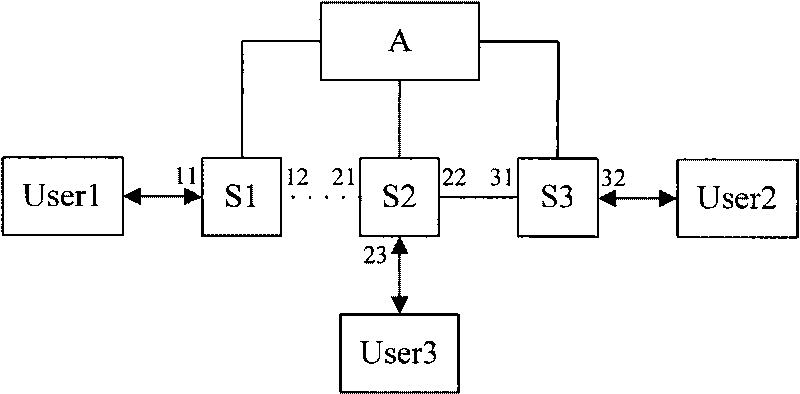
[0056] like image 3 As shown, the traffic analysis node is set as node A in Ethernet, and the traffic analyzed nodes are nodes S1, S2 and S3. The method for realizing statistical analysis of Ethernet traffic in this embodiment is as follows Figure 7 shown, including the following steps:

[0057] Step 701: Node A sends to S 1 ↔ S 2 , S 2 ↔ S 3 Nodes S1, S2, and S3 on the link send traffic collection request messages;

[0058] Step 702: After receiving the flow request message, the nodes S1, S2, and S3 respectively send flow report messages to report their respective port flow information;

[0059] The port flow information of the node S1 includes the sending and receiving packet counting information of the node S1 port 11 and the port 12; the port flow information of the node S2 includes the sending and receiving packet counting information of the node S2 port...

Embodiment 2

[0066] by Figure 9 For example, Figure 9 An Ethernet ring is shown. Ethernet ring network is a kind of Ethernet protection technology. Several nodes are connected to form a ring topology network. When all the links on the ring are intact, a ring port of a node on the ring is blocked to prevent the ring from being closed, and the traffic on the network is only The only transmission channel, node S1 blocks port 11, and the traffic transmission path is S 2 ↔ S 3 ; When the link on the ring fails, the adjacent node of the faulty link will block the port connected to the faulty link after detecting the fault, and notify other nodes to switch. When the link is restored, the blocked port will be opened, such as Figure 10 As shown, there is a fault between nodes S2 and S3, node S2 blocks port 22, node S3 blocks port 31, and notifies other nodes to switch, node S1 opens port 11.

[0067] In this network, node A is a fl...


PUM


Abstract

The invention discloses a method for the statistical analysis of ethernet traffic, which comprises the following steps that: a traffic node, according to part traffic information and reporting time intervals reported twice of two connected traffic-analyzed nodes of any one link, counts the passed packet traffic, the lost packet traffic and corresponding speed rates on the link; and an analysis chart is established according to the speed rate of the lost packet traffic counted each time. The invention simultaneously discloses a system for the statistical analysis of the ethernet traffic. Through a scheme of the invention, the statistical analysis can be performed on the traffic on the link in the ethernet, the current state of the link can be accurately and intuitively reflected, and when the link generates faults or loses packets, the positions of the faults can be positioned quickly in favor of improving the management and maintenance efficiencies.

Description

technical field [0001] The invention relates to flow statistics technology in data communication, in particular to a method and system for statistical analysis of Ethernet flow. Background technique [0002] With the development of the Ethernet network towards carrier-class multi-service bearing, especially some services have higher and higher requirements on the reliability and real-time performance of the network, the monitoring and management of Ethernet traffic is becoming more and more important. By analyzing the Ethernet traffic, you can know the traffic distribution of the Ethernet to achieve better network performance and services. When packet loss occurs in the Ethernet, you can quickly find the fault point and effectively analyze the fault process to achieve For fast fault location and business impact assessment purposes. [0003] In the prior art, usually a node counts information such as the count of sending and receiving packets, the count of lost packets, and ...

Claims


Application Information

Patent Timeline
Patent Type & Authority Applications(China)
IPC IPC(8): H04L12/24H04L12/26H04L1/00
CPCH04L41/142H04L41/26
Inventor 吴少勇
Owner ZTE CORP
Why Eureka
Try Eureka