Method for carrying out visualization on cluster analysis result

A cluster analysis and clustering technology, applied in special data processing applications, instruments, electronic digital data processing, etc., can solve the problem of lack of semantic information in visual representation, visual expression of information similarity relationship not involved, and cluster semantics not involved. Information visualization, etc.

Inactive Publication Date: 2010-10-13
DALIAN UNIV OF TECH
View PDF4 Cites 15 Cited by
  • Summary
  • Abstract
  • Description
  • Claims
  • Application Information

AI Technical Summary

Problems solved by technology

[0004] At present, the visualization of clustering analysis results mostly uses pie charts, columns, and navigational tree structure labels to express clustering analysis results, but these presentation forms often only reflect the relationship between classes in the clustering results. Quantitative relationship, proportional relationship of members in a class, and affiliation relationship, etc.
The clustering of structured data proposed by patent 200710142715.0 realizes the visual expression of the relationship between categories and class members, but cannot reflect the semantic relationship between class members; patent 200610001267.8 proposes a visualization method and equipment for enhancing search result navigation. to the visualization of clustering information, but it is mainly aimed at linking visual clustering information with search results, and does not involve the visualization of clustering semantic information; the visualization methods proposed in patents 200810108432.9 and 200710160532.1 are mainly aimed at the visualization of hierarchical information , does not involve the visual expression of the similarity relationship between the information itself; the article "Research on the Visualization of Clustering Results" published by Xu Xiangyan et al. proposed several visualization methods for clustering results, but there is a lack of semantic information in the visual representation
[0005] Due to the loss of the semantic information between the text and the text, this kind of visual representation method cannot further use the content information of the members to reflect the semantic relationship, which increases the difficulty of understanding the clustering analysis results, and it is also difficult to express more comprehensive information and hidden information. The complex knowledge structure contained in the data information

Method used


Image

  • Method for carrying out visualization on cluster analysis result
  • Method for carrying out visualization on cluster analysis result
  • Method for carrying out visualization on cluster analysis result

Examples


Embodiment Construction

[0075] Specific embodiments of the present invention will be described in detail below in conjunction with technical solutions and accompanying drawings.

[0076] Step 1: Build Topic Hierarchy Logic

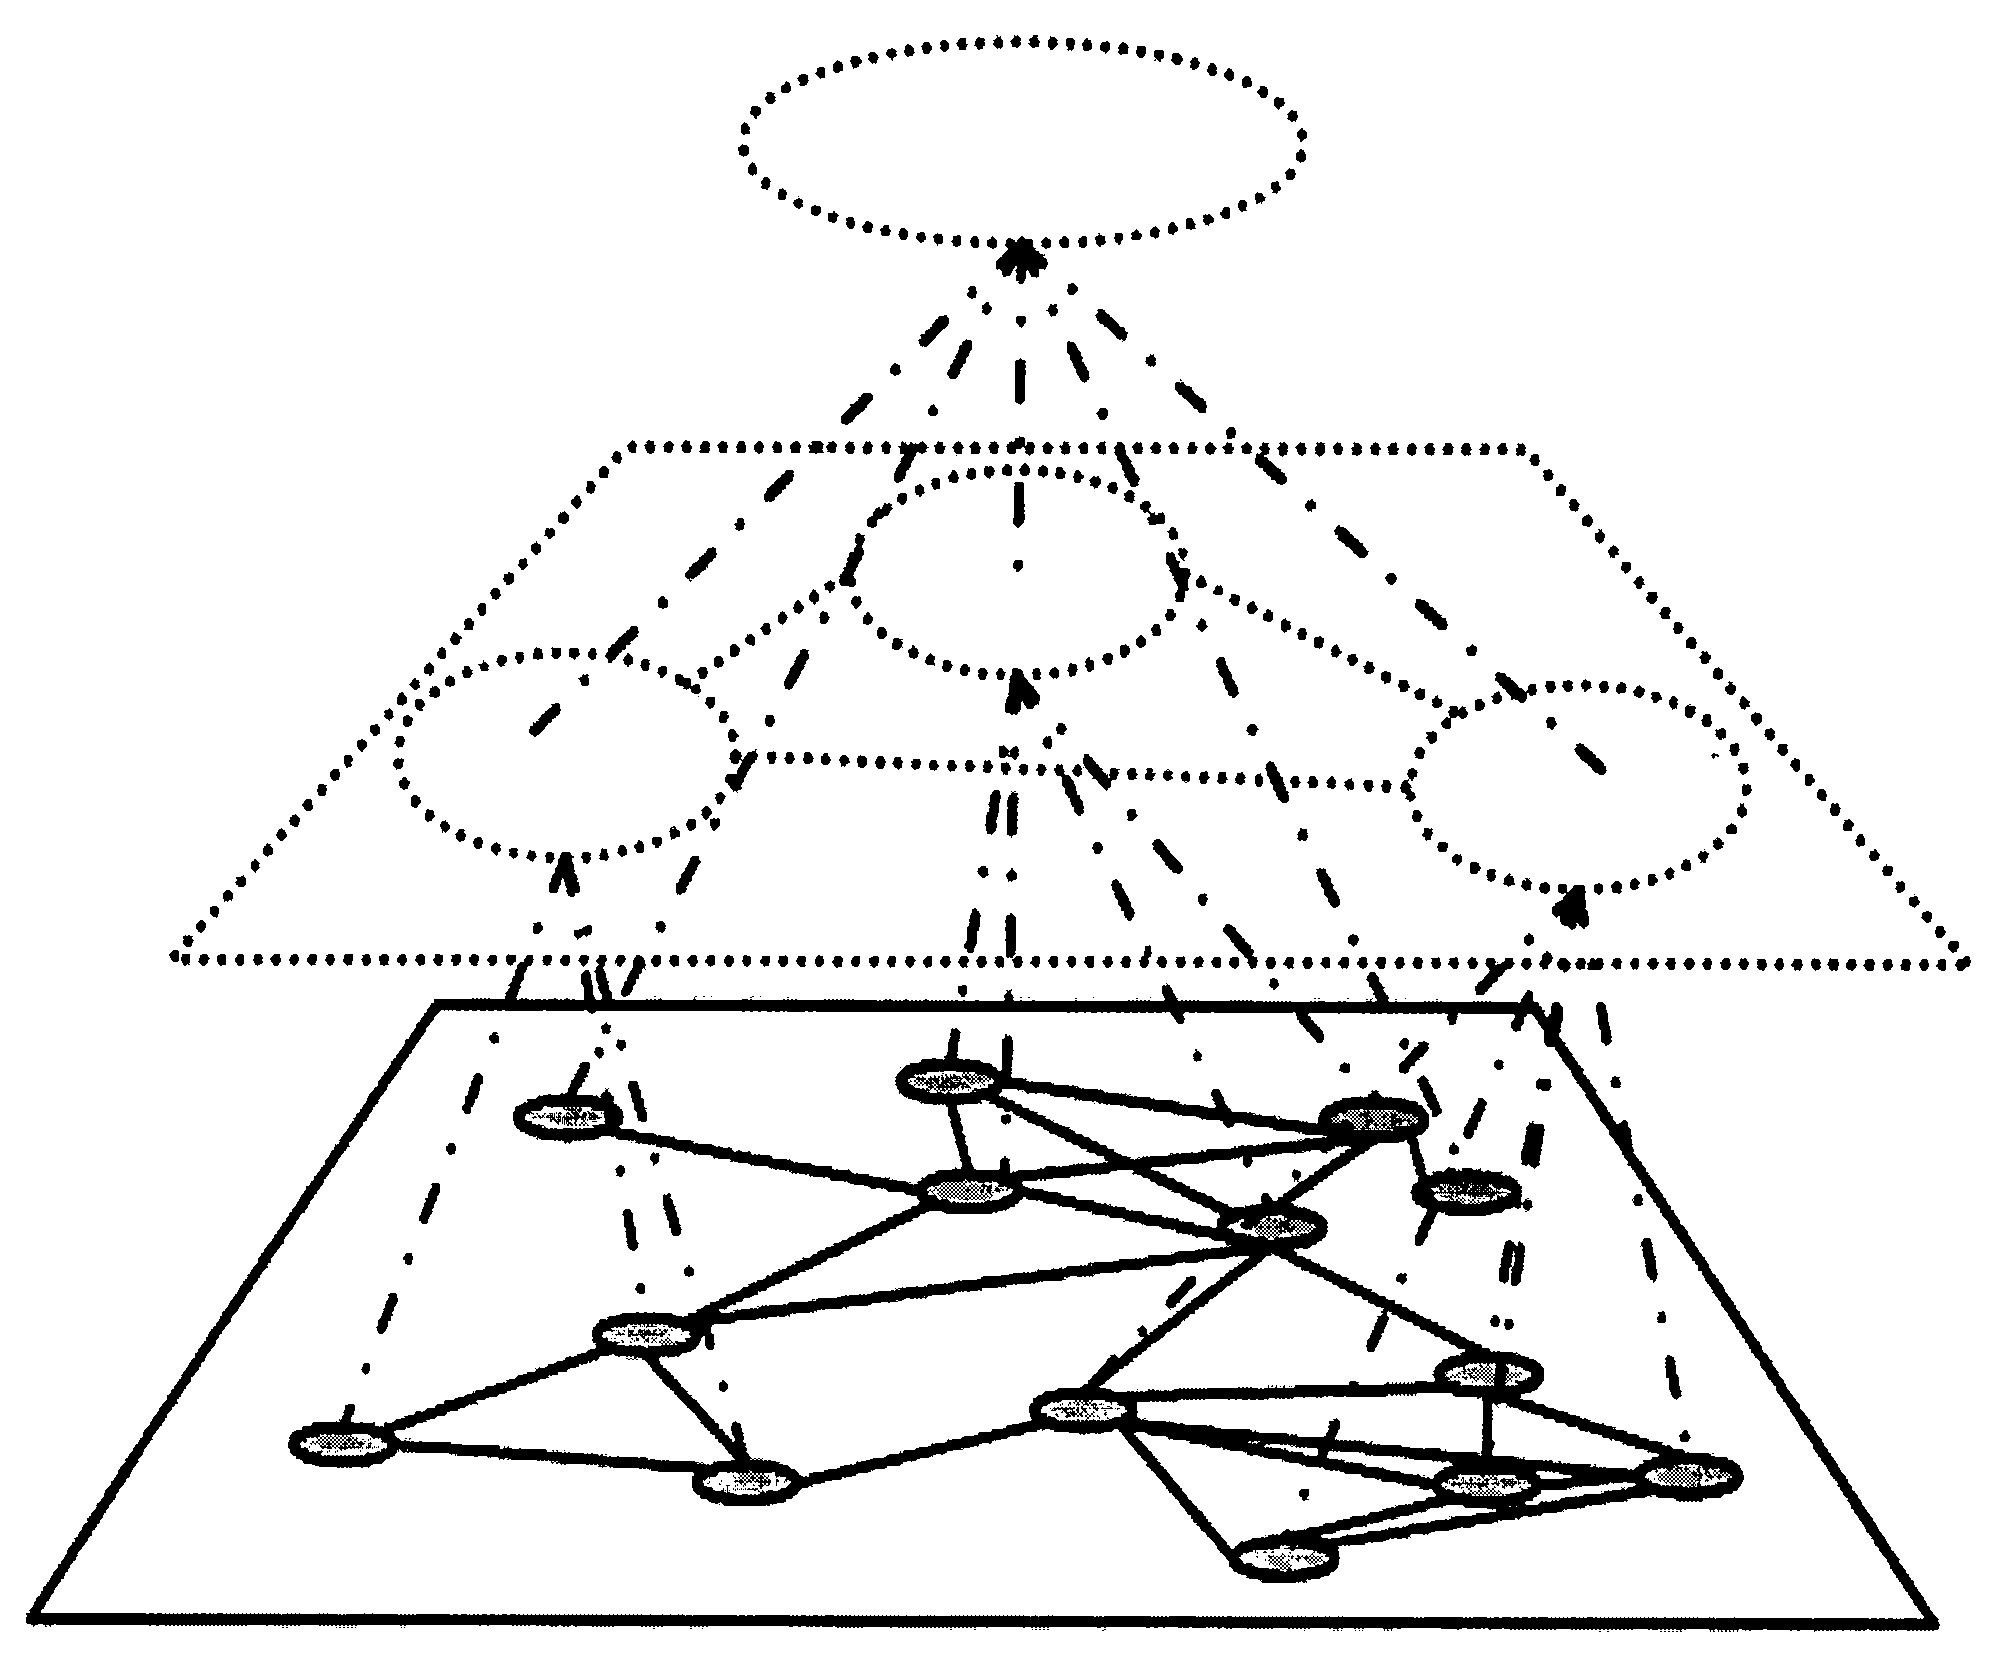
[0077] Apply the method of multi-layer literature organization model based on topic map to construct the topic hierarchy logic of cluster analysis results. (Such as figure 1 shown).

[0078] Step 2: Build the force model

[0079] According to the topic hierarchy logic in the cluster analysis results, the force model in it is analyzed and constructed.

[0080] 1) Spring force:

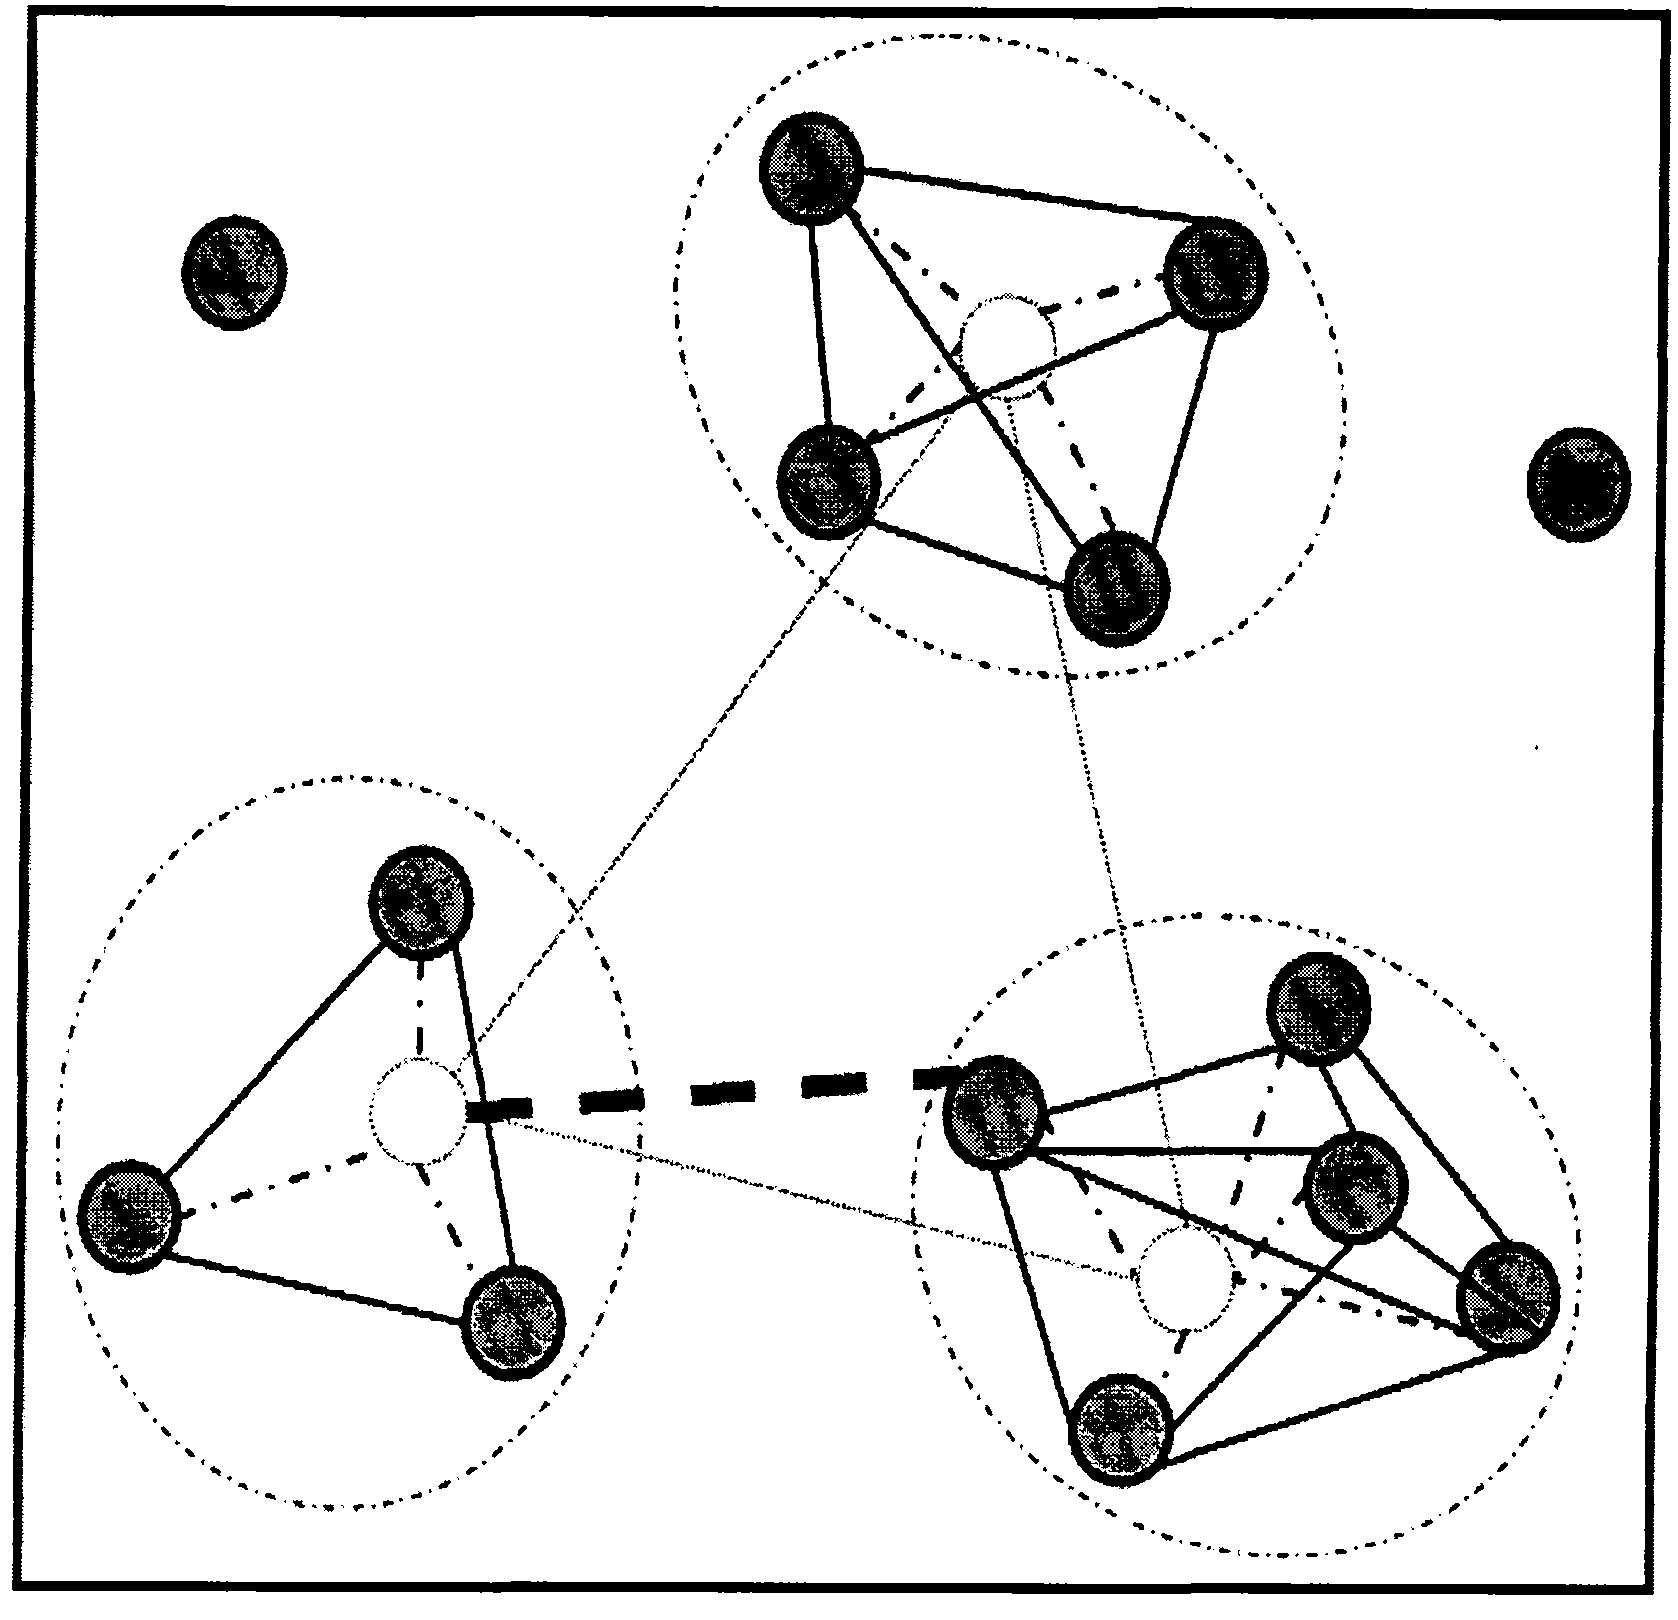
[0081] f s(1) : the force between class centroids in the same hierarchy, such as figure 2 shown by the dotted line in .

[0082] f s(2) : the force between the centroid and child nodes, such as figure 2 Indicated by the dotted line in .

[0083] f s(3) : the force between nodes in the same class, such as figure 2 shown by the solid line in .

[0084] f s(4) : The force between the node and...


PUM


Abstract

The invention relates to a method for carrying out visualization on a cluster analysis result, belonging to the technical field of computer information processing. The method comprises the following step of: automatically generating a visualized topic map with visual and hierarchical information by utilizing characteristics of a cluster analysis result and semantic similarity relations of data information objects according to an information design plane layout method among classes and class members and between the classes and the class members in the cluster analysis result as well as plane layout data. The visualized method can fully show the semantic similarity relations among the intra-class members in the cluster result and improve the expression visualization and comprehensibility of the cluster analysis result and is beneficial to discovering a new mode and new knowledge from the cluster analysis result.

Description

technical field [0001] The invention belongs to the technical field of computer information processing, and relates to a method for visualizing clustering analysis results. Background technique [0002] Cluster analysis is an important means of data mining and knowledge discovery. It can extract implicit, previously unknown, and potentially valuable information for decision-making from massive data sets. At present, the general process of clustering analysis on a large amount of data information is as follows: first, determine the range of data information to be clustered; then, select an appropriate clustering algorithm to perform clustering analysis on the data; finally , to present the cluster analysis results in an appropriate form. [0003] Using a visual method to represent the clustering results can make good use of people's intuitive understanding of the visual model and structure, and solve the problem of a large amount of information that cannot be communicated qu...

Claims


Application Information

Patent Timeline
Patent Type & Authority Applications(China)
IPC IPC(8): G06F17/30
Inventor 吴江宁王桂才马凤闸宣照国
Owner DALIAN UNIV OF TECH
Why Eureka
Try Eureka