Method for measuring small facula intensity distribution based on two-dimension subdivision method

A technology of intensity distribution and measurement method, which is applied in the field of measuring the intensity distribution of tiny light spots, can solve the problems of spot intensity distribution measurement, inability to distribute uneven energy, etc., and achieves the effect of a simple method.

Inactive Publication Date: 2010-12-08
HARBIN INST OF TECH
View PDF3 Cites 10 Cited by
  • Summary
  • Abstract
  • Description
  • Claims
  • Application Information

AI Technical Summary

Problems solved by technology

[0003] The purpose of the present invention is to solve the current problem that the intensity distribution of light spots with uneven energy distribution or small size cannot be measured, and a method for measuring the intensity distribution of small light spots based on the two-dimensional subdivision method is provided.

Method used


Image

  • Method for measuring small facula intensity distribution based on two-dimension subdivision method
  • Method for measuring small facula intensity distribution based on two-dimension subdivision method
  • Method for measuring small facula intensity distribution based on two-dimension subdivision method

Examples


specific Embodiment approach 1

[0017] Specific embodiment one: the tiny spot intensity distribution measurement method based on the two-dimensional subdivision method of the present embodiment is realized based on a spot measuring device, and the spot measuring device is composed of a two-dimensional moving frame 1, a CCD detector 2 and a data acquisition device. Composed of unit 3, the CCD detector 2 is installed on the two-dimensional mobile frame 1, and the electrical signal output end of the CCD detector 2 is connected to the signal input end of the data acquisition unit;

[0018] The specific process of the tiny spot intensity distribution measurement method based on the two-dimensional subdivision method is as follows:

[0019] Step 1. The incident light is incident on the photosensitive detection surface of the CCD detector 2, and the data acquisition unit 3 monitors and displays the grayscale image output by the CCD detector 2 in real time; adjusts the two-dimensional moving frame 1 to make the incid...

specific Embodiment approach 2

[0030] Specific implementation mode two: this implementation mode is a further description of implementation mode one, and the following process is also included in step one:

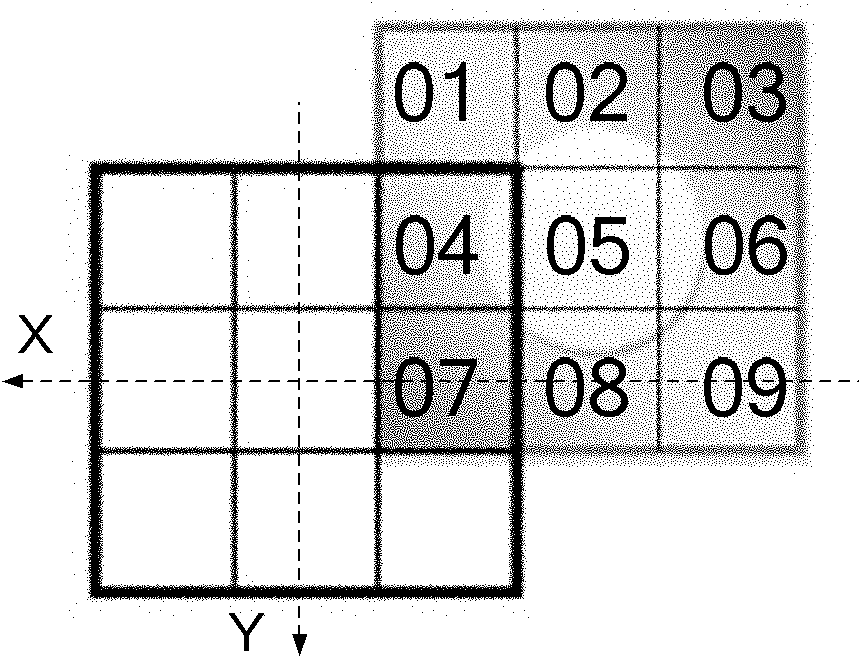
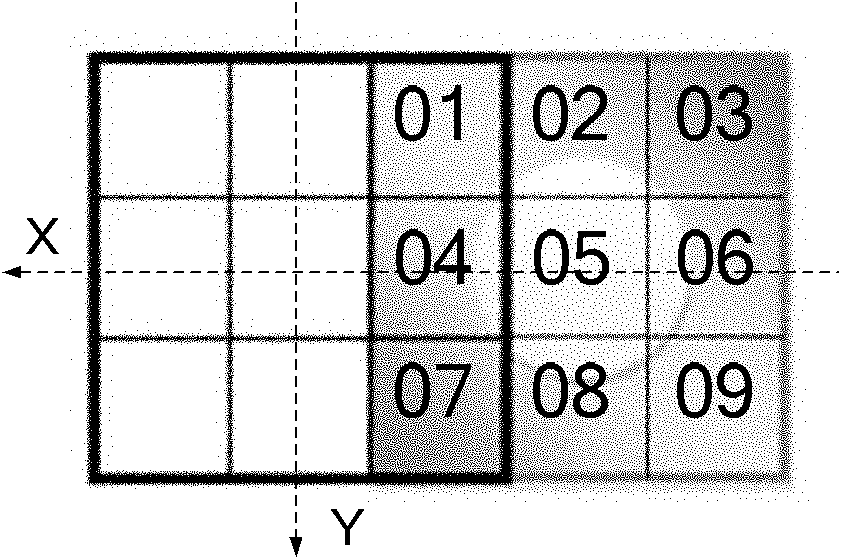
[0031] The photosensitive surface element is divided into M square small blocks along the X-Y direction, that is, the side length of each square small block is parallel to the X axis or the Y axis, and the side length of each small block is d 0 ,D 1 、D 2 Both are d 0 Integer multiples of , then the M square blocks form a matrix, and the number of rows of the matrix is ​​D 2 / d 0 , the number of columns of the matrix is ​​D 1 / d 0 , let Q(i, j) represent the square block in the i-th row and j-th column, where i=1, 2,..., D 2 / d 0 , j=1,2,...,D 1 / d 0 ; at P 0 position, the gray value measured by the Q(i, j) small block is recorded as Z(i, j).

specific Embodiment approach 3

[0032] Specific implementation mode three: this implementation mode is a further description of implementation mode two, and the specific process of the content described in step eight is:

[0033] According to all the recorded positions and the grayscale images corresponding to each position, the calculation at P 0 The gray value Z(i, j) of each small block Q(i, j) at the position, i=1, 2,..., D 2 / d 0 , j=1,2,...,D 1 / d 0 ; By calibrating the CCD detector 2, the relationship between the gray value and the light intensity measured by the CCD detector 2 is obtained; combined with the obtained P 0 The intensity distribution of the entire spot can be obtained by the gray value Z(i, j) of each small block Q(i, j) at the position.

[0034] Below is a specific embodiment of the application of the present invention:

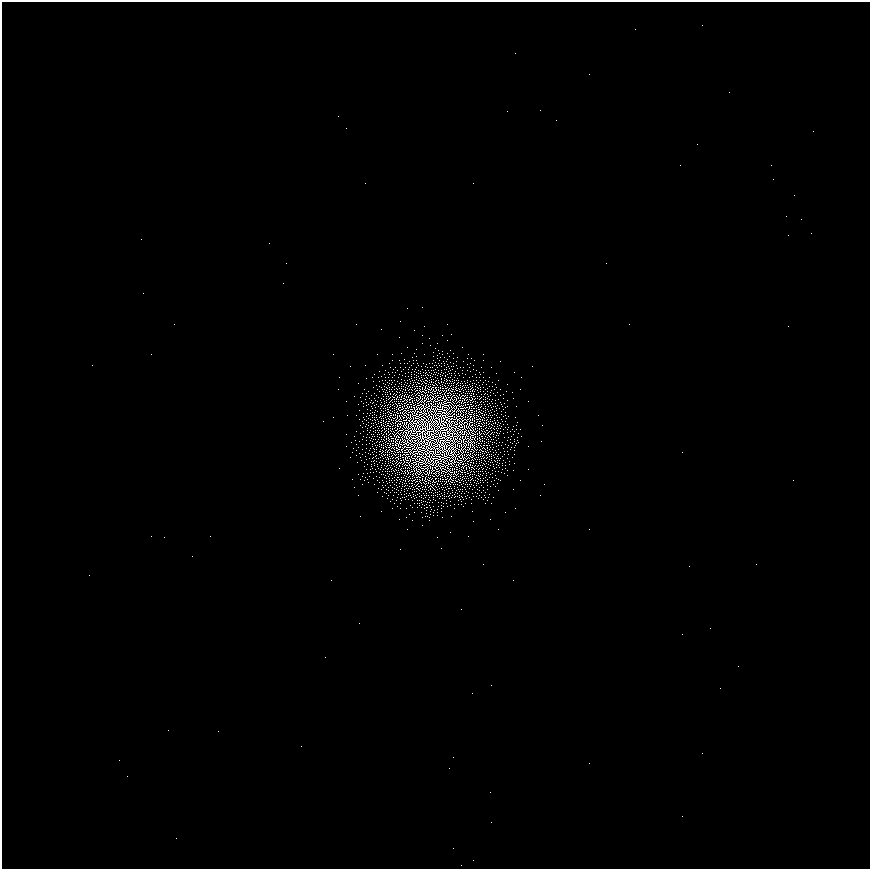
[0035] Using computer simulation to obtain a low-noise Gaussian distribution of the original spot, see Figure 12 , using the measurement method of the present i...


PUM


Abstract

The invention provides a method for measuring small facula intensity distribution base on a two-dimension subdivision method, relating to a method for measuring the small facula intensity distribution, solving the problem that the intensity distribution measurement can not be carried out on the small facula with nonuniform energy distribution or extremely small size currently. The measuring method completely irradiates the incident facula on an image element of the photosensitive detecting surface of a CCD detector, records gray level images in various scanning states in a snakelike scanning mode, and obtains the intensity distribution of the incident facula finally through calculation. The invention can carry out direct measurement on the facula with nonuniform energy distribution or extremely small size, and is suitable for the filed of tiny facula measuring.

Description

technical field [0001] The invention relates to a method for measuring the intensity distribution of tiny light spots. Background technique [0002] The spot intensity distribution is one of the important parameters of the laser system. The existing spot intensity distribution measurement techniques can be mainly divided into the following categories: knife-edge scanning method, slit scanning method, iris method, and CCD camera method. However, in many laser application fields such as laser processing and material processing, it is necessary to focus the beam before proceeding to the next step. In this case, due to the extremely small spot size or uneven energy distribution, these methods often cannot correct the spot. direct measurement of the intensity distribution. Contents of the invention [0003] The purpose of the present invention is to solve the current problem that the intensity distribution of light spots with uneven energy distribution or small size cannot be ...

Claims


Application Information

Patent Timeline
Patent Type & Authority Applications(China)
IPC IPC(8): G01J1/42G01J1/04
Inventor 吕志伟王新刘晓妍姜振华巴德欣
Owner HARBIN INST OF TECH
Why Eureka
Try Eureka