Network visualization processing method and device

A processing method and technology of processing equipment, applied in the field of computer networks, can solve the problems of lack of automation in analysis, less added value in analysis, etc., and achieve the effects of reducing comprehension overhead, facilitating analysis, and good view resolution

Inactive Publication Date: 2011-10-05
INT BUSINESS MASCH CORP
View PDF4 Cites 8 Cited by
  • Summary
  • Abstract
  • Description
  • Claims
  • Application Information

AI Technical Summary

Problems solved by technology

However, in this method, the analysis still lacks automation, and the search time and topological structure are manually compared by the user to discover
The visualization here is only as a representation method, which has little added value for analysis
Additionally, multiple displays confine the network graph to a small window at each time, creating a greater comprehension overhead for the user

Method used


Image

  • Network visualization processing method and device
  • Network visualization processing method and device
  • Network visualization processing method and device

Examples


Embodiment Construction

[0028] Hereinafter, the network visualization processing method and device provided by the present invention will be described in detail through embodiments with reference to the accompanying drawings.

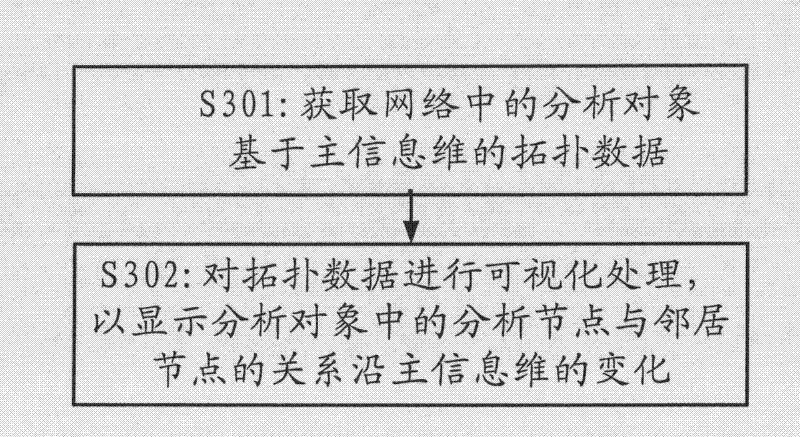
[0029] image 3 A flow chart of a network visualization processing method according to an embodiment of the present invention is shown. As shown, the method includes the following steps:

[0030] In step S301, the analysis object in the network is acquired based on the topology data of the main information dimension. The network in the present invention may be a social network or a computer / telecommunication network. The analysis object is the network centered on the analysis node set. Wherein, the set of analysis nodes may include one or more analysis nodes. The analysis node is the node that the user tries to analyze in a specific aspect, for example, the user analyzes the evolution of the node he is interested in in a certain dimension. The main information may include...


PUM


Abstract

The invention provides a network visualization processing method and device. The network visualization processing method comprises the following steps of: obtaining topological data of an analysis object in a network on the basis of a main information dimension, and carrying out visualization processing on the topological data of the analysis object on the basis of the main information dimension to display changes of a relation between analysis nodes and adjacent nodes in the analysis object along the main information dimension. By using the network visualization processing method and device provided by the invention, the dynamic changes of the network on the basis of the main information dimension can be displayed in a single view, and a better view resolution ratio can be provided, so that a user can analyze the network and the understanding cost of the user is reduced.

Description

technical field [0001] The invention relates to the technical field of computer networks, and more particularly to a network visualization processing method and equipment. Background technique [0002] Dynamic network visualization is an effective method for spatiotemporal analysis in several scenarios such as information networks, cognitive / social networks, and communication networks. In addition to showing the static relationships of the network at each specific time, dynamic network visualizations also show the significant temporal evolution of entities and relationships within the network. Solutions to the visualization of known dynamic networks generally fall into two categories. One is to "draw" the network and show the network as a movie, balancing stability and the aesthetics of a time-evolving network diagram to describe the network in detail. figure 1 A schematic diagram of a dynamic network visualization method according to the prior art is shown. However, it i...

Claims


Application Information

Patent Timeline
Patent Type & Authority Applications(China)
IPC IPC(8): H04L12/24G06F17/50G06T3/00
CPCG06F17/509H04L41/12H04L41/22G06F30/18G06F16/285
Inventor 时磊王晨刘世霞英春
Owner INT BUSINESS MASCH CORP
Why Eureka
Try Eureka