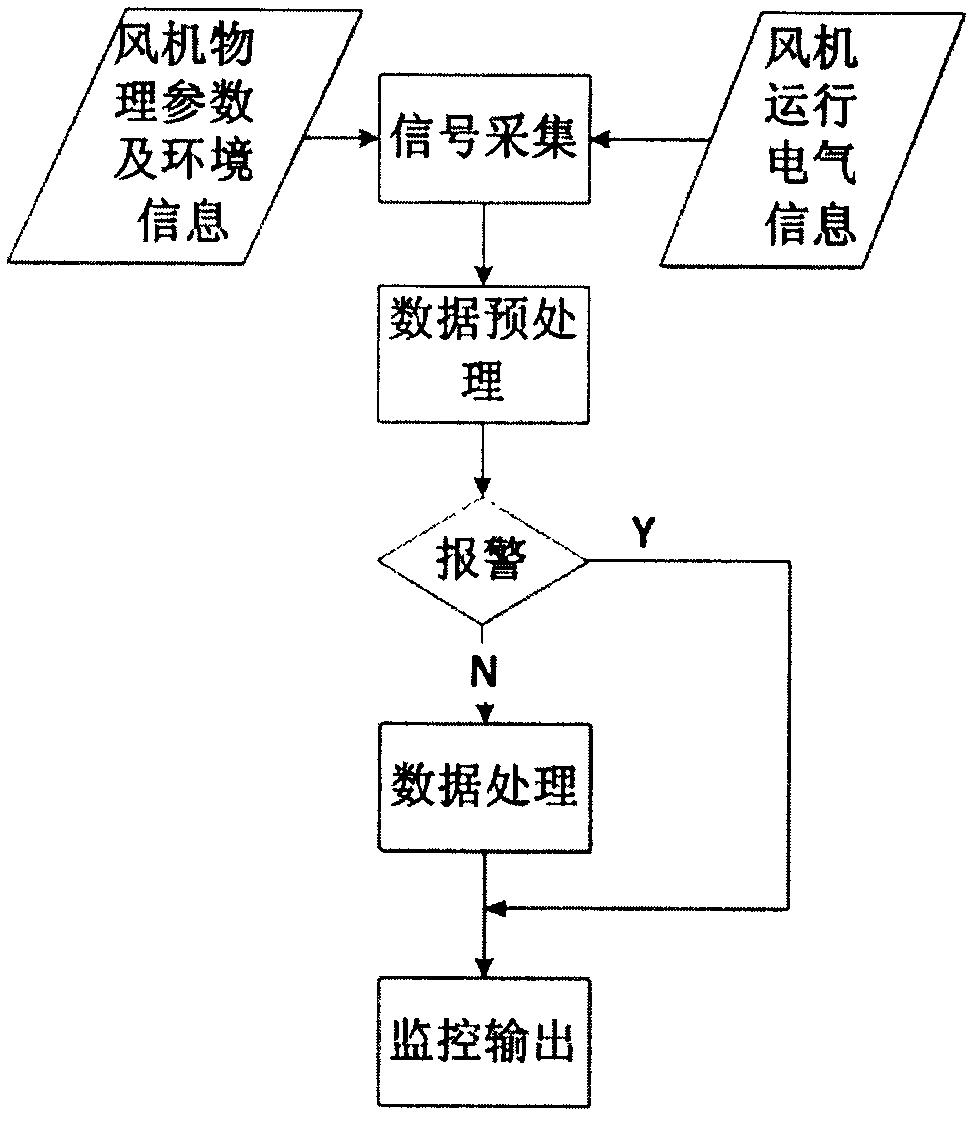
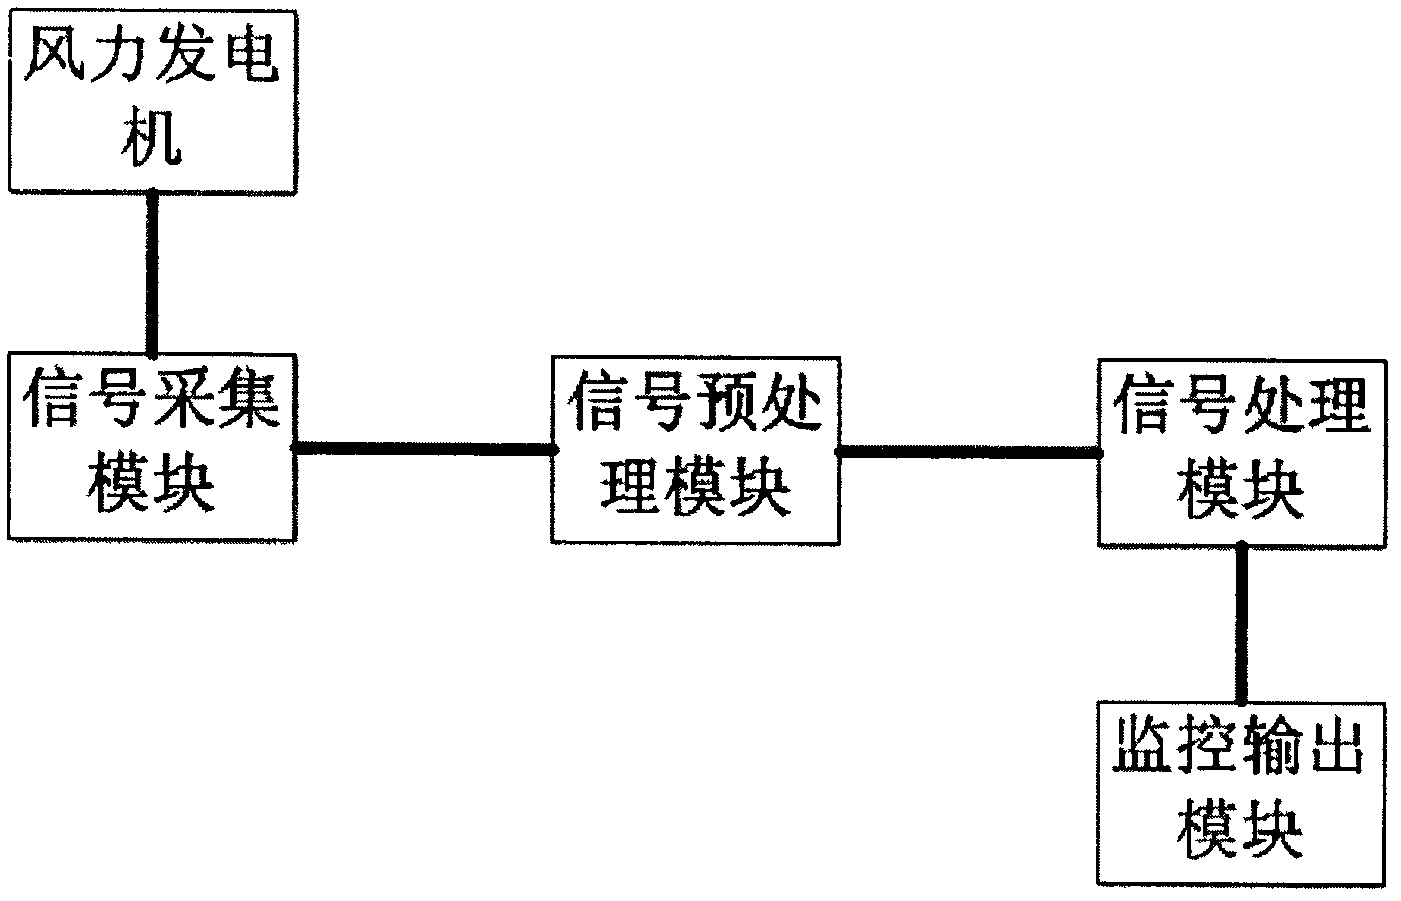
Monitoring system based on electric information for health status of wind driven generator and monitoring method thereof
A technology for wind turbines and health status, which can be applied to wind turbine components, wind engines, engines, etc., and can solve the problems of large investment and high technical requirements
- Summary
- Abstract
- Description
- Claims
- Application Information
AI Technical Summary
Problems solved by technology
Method used
Image
Examples
Embodiment 1
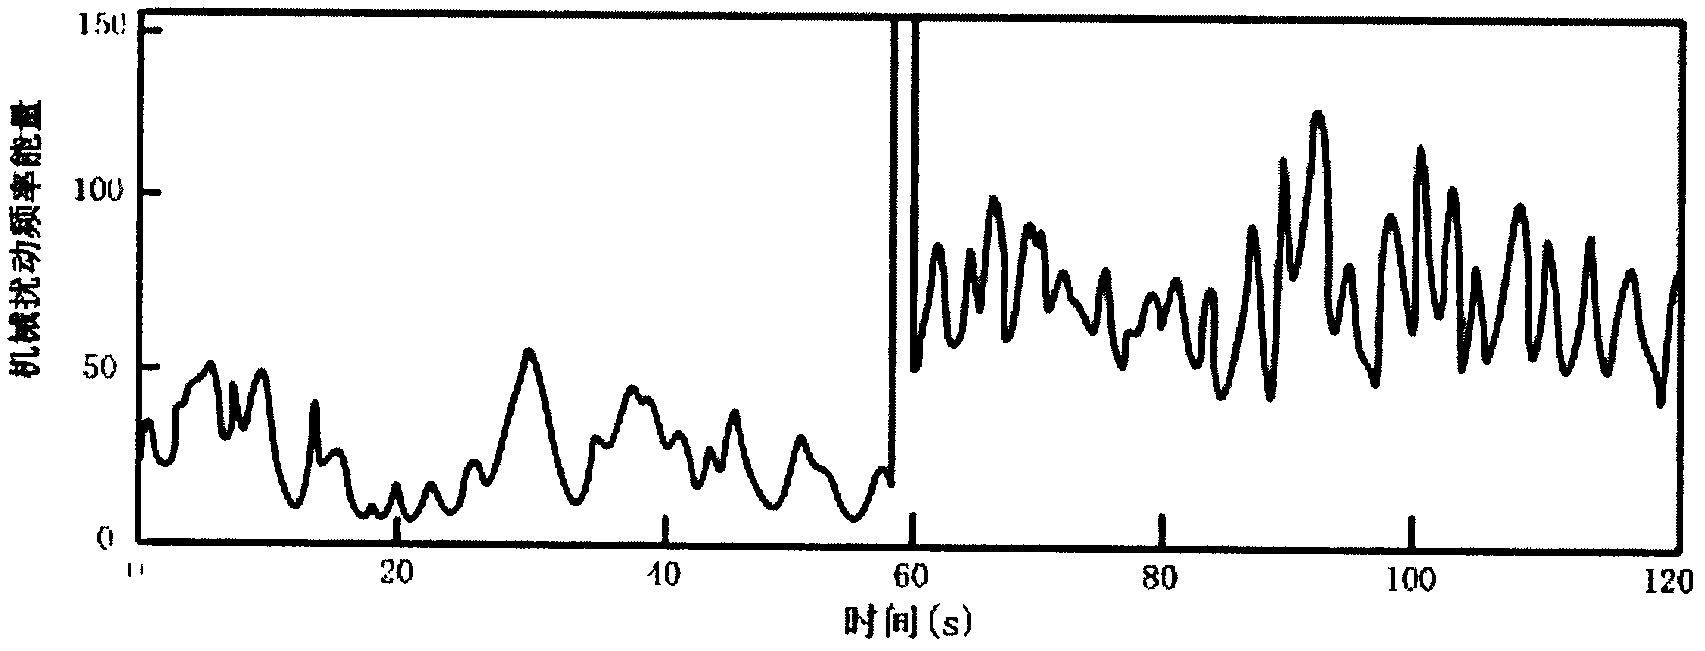
[0079] One 10kW wind turbine, the simulated wind speed is 10 m / s, and the deviation threshold between the expected power generation and the actual power generation is set at 10%. A mechanical disturbance or failure is simulated by attaching a certain mass object to the rotor, specifically: normal operation at 0-60 seconds, starting at 61 seconds, adding a 1kg addition (about 0.3% to the 290.7kg rotor, causing The balance quality grade is G7.8, which is less than the low-speed fan drive shaft balance grade G16 specified in ISO1940-1:2003) for 60 seconds. Collect system electrical information according to step 1) of the above method. 2) After preprocessing, the deviation between the expected power generation and the actual power generation is 5.1% image 3 shown. The ordinate represents the spectral energy of the signal after mechanical perturbation. Depend on image 3 It can be clearly seen that the mechanical disturbance can be easily detected.
Embodiment 2
[0081] One 30kW wind turbine, the simulated wind speed is 10 m / s, and the deviation threshold between the expected power generation and the actual power generation is set at 10%. Simulate electrical disturbances or faults by changing its phase-to-phase resistance, specifically: normal operation in 0-60 seconds; change a certain phase-to-phase resistance by 4% in 60-120 seconds; normal operation in 120-180 seconds; 180-240 seconds, change the resistance of a certain phase by 9%; run normally in 240-300 seconds. According to the method step 1) of the present invention, electrical information of the system is collected. 2) After preprocessing, the deviation between the expected generated power and the actual generated power is 4.3% Figure 4 , 5 shown. Figure 4 The ordinate represents the disturbance-related frequency after the electrical disturbance, Figure 5 The ordinate represents the spectral energy of the signal after electrical perturbation. Depend on Figure 4 , 5 I...
PUM
 Abstract
Description
Claims
Application Information
 - R&D
- Intellectual Property
- Life Sciences
- Materials
- Tech Scout
- Unparalleled Data Quality
- Higher Quality Content
- 60% Fewer Hallucinations
Browse by: Latest US Patents, China's latest patents, Technical Efficacy Thesaurus, Application Domain, Technology Topic, Popular Technical Reports.
© 2025 PatSnap. All rights reserved.Legal|Privacy policy|Modern Slavery Act Transparency Statement|Sitemap|About US| Contact US: help@patsnap.com


