Chromatogram display method, data processing device, analysis device, and display program
A display method and chromatogram technology, applied in the field of display chromatogram, can solve problems such as importance deviation, redundant chromatogram, slowness, etc., and achieve the effect of improving visibility
- Summary
- Abstract
- Description
- Claims
- Application Information
AI Technical Summary
Problems solved by technology
Method used
Image

Examples
no. 1 Embodiment approach )
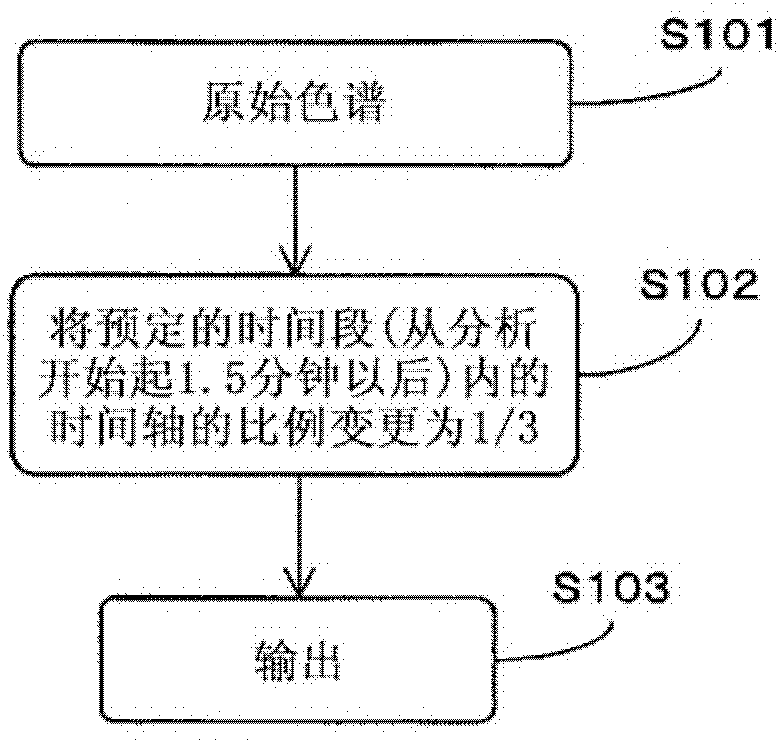
[0050] figure 1 It is a flowchart showing the chromatogram display method in the first embodiment. The first embodiment is an example in which the proportion of the time axis in the time zone after 1.5 minutes from the start of the analysis is changed to 1 / 3.
[0051] use figure 1 The flow chart of FIG. 1 will describe the chromatogram display method in the first embodiment. First, a chromatogram (hereinafter also referred to as "raw chromatogram") is generated from the obtained analysis data (S101). In the obtained original chromatogram, the ratio of the time axis within a predetermined period of time is changed ( S102 ), and the chromatogram in which the ratio of the time axis is partially changed is output ( S103 ). The time period for changing the ratio is not particularly limited, and examples thereof include a time period including a broad peak, which is a peak with a wide half width, and a time period in the second half of the measurement. The output of the chromato...
no. 2 Embodiment approach )
[0054] The second embodiment is an example of a case where a peak is detected from a chromatogram generated from the analysis data, whether or not a detected peak has any component is judged, and the ratio of the time axis is changed based on the judgment result.
[0055] image 3 is a flowchart showing the chromatogram display method in the second embodiment, Figure 4 is an example of the configuration of an analysis device used in the chromatogram display method in the second embodiment, Figure 5 It is a functional block diagram showing a configuration example of the chromatogram generating unit and an example of data recorded in the recording unit.
[0056] Figure 4 The analysis device 400 shown is an analysis device using a separation analysis method, which separates components contained in a sample and displays a chromatogram based on the obtained analysis data. The analysis device 400 has a measurement unit 1 , a chromatogram generation unit 2 , a display unit 3 , ...
no. 3 Embodiment approach )
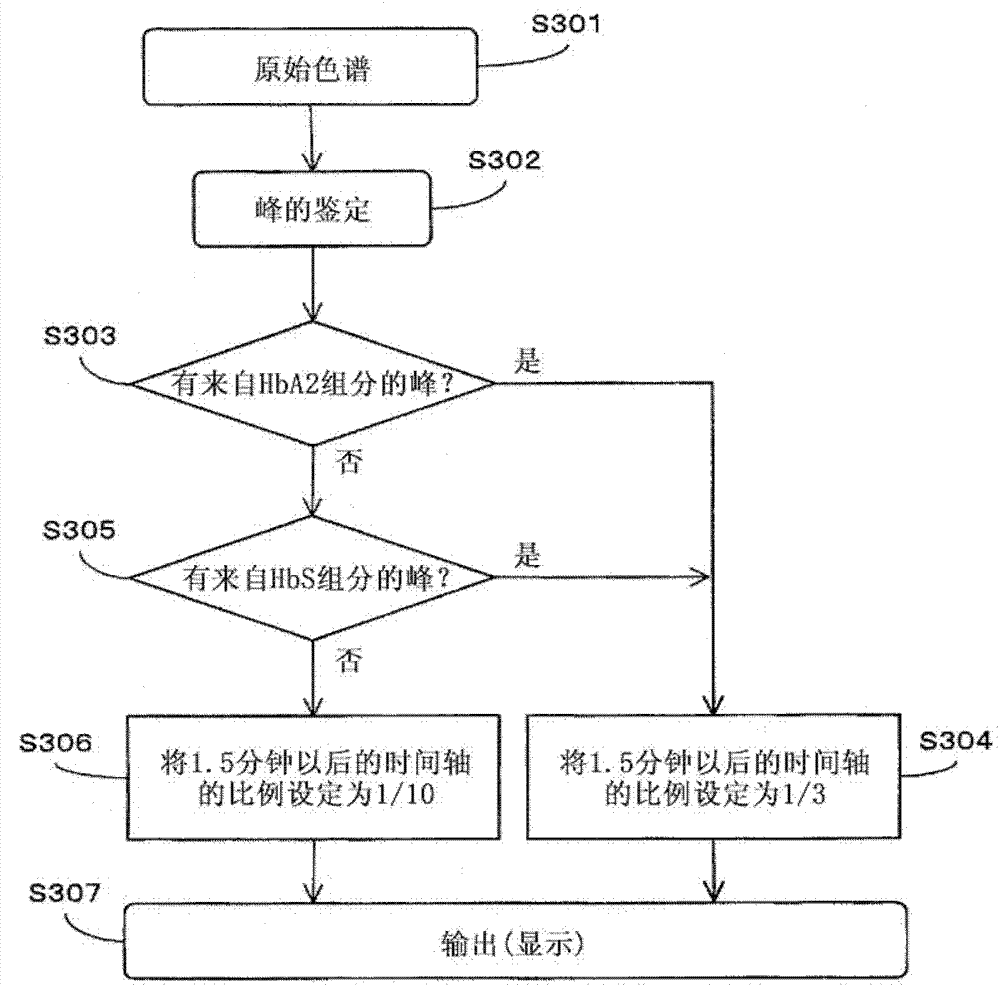
[0071] The third embodiment is an example of a case where a peak is detected from the chromatogram generated based on the analysis data, it is judged whether there is any component in the detected peak, the ratio of the time axis is changed based on the judgment result, and the time axis is changed according to the time The scale of the axis is corrected for the output value of the intensity axis within the period after the scale is changed.
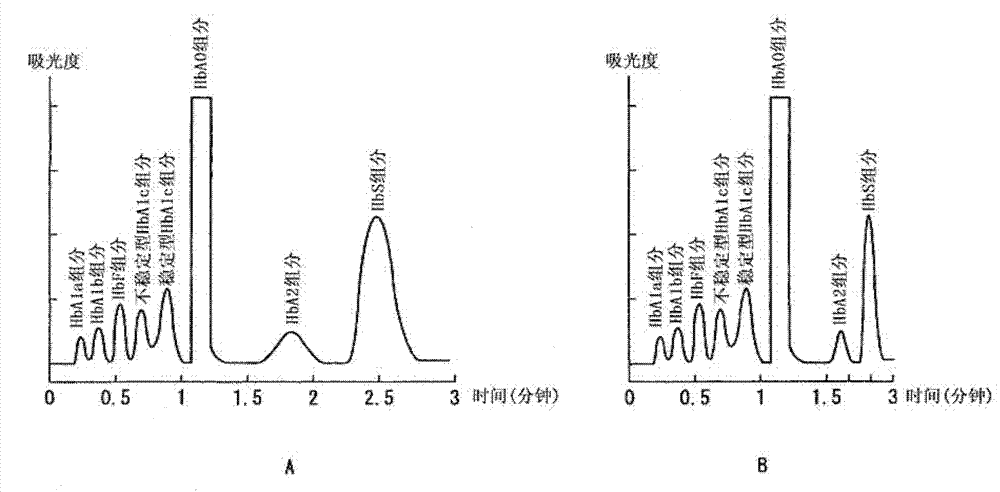
[0072] Figure 9 It is a flowchart showing the chromatogram display method in the third embodiment. exist Figure 9 Among them, S901 to S907 may be the same as those described in the second embodiment image 3 S301 to S307 are the same. Hereinafter, differences from the second embodiment will be mainly described. exist Figure 9 In the flow chart of , as an example, a case where the sample is blood, the object to be measured is hemoglobin, and the arbitrary components are HbA2 and HbS will be described.
[0073] Chromatography gene...
PUM
 Abstract
Description
Claims
Application Information
 - R&D
- Intellectual Property
- Life Sciences
- Materials
- Tech Scout
- Unparalleled Data Quality
- Higher Quality Content
- 60% Fewer Hallucinations
Browse by: Latest US Patents, China's latest patents, Technical Efficacy Thesaurus, Application Domain, Technology Topic, Popular Technical Reports.
© 2025 PatSnap. All rights reserved.Legal|Privacy policy|Modern Slavery Act Transparency Statement|Sitemap|About US| Contact US: help@patsnap.com