Data visualization design and view systems and methods

A data and design technology, applied in the field of data visualization, that can solve problems such as declarative models and methods that do not provide the definition and use of 3D data visualization

Inactive Publication Date: 2012-10-03
MICROSOFT TECH LICENSING LLC
View PDF3 Cites 19 Cited by
  • Summary
  • Abstract
  • Description
  • Claims
  • Application Information

AI Technical Summary

Problems solved by technology

However, current 3D visualization models do not provide declarative models and methods for defining and using 3D data visualization driven by data metrics

Method used


Image

  • Data visualization design and view systems and methods
  • Data visualization design and view systems and methods
  • Data visualization design and view systems and methods

Examples


Embodiment Construction

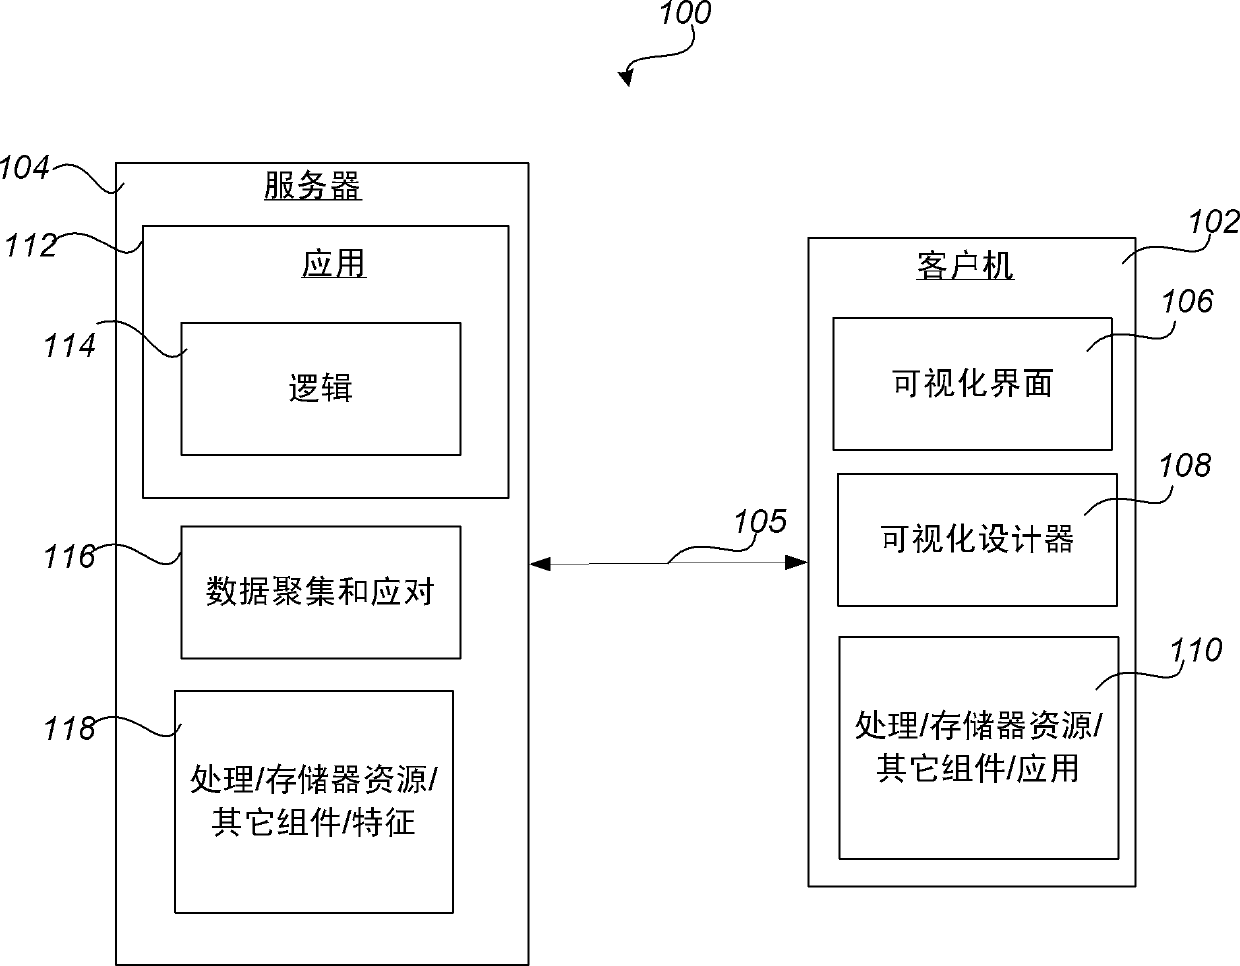
[0016] figure 1 is a block diagram of an exemplary system 100 that includes data processing, video processing, memory, and / or other components that provide data visualization features and functionality, but embodiments are not limited thereto. As described below, the components of system 100 can be used to provide interactive three-dimensional (3D) data visualization for various end uses, including providing interactive visualization scenarios for analysis of complex data sets. For example, components of the system 100 can be used to provide interactive visualizations for analyzing different types of data by providing additional interactive controls and visual effects to gain further insight using different data perspectives to identify data outliers , actionable items, and / or other relevant visual events.

[0017] In one embodiment, the components of the system 100 provide functionality as part of defining and using a declarative model for 3D data visualization in which the ...


PUM


Abstract

Interactive data visualization features are provided, including three-dimensional (3D) visualization features and functionality, but the embodiments are not so limited. An exemplary method includes a declarative process of defining and using 3D data visualizations where visual appearance, states, and/or interaction options are based in part on an associated visualization model and/or measures of data. An exemplary computing architecture includes a number of components configured to provide declarative visualization design, interaction, and/or viewing features. Other embodiments are included and available.

Description

technical field [0001] The present invention relates to data visualization. Background technique [0002] Important business decisions often revolve around the understanding of complex data sets within the context of a business goal. For example, a company may use database and spreadsheet applications to track profitable and non-profit assets over a particular calendar year using multidimensional sets of data, which may include partner data, customer data, or other information. As one example, a user may use a charting application to view projected data trends in an attempt to understand the highly complex nature of the enormous number of values ​​to be tracked or charted. However, many available applications are limited to preset interface control types, limited graphical options, and static user interaction features. [0003] The concept of business data-driven visual states and interactions is extensively explored for constrained two-dimensional (2D) visualization space...

Claims


Application Information

Patent Timeline
Patent Type & Authority Applications(China)
IPC IPC(8): G06F17/30G06T17/00
CPCG06T19/00G06T11/206
Inventor C·O·阿贝恩
Owner MICROSOFT TECH LICENSING LLC
Why Eureka
Try Eureka