Method, system and device to ensure statistical power for average pre and post-prandial glucose difference messaging
A technology of glucose concentration and difference, applied in blood characterization devices, healthcare informatics, computer-aided drug prescription/delivery, etc., can solve problems such as time-consuming, complex, and complicated evaluation
- Summary
- Abstract
- Description
- Claims
- Application Information
AI Technical Summary
Problems solved by technology
Method used
Image
Examples
example 1
[0107] In an exemplary embodiment, use of a specified power of 80% (a standard level generally sufficient for use) provides a value of β = 1 - 80 / 100 = 0.2, which yields z from a suitable standard statistical table or function β= value of 0.8416. Furthermore, for a 100α% one-tailed test, with α=5% (i.e. 5% significance), z is also obtained from the statistical table α / 2 = 1.6449. Thus, according to the formula shown above for "K", this example provides a constant value,
[0108] K=(0.8416+1.6449) 2 =2.4865 2 =6.186 Formula 2
[0109] The sample size "m" for the statistical test may thus be at least:
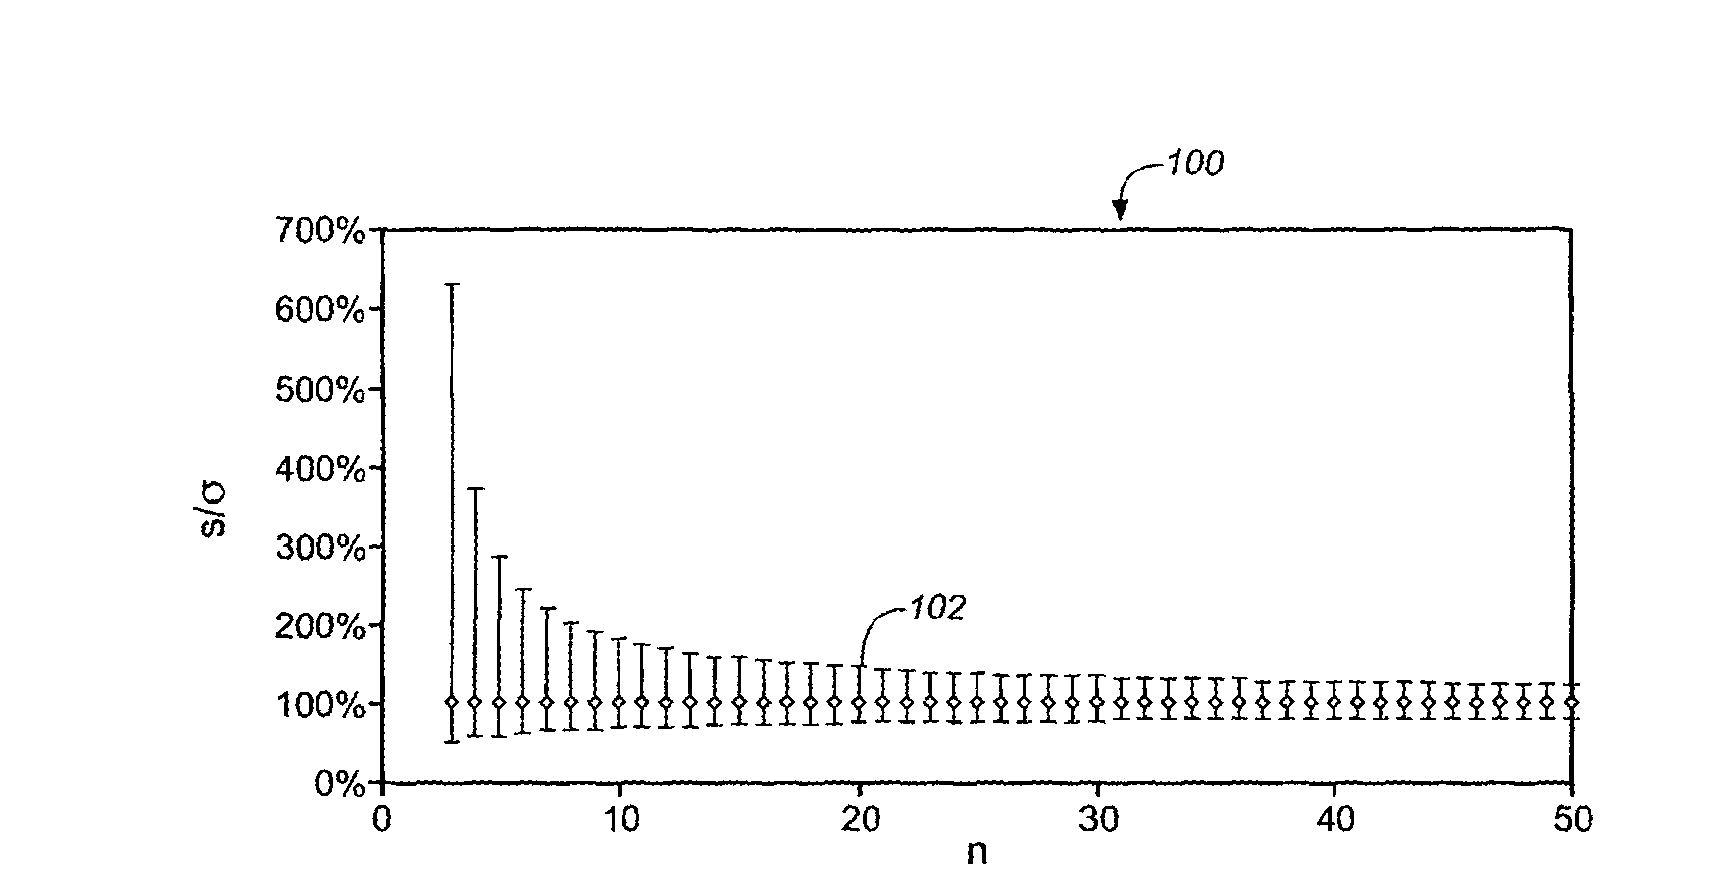
[0110] m = K ( σ Δ ) 2 ≈ K ( s Δ ) 2 Formula 3
[0111] Generally, this is not an integer,...
example 2
[0146] As illustrated in Table 2, pre-meal and post-meal blood glucose measurements (in mg / dl) were collected from users over a twenty-day period. The columns "Day", "Pre" and "Post" in the main part of the table list the day, table pre-meal and post-meal measurements respectively.
[0147] Table 2
[0148]
[0149] The calculations used to determine whether the mean difference between pre-meal and post-meal glucose measurements are significant on a given day are described below. If there is a significant mean difference between pre-meal and post-meal glucose measurements, then if Figure 5 As illustrated in , the indication may be displayed on a screen of the glucose meter such as display device 500 . If the data in Table 2 correspond to meal types with only one type (such as breakfast, lunch, or dinner), the output of Table 2 can be used to generate Figure 5 One of the graphic bars (502, 504 or 506).
[0150] As an initial part of the calculation, the value K was se...
PUM
 Abstract
Description
Claims
Application Information
 - R&D
- Intellectual Property
- Life Sciences
- Materials
- Tech Scout
- Unparalleled Data Quality
- Higher Quality Content
- 60% Fewer Hallucinations
Browse by: Latest US Patents, China's latest patents, Technical Efficacy Thesaurus, Application Domain, Technology Topic, Popular Technical Reports.
© 2025 PatSnap. All rights reserved.Legal|Privacy policy|Modern Slavery Act Transparency Statement|Sitemap|About US| Contact US: help@patsnap.com


