Electric power statistical index relevance analysis method

A technology of correlation analysis and statistical indicators, applied in the field of electric power statistical analysis, can solve problems such as the lack of intuitive and comprehensive statistical indicators.

Inactive Publication Date: 2013-07-17
STATE GRID CORP OF CHINA +2
View PDF1 Cites 14 Cited by
  • Summary
  • Abstract
  • Description
  • Claims
  • Application Information

AI Technical Summary

Problems solved by technology

However, in the existing technology, there are very few studies on the combing of the index correlation of the power statistical index system, index changes and linkages, and no intuitive and comprehensive statistical index linkage diagram has been formed.

Method used


Image

  • Electric power statistical index relevance analysis method
  • Electric power statistical index relevance analysis method
  • Electric power statistical index relevance analysis method

Examples


Embodiment Construction

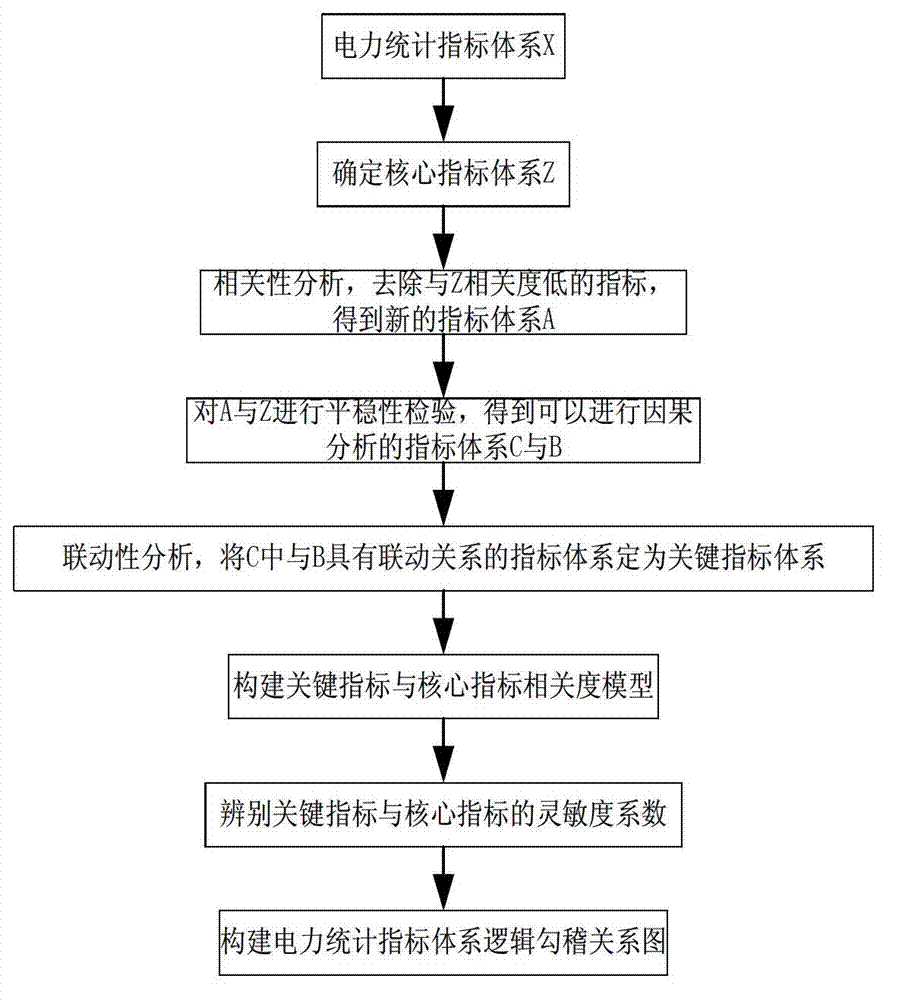
[0037] Such as figure 1 Shown, the present invention comprises the following steps:

[0038] 1) Determine the core index system of electricity statistics

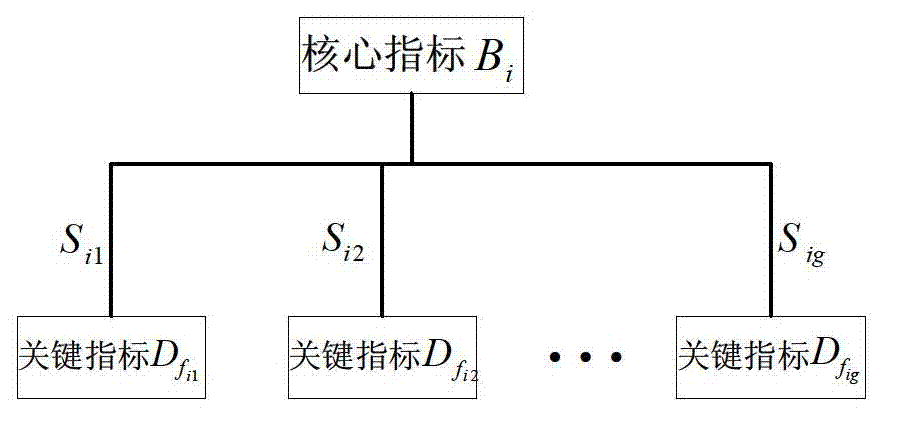
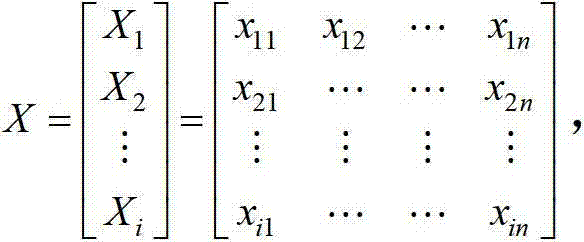
[0039] Based on the experience of power grid production and operation and the key to the main performance evaluation of the power grid, the core indicators that can reflect the main characteristics of the power grid are selected from the entire power statistical index system X to form the core index system Z.

[0040]

[0041] Among them, the indicator time series is X i =(x i1 ,x i2 ,...,xin ), the core indicator time series is Z i =(z i1 ,z i2 ,…,z in ), n is the number of data in the time series.

[0042] 2) Correlation analysis of power statistical index data:

[0043] 2.1) Generally speaking, the strength of data time series correlation can be measured with the help of correlation coefficient. The present invention uses a correlation coefficient method to obtain the correlation coefficient between the core...


PUM


Abstract

The invention relates to an electric power statistical index relevance analysis method which breaks away from an inherent thinking mode of traditional statistical index relevance analysis. The method includes the steps: analyzing relevance of electric power statistical comprehensive indexes by the aid of relevance analysis theory and analyzing correlation of the indexes; finding the causal relationship among the indexes and a core index by introducing linkage analysis theory in econometrics to determine key indexes of the core index; and finally, establishing a relevance model for the electric power statistical core index and the key indexes to obtain the sensitivity coefficient, quantizing the correlation and determining the dependence and affection degree of the indexes to form an electric power statistical index system articulation graph by taking the core index as a center. Compared with a traditional method, the electric power statistical index relevance analysis method has the advantages that correlation of the statistical indexes can be more visually and comprehensively known, and visual, clear and effective support is provided for a decision maker.

Description

technical field [0001] The invention belongs to the technical field of electric power statistical analysis, and in particular relates to a correlation analysis method for electric power statistical indicators. Background technique [0002] Many laws of power enterprise construction and operation exist in rich and complex statistical data. Discovering and quantifying these potential laws is of great significance for power enterprises to improve decision-making efficiency and decision-making level. The document "Analysis of Key Performance Indicators of Power Supply Enterprises Based on Data Mining Technology" discloses the classification and hierarchical relationship of key indicators of power supply enterprises, as well as the relationship between indicators and original data. The literature "Research on Customer Segmentation Model of Electric Power Industry Based on Data Mining" uses data mining method to scientifically and objectively analyze a large amount of customer beh...

Claims


Application Information

Patent Timeline
Patent Type & Authority Applications(China)
IPC IPC(8): G06F19/00G06Q50/06
Inventor 王熙亮马瑞徐慧明周谢王奇伟颜宏文于高
Owner STATE GRID CORP OF CHINA
Why Eureka
Try Eureka