Electricity consumption data visualization method, electricity consumption data visualization device and mobile terminal

A technology of electricity consumption data and data, which is applied in other database browsing/visualization, electricity digital data processing, and other database retrieval, etc., can solve the problems of large amount of electricity consumption information, complex electricity price pricing mechanism, and lack of users, etc., and achieve improvement The effect of user experience

Inactive Publication Date: 2015-12-23
SHENZHEN KUBO ENERGY SCI & TECH
View PDF5 Cites 4 Cited by
  • Summary
  • Abstract
  • Description
  • Claims
  • Application Information

AI Technical Summary

Problems solved by technology

Power users, especially industrial users and commercial users, have a complicated pricing mechanism for electricity prices, and the amount of electricity consumption information is l

Method used


Image

  • Electricity consumption data visualization method, electricity consumption data visualization device and mobile terminal
  • Electricity consumption data visualization method, electricity consumption data visualization device and mobile terminal
  • Electricity consumption data visualization method, electricity consumption data visualization device and mobile terminal

Examples


Embodiment Construction

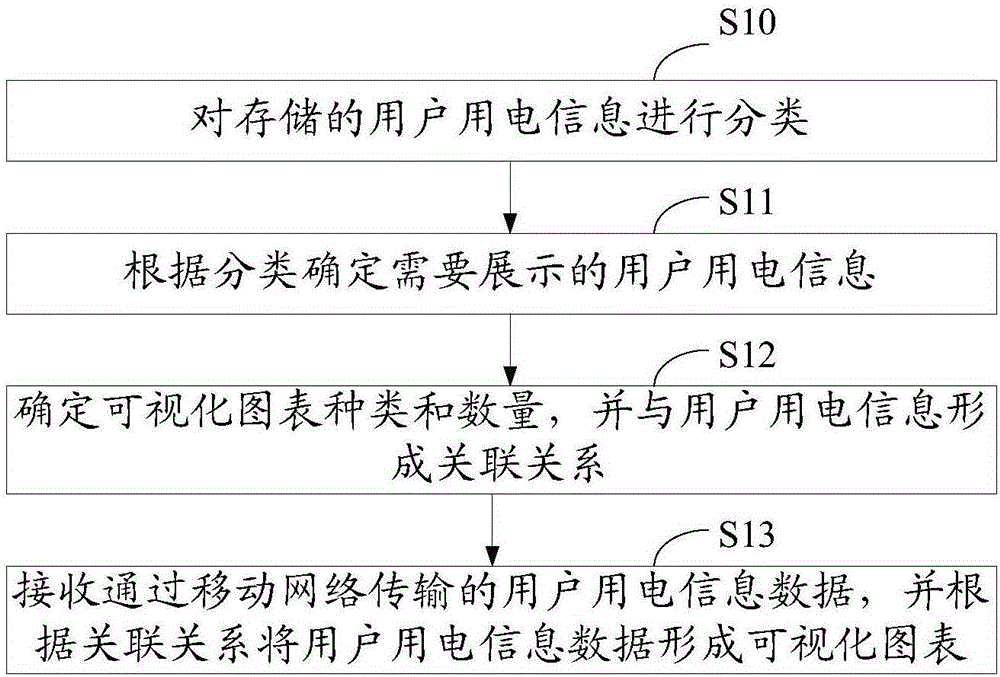
[0020] see figure 1 , figure 1 It is a schematic flow chart of the electricity consumption data visualization method of the embodiment of the present invention. like figure 1 As shown, the visualization methods of electricity consumption data include:

[0021] Step S10: classify the stored user electricity consumption information.

[0022] Among them, the classification includes: real-time updated data, non-real-time updated data, and automatic push information. The data updated in real time includes, but is not limited to: current load, load margin, and maximum load forecast after a preset time. Refresh load data every preset time, including current load, load margin, maximum load forecast, etc. Users can adjust the preset time according to their needs, and can choose 15 minutes, 30 minutes, etc. Non-real-time update data includes but not limited to: monthly load curve, annual load curve, and user electricity fee composition method. Non-real-time update data can be ref...


PUM


Abstract

The invention discloses an electricity consumption data visualization method, an electricity consumption data visualization device and a mobile terminal. The method comprises the following steps of: classifying the stored user electricity consumption information; according to the classification, determining the user electricity consumption information needed to be presented; determining type and amount of visualized charts, and forming an association relation with the user electricity consumption information; receiving user electricity consumption information data transmitted through a mobile network, and forming the visualized charts with the user electricity consumption information according to the association relation. Through the mode above, the method, the device and the mobile terminal enable users to visually and succinctly understand composition of own electricity charge, and user experience is improved.

Description

technical field [0001] The present invention relates to the field of power system applications, in particular to a method, device and mobile terminal for visualization of power consumption data. Background technique [0002] In the domestic power system, power users mainly include residential users, industrial users and commercial users. Power users, especially industrial users and commercial users, have a complicated pricing mechanism and a large amount of electricity consumption information. Electricity bills often require professionals to understand. The majority of users lack a simple and intuitive method to understand their own electricity consumption information. Traditional power system visualization technology is mainly to meet the intuitive understanding of power system transmission capacity, system safety margin and various constraints by system dispatching operators such as dispatching centers. It is not common to display power system visualization technology to...

Claims


Application Information

Patent Timeline
IPC IPC(8): G06F17/30
CPCG06F16/904Y02D10/00
Inventor 吴俊阳
Owner SHENZHEN KUBO ENERGY SCI & TECH
Why Eureka
Try Eureka