Electricity market monthly electricity utilization prediction method

A technology for electricity market and forecasting methods, applied in forecasting, data processing applications, instruments, etc., can solve problems such as affecting data, rough data adjustment, and inability to capture models

Inactive Publication Date: 2016-05-11
国网四川省电力公司营销服务中心 +1
View PDF0 Cites 10 Cited by
  • Summary
  • Abstract
  • Description
  • Claims
  • Application Information

AI Technical Summary

Problems solved by technology

The data needed for forecasting is not available
In particular, this kind of forecast based on the indicators of the same period often needs to predict the forecast factors in the forecast period first, and then use the forecast data as the input variable to forecast the electricity consumption in the forecast period. There is a double forecast, and the error will expand.
[0044] 2. Data change information is ignored in data processing
Even if the adjustment coefficient is used to calculate the normal month, it lacks the description of fluctuations in different periods before, during and after the Spring Festival, and the data adjustment is a bit rough
[0045] 3. Existing models only use observable factors to reflect the impact on changes in electricity consumption, and lack models to capture changes in unobservable factors
Predictive factors often may not change, while other variables that cannot be observed and controlled by the model will change drastically, which greatly affects the accuracy and precision of the model, and further such changes will affect the data of the next period
Once the drastic change of unobservable factors becomes the main reason for the change in electricity consumption, and the model cannot capture it, especially the automatic correction of this fluctuation deviation through known data information, it will make the prediction accuracy of electricity consumption not high

Method used


Image

  • Electricity market monthly electricity utilization prediction method
  • Electricity market monthly electricity utilization prediction method
  • Electricity market monthly electricity utilization prediction method

Examples


Embodiment Construction

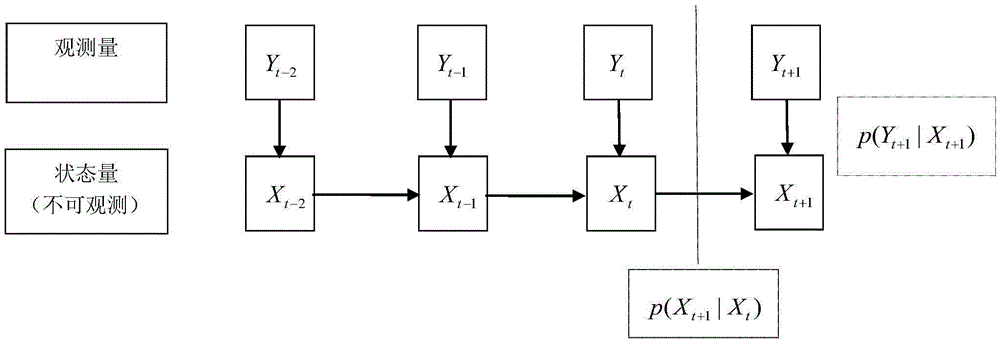
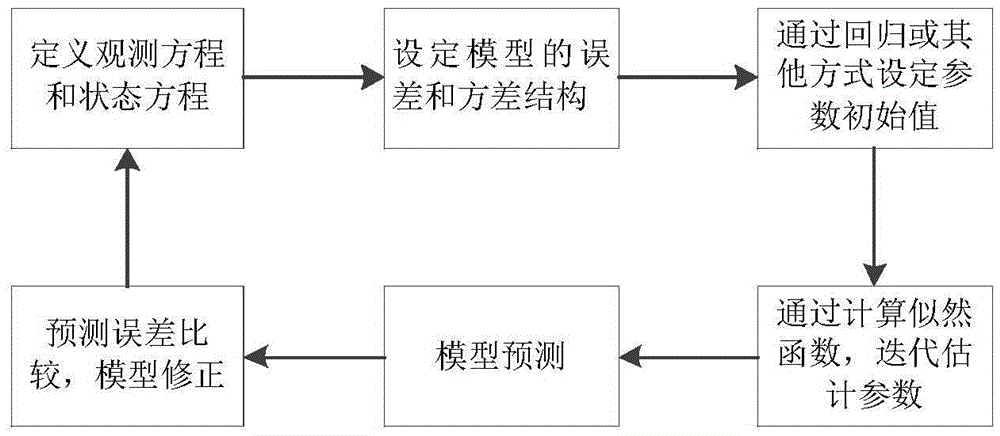
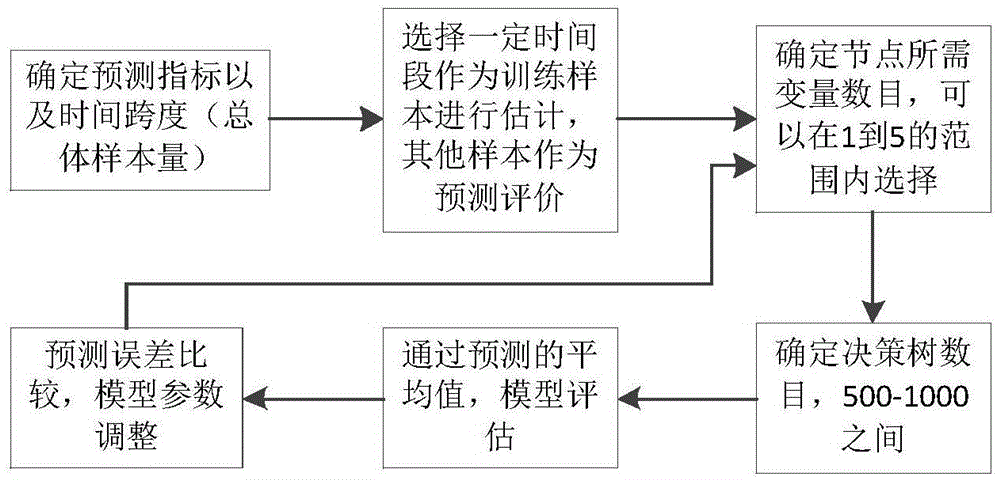
[0099] The invention is an electric power prediction model, which is mainly used in predicting electric power demand and electric power market. The main technical problems it solves are: 1. Temperature composite index, constructing a unified composite index reflecting the temperature situation in the whole region. 2. The effective working day method solves the effect of mobile holidays, that is, the monthly data accounting problem caused by the inconsistency of the Lunar New Year in the Gregorian calendar every year. 3. The leading indicator system, based on industry characteristics and economic laws, selects external indicators of power influence and industry expansion indicators that reflect endogenous growth. By determining the reasonable leading period of the index, the external index system of power forecasting is constructed. 4. The combination of state space model and machine learning method. On the one hand, it uses the powerful iterative algorithm of the state space ...


PUM


Abstract

The invention discloses an electricity market monthly electricity utilization prediction method. The prediction method comprises the following steps of step 1, setting an electricity utilization prediction model, defining a predicted state space model, performing complementary prediction by using a random forest model, loading randomForest, rpart software packages into R software, and leading in an explaining variable and an explained variable; and step 2, determining a prediction model input amount, establishing an air temperature aggregative indicator, adjusting a mobile holiday effect through an effective working day method, predicating a leading indicator, and determining a leading period through model measurement and calculation and coefficient calculation. According to the electricity market monthly electricity utilization prediction method, after the air temperature aggregative indicator, the leading indicator, the business expanding prediction indicator and the like are determined, a state space vector model and a random forest machine study model are combined for performing electricity consumption prediction, so that the prediction method is more accurate and effective.

Description

technical field [0001] The invention relates to the field of forecasting power consumption in a power market, in particular to a monthly forecasting method for power consumption in the power market. Background technique [0002] 1. The main technical methods and processing steps in the existing electricity consumption forecasting [0003] 1. Temperature weighted summation [0004] Due to the differences in natural geography and other factors, the temperature released by the Meteorological Bureau is usually released according to the climate zone. For regions with multiple climate zones and obvious differences, there is a lack of unified temperature data that reflects the overall situation. In order to make up for this defect, we simply sum or weighted the summation of the temperature in all climate zones to obtain the overall situation of the temperature, so as to obtain the overall temperature input for the electricity consumption forecast. If the overall temperature is T,...

Claims


Application Information

Patent Timeline
Patent Type & Authority Applications(China)
IPC IPC(8): G06Q10/04G06Q50/06
CPCG06Q10/04G06Q50/06
Inventor 王更生史代敏熊永华谢连芳李新何为李晨李科张睿史爽鲁万波龚金国刘宏鲲喻开志马云蓓
Owner 国网四川省电力公司营销服务中心
Why Eureka
Try Eureka