Browse type service perception analysis method

A technology of business perception and analysis method, applied in digital transmission systems, electrical components, transmission systems, etc., can solve problems such as high DPI deployment and operating costs, inability to develop DPI systems in areas where it is difficult to detect non-wireless network factors, and perception degradation

Active Publication Date: 2016-07-20
BEIJING UNION UNIVERSITY
View PDF4 Cites 28 Cited by
  • Summary
  • Abstract
  • Description
  • Claims
  • Application Information

AI Technical Summary

Problems solved by technology

[0008] (1) It is difficult to effectively reproduce non-fixed problems, and it is difficult to find perception degradation problems caused by non-wireless network factors
At present, the main method is to conduct a large number of DT / CQT dialing tests at the problem location where the user complains. On the one hand, the network-related parameters of the location are collected. Due to the variability of network signals and network user loads, many network quality problems often occur irregularly and are difficult to reproduce
There is no good way except for a lot of dialing and testing to try to reproduce
[0009] (2) It consumes a lot of manpower and time cost
[0011] (1) The cost of DPI deployment and operation is huge, and it cannot be carried out in areas without DPI systems;
[0012] (2) It is impossible to accurately collect and compare end-to-end delay-like perception information, and it is impossible to collect business perception information without network interaction
Therefore, it is impossible to effectively analyze and locate the perceived deterioration caused by such factors

Method used


Image

  • Browse type service perception analysis method
  • Browse type service perception analysis method
  • Browse type service perception analysis method

Examples


Embodiment Construction

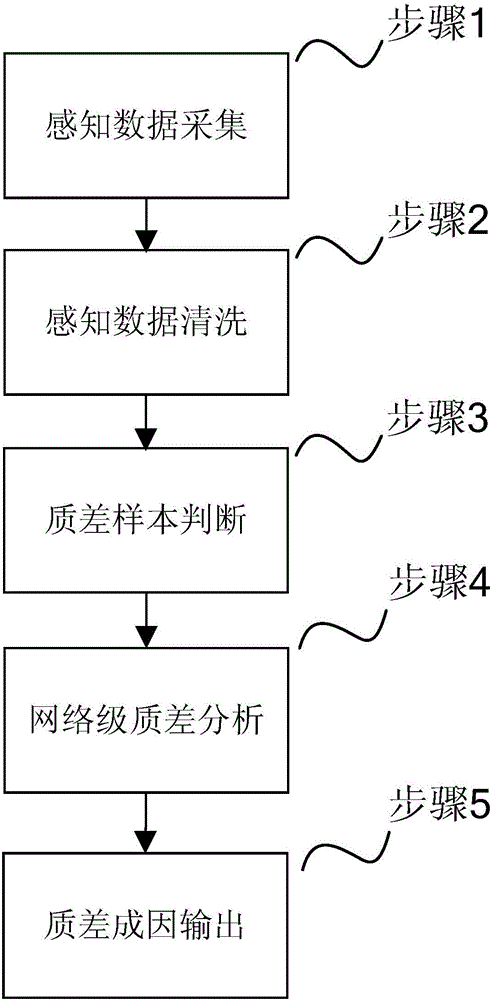
[0059] The present invention provides a method of analyzing the causes of poor service quality of mobile network users from the level of the entire network by using browsing service behavior data collected by user intelligent terminals. Wherein, steps 1-2 are carried out continuously, and steps 3-5 are generally carried out periodically (for example, carried out once every natural month, and the month is taken as an example to describe below). The specific steps are described in detail as follows:

[0060] Step 1: Perception Data Acquisition

[0061] Collect the user's browsing business App (such as UCweb, QQ browser, etc.) behavior information from the interface API provided by the operating system of the terminal through the App deployed on the smart terminal of a large number of users. The information contained in it should include: date, Time, network standard, cell ID, terminal latitude and longitude, name of the current province and city, field strength (the name is dif...


PUM


Abstract

The invention relates to a browse type service perception analysis method and belongs to the mobile communication field. With the browse type service perception analysis method adopted, massive user browse type service perception data acquired from a terminal side can be effectively utilized to analyze, position and delimit causes in the whole-network level for poor browse type service perception of users, and therefore, related parameters, algorithms, protocols and the like of a network can be optimized, so that the ability of the mobile network to carry browse type services can be improved, and references can be provided for the improvement of the browse type service perception of the users. According to the browse type service perception analysis method, causes for poor browse type service perception are analyzed according to terminal data acquired in actual mobile networks, namely, a plurality of 3G networks of regional and municipal telecommunications companies, and serious problems such as excessively long DNS resolution time and long time delay of the first packet of the Sina website exist in a certain network; and the problems are confirmed by the optimization departments of the telecommunications companies, and the optimization departments of the telecommunications companies carry out corresponding network adjustment, for example, optimize DNS servers and increase local Sina CDN servers, and subsequent tests also verify that the problems are solved, and indexes are improved.

Description

technical field [0001] The invention belongs to the field of mobile communication. Background technique [0002] Compared with the lower service quality (long delay, low reliability) of the Internet, carrier-class network service is a competitive advantage that telecom operators are proud of. In order to maintain its advantages, great efforts have always been devoted to the evaluation and optimization of network quality , but this has led to rigid thinking, that is, always looking at problems from the perspective of the network, focusing on network quality and ignoring user experience. In recent years, it has been strongly challenged by the OTT business (good business experience) of the Internet camp, and its market share has been gradually lost, and it is in danger of becoming a pipeline. It is imminent to change the network quality evaluation and optimization methods. [0003] The traditional network evaluation and optimization methods of operators mainly use drive test ...

Claims


Application Information

Patent Timeline
Patent Type & Authority Applications(China)
IPC IPC(8): H04L12/24H04L12/26
CPCH04L41/14H04L43/08H04L43/16H04L43/55
Inventor 李克
Owner BEIJING UNION UNIVERSITY
Why Eureka
Try Eureka