Visual monitoring platform based on HTML5 and application method

A monitoring platform and monitoring terminal technology, applied in the direction of digital transmission system, data exchange network, electrical components, etc., can solve the problems of inconvenient installation and operation of users, unable to meet user needs, low real-time data, etc., to achieve simple monitoring and save servers Resources and bandwidth, intuitive operation effects

Inactive Publication Date: 2016-08-31
HENAN PIONEER AUTOMATION EQUIP CO LTD
View PDF1 Cites 23 Cited by
  • Summary
  • Abstract
  • Description
  • Claims
  • Application Information

AI Technical Summary

Problems solved by technology

[0002] With the development of the Internet, traditional industrial monitoring and data visualization technology can no longer meet the needs of users. Users not only expect to see monitoring data in the monitoring room, but also use portable mobile terminals outside the monitoring room ( mobile phone, tablet computer, etc.) to view the monitoring data, if any problem is found on the monitoring page, you can also make adjustments on the mobile terminal at any time
At present, most monitoring terminals require users to install monitoring software, and a few provide browser methods, but need to install corresponding plug-ins, and the real-time data is not high, which brings great inconvenience to users' installation operations

Method used


Image

  • Visual monitoring platform based on HTML5 and application method
  • Visual monitoring platform based on HTML5 and application method
  • Visual monitoring platform based on HTML5 and application method

Examples


Embodiment 1

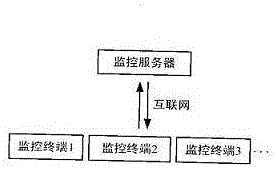
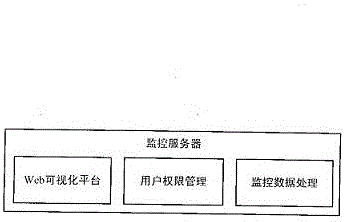
[0020] Embodiment 1, the present invention comprises monitoring server and monitoring terminal; Described monitoring server provides Web service, user rights management service and data service based on HTML5 visual monitoring website; Described based on HTML5 visual monitoring website consists of system login, visual configuration, It consists of multiple pages such as visual monitoring, and the pages of visual configuration and visual monitoring are realized by Canvas technology; the access authority of the visual monitoring website includes engineers, operators and interviewers; the monitoring server provides visual controls and The metadata service provides real-time and historical data services through the WebSocket protocol; the monitoring terminal can be a mobile phone, a tablet computer, a PC or a smart TV, and is connected to the monitoring server through a browser to realize visual configuration or monitoring.

Embodiment 2

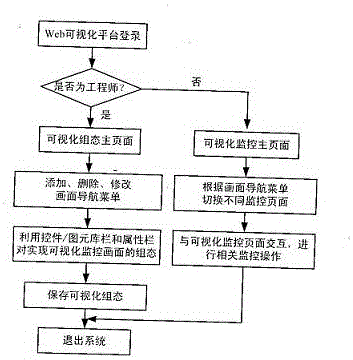
[0021] Embodiment 2, the described HTML5-based visual monitoring website is composed of multiple pages of system login, visual configuration, and visual monitoring; the pages of visual configuration and visual monitoring are realized by the Canvas technology of HTML5, and a control with a high degree of visualization is established by using Canvas and JavaScript With graphic elements, each control and graphic element has several properties and functions, which can be associated with specific real-time data or historical data of the monitoring server; when configuring, a navigation menu can be built, and navigation menu items can be added, deleted, and modified. Add blank pages under the navigation menu, drag controls or graphics elements, modify properties, associate data, and configure different pages. The visual monitoring page is a configured page. The controls and graphic elements in the page visualize the data associated with the monitoring server, and users can view or pe...

Embodiment 3

[0022] Embodiment 3, the visualized monitoring website includes engineers, operators and visitors; when a user logs in to the system, the user with the engineer's authority enters the main page of the visualized configuration, and can realize the configuration, addition, deletion and modification operations of the monitoring screen , users with other permissions enter the main page of visual monitoring, and can perform related operations on real-time or historical data.


PUM


Abstract

The invention discloses a visual monitoring platform based on HTML5 and an application method, and relates to the field of industrial monitoring and data visualization. The platform comprises a monitoring server and a monitoring terminal. The monitoring server provides Web service, user right management service and data service for a visual monitoring website based on HTML5. The visual monitoring website based on HTML5 is composed of multiple pages such as system login, visual configuration and visual monitoring. The pages of the visual configuration and the visual monitoring are realized by a Canvas technique. The visual monitoring website comprises rights of an engineer, an operator and a visitor. The monitoring server provides a visual control and graphic primitive information data service for the monitoring terminal by an HTTP protocol and provides real time and history data service by a WebSocket protocol. The visual configuration and the visual monitoring are realized through connection of a browser and the monitoring server.

Description

technical field [0001] The invention relates to the field of monitoring and data visualization, in particular to an HTML5-based visual monitoring platform and application method. Background technique [0002] With the development of the Internet, traditional industrial monitoring and data visualization technology can no longer meet the needs of users. Users not only expect to see monitoring data in the monitoring room, but also use portable mobile terminals outside the monitoring room ( mobile phone, tablet computer, etc.) to view the monitoring data, and if problems are found on the monitoring page, adjustments can be made on the mobile terminal at any time. At present, most monitoring terminals require users to install monitoring software, and a few provide browser methods, but need to install corresponding plug-ins, and the real-time data is not high, which brings great inconvenience to users' installation and operation. Contents of the invention [0003] The purpose o...

Claims


Application Information

Patent Timeline
Patent Type & Authority Applications(China)
IPC IPC(8): H04L12/24H04L29/08
CPCH04L41/0253H04L41/22H04L41/28H04L67/025
Inventor 郭循钊张志抗甘险峰郑建宇
Owner HENAN PIONEER AUTOMATION EQUIP CO LTD
Why Eureka
Try Eureka