Visualized analysis method for failure data of electric power transmission and transformation equipment

A technology for power transmission and transformation equipment and fault data, which is applied in other database browsing/visualization, electrical digital data processing, other database retrieval and other directions. Good results

Active Publication Date: 2016-10-26
ELECTRIC POWER RES INST OF GUANGXI POWER GRID CO LTD +1
View PDF2 Cites 17 Cited by
  • Summary
  • Abstract
  • Description
  • Claims
  • Application Information

AI Technical Summary

Problems solved by technology

[0006] At present, domestic research on fault identification and equipment status evaluation methods based on big data mining is in its infancy, and there is no complete process for visual analysis of existing equipment fault data.

Method used


Image

  • Visualized analysis method for failure data of electric power transmission and transformation equipment
  • Visualized analysis method for failure data of electric power transmission and transformation equipment
  • Visualized analysis method for failure data of electric power transmission and transformation equipment

Examples


Embodiment 1

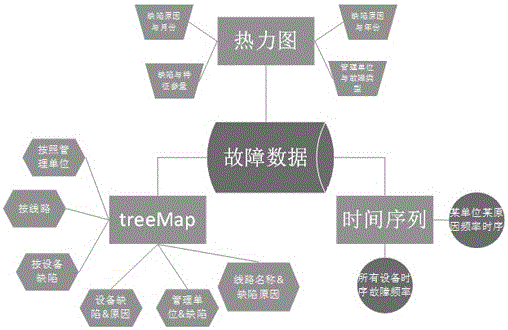
[0040] In this embodiment, the fault data of power transmission and transformation lines of a certain power company is analyzed for a period of time. figure 1 The main analysis content of this embodiment is summarized in the form of a block diagram.

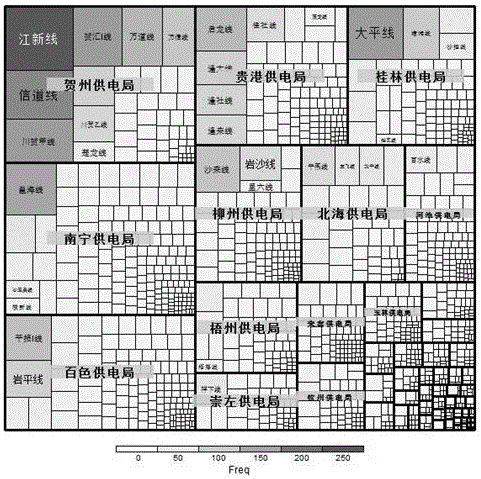
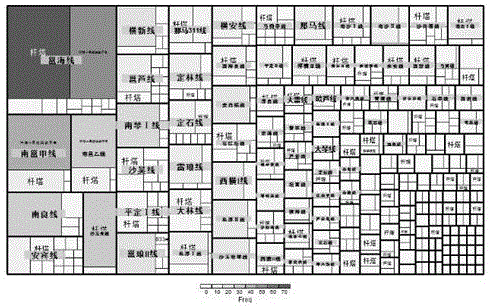
[0041] Firstly, analyze the TreeMap hierarchical graph. It mainly includes the analysis of the TreeMap hierarchical diagram for one or a combination of management units, transmission lines, faulty equipment, and fault causes. figure 2 It is a defect distribution map of transmission equipment classified according to management units; the rectangle enclosed by the thick black line in the figure is a municipal bureau under the company, and the small rectangle in the black framed rectangle is a transmission line under the jurisdiction of the municipal bureau; the rectangle in the figure is The size of the area is the frequency of failure; the name font of each rectangle decreases as the rectangles get smaller. image 3 It is a def...


PUM


Abstract

The invention relates to the field of failure analysis of electric power equipment and discloses a visualized analysis method for failure data of electric power transmission and transformation equipment. The visualized analysis method comprises the steps that the failure data of the electric power transmission and transformation equipment of an electric power system is collected; and the failure data is displayed by an R language analysis technology and a front-end display chart, so that visualized charts can be obtained. The visualized charts comprise a treeMap chart, a time sequence frequency chart or a variable correlation thermodynamic chart. The visualized analysis method has the advantages that comprehensive and multi-dimensional visualized data analysis is carried out to the failure data of the electric power transmission and transformation circuit equipment; different images and curves are obtained; and the overall failure data can be known visually and rapidly.

Description

technical field [0001] The invention relates to the field of fault analysis of power equipment, in particular to a visual analysis method for fault data of power transmission and transformation equipment. Background technique [0002] As we all know, the safety of power transmission and transformation equipment is the basis for the safe, reliable and stable operation of the power grid, which is of great significance to the power grid. Effective and accurate assessment, diagnosis and prediction of equipment status can significantly improve the reliability of power supply and will improve the level of intelligence in power grid operation. [0003] At the eleventh session of the International Conference on Artificial Intelligence held in the United States at the end of August 1989, the concept of data mining was born. In 1995, at the American Computer Annual Conference, the meaning of data mining was clarified, that is, the process of extracting potential laws and useful knowl...

Claims


Application Information

Patent Timeline
Patent Type & Authority Applications(China)
IPC IPC(8): G06F17/30
CPCG06F16/904
Inventor 尹立群郭丽娟张玉波黄金剑胡军张炜庄池杰陶松梅罗怿黄志都段炼邬蓉蓉
Owner ELECTRIC POWER RES INST OF GUANGXI POWER GRID CO LTD
Why Eureka
Try Eureka