
Method and system for displaying service logic and performance states at the same time

A business logic and performance technology, applied in the field of Web display, can solve problems such as simultaneous display and inconvenient use by users, and achieve the effect of convenient use

Active Publication Date: 2016-11-09
科来网络技术股份有限公司
View PDF10 Cites 9 Cited by
  • Summary
  • Abstract
  • Description
  • Claims
  • Application Information

AI Technical Summary

Problems solved by technology

[0006] Aiming at the technical problem that the existing technology cannot display the logical relationship between all hosts, applications and network connections supporting a business system in one view at the same time, and the user is inconvenient to use, the present invention discloses a simultaneous business logic and performance status method and system

Method used


Image

  • Method and system for displaying service logic and performance states at the same time
  • Method and system for displaying service logic and performance states at the same time

Examples


Embodiment Construction

[0018] The specific implementation manners of the present invention will be described in detail below in conjunction with the accompanying drawings.

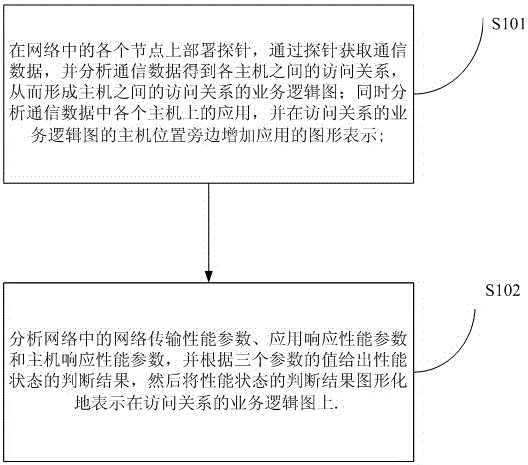
[0019] The invention discloses a method for displaying business logic and performance status at the same time, which specifically includes the following steps: Step 1. Deploy probes on each node in the network, obtain communication data through the probes, and analyze the communication data to obtain various Access relationship between hosts, thereby forming a business logic diagram of the access relationship between hosts; at the same time, analyze the application on each host in the communication data, and add a graphical representation of the application next to the host location in the business logic diagram of the access relationship; figure 1 In S101; step 2, analyze the network transmission performance parameters, application response performance parameters and host response performance parameters in the network, and give ...


PUM


Abstract

The invention relates to the technical field of display, and discloses a method for displaying service logic and performance states at the same time. Specifically, the method comprises the steps of 1, deploying probes on nodes in a network, obtaining communication data through the probes, analyzing the communication data to obtain access relationships among hosts, thereby forming a service logic graph of the access relationships among the hosts, moreover, analyzing applications in the hosts according to the communication data, and adding graph representation of the applications beside the hosts of the service logic graph of the access relationships; and 2, analyzing a network transmission performance parameter, an application response performance parameter and a host response performance parameter in the network, providing judging results of the performance states according to the values of the three parameters, and graphically representing the judging results of the performance states on the service logic graph of the access relationships. Through adoption of the method, the service logic and performance states can be displayed on the same visual graph, thereby facilitating the usage of a user.

Description

technical field [0001] The present invention relates to the technical field of Web display, in particular to a method and system for simultaneously displaying business logic and performance status. The method and system can simultaneously display business logic and performance status on a WEB page, which is convenient for users to use. Background technique [0002] With the vigorous development of computer software technology and Internet technology, more and more companies have begun to implement information management. The company's business operations are also increasingly dependent on the Internet. The monitoring of business system performance is directly related to the normal operation of the company. Many Internet companies have also launched monitoring software for business systems, but for companies with complex business systems and network environments, it is more troublesome to obtain the status of each host and network status under each business system. [0003]...

Claims


Application Information

Patent Timeline
IPC IPC(8): H04L12/26
CPCH04L43/045H04L43/0817H04L43/0829H04L43/0852H04L43/12
Inventor 高彦刚王翔王瑞孟海坤
Owner 科来网络技术股份有限公司
Learn More