High spectral image classification method based on morphological characteristics and dictionary learning
A hyperspectral image and morphological feature technology, applied in the field of hyperspectral image classification, can solve the problems of few samples and high dimensionality
- Summary
- Abstract
- Description
- Claims
- Application Information
AI Technical Summary
Problems solved by technology
Method used
Image
Examples
Embodiment 1
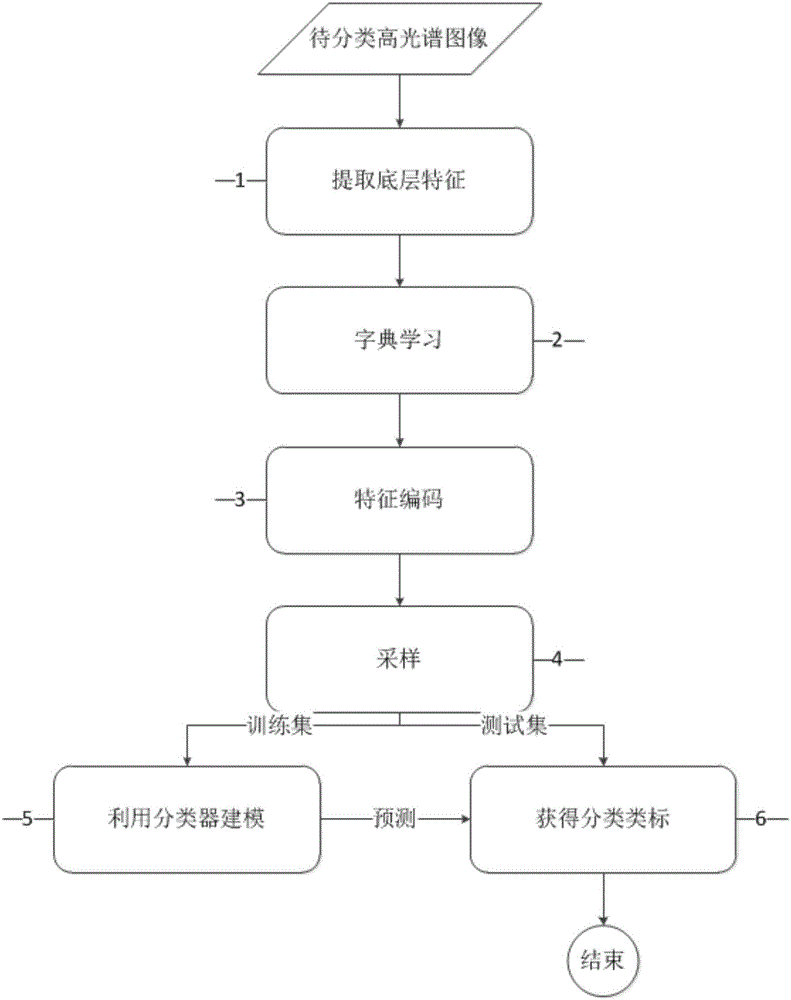
[0075] This embodiment includes the following parts:
[0076] 1. Extract the underlying features of the hyperspectral image:
[0077] Firstly, the hyperspectral image I is analyzed by kernel principal component analysis method, and the first d principal components are extracted to obtain d images with principal components as data [I 1 ,...,I d ]. Among them, d is preferably 13 in the present invention.
[0078] For each component image I i ,i=1,2,...d, define n types of sliding windows, called structural elements, where n is preferred in the present invention. Calculate the morphological profile MP(I i ):
[0079]
[0080] in is the feature of the open morphological section, and the open morphological section is obtained by using the opening operation on the same component image by using structural elements of different sizes, It is the opening operation, where R refers to the real number field, which is the result of a series of expansion operations followed by c...
Embodiment 2
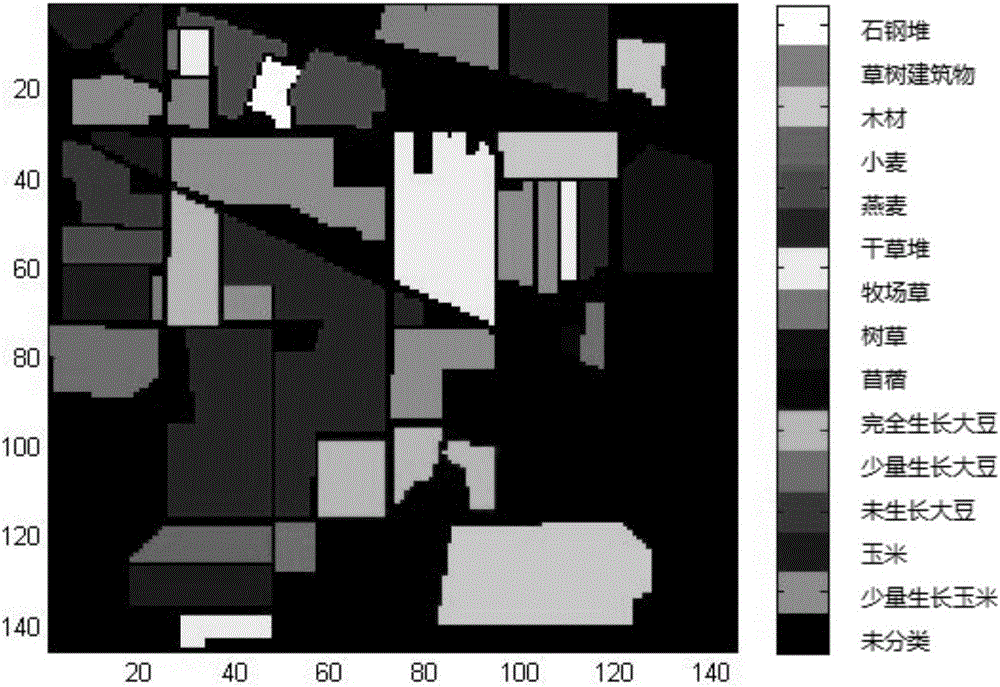
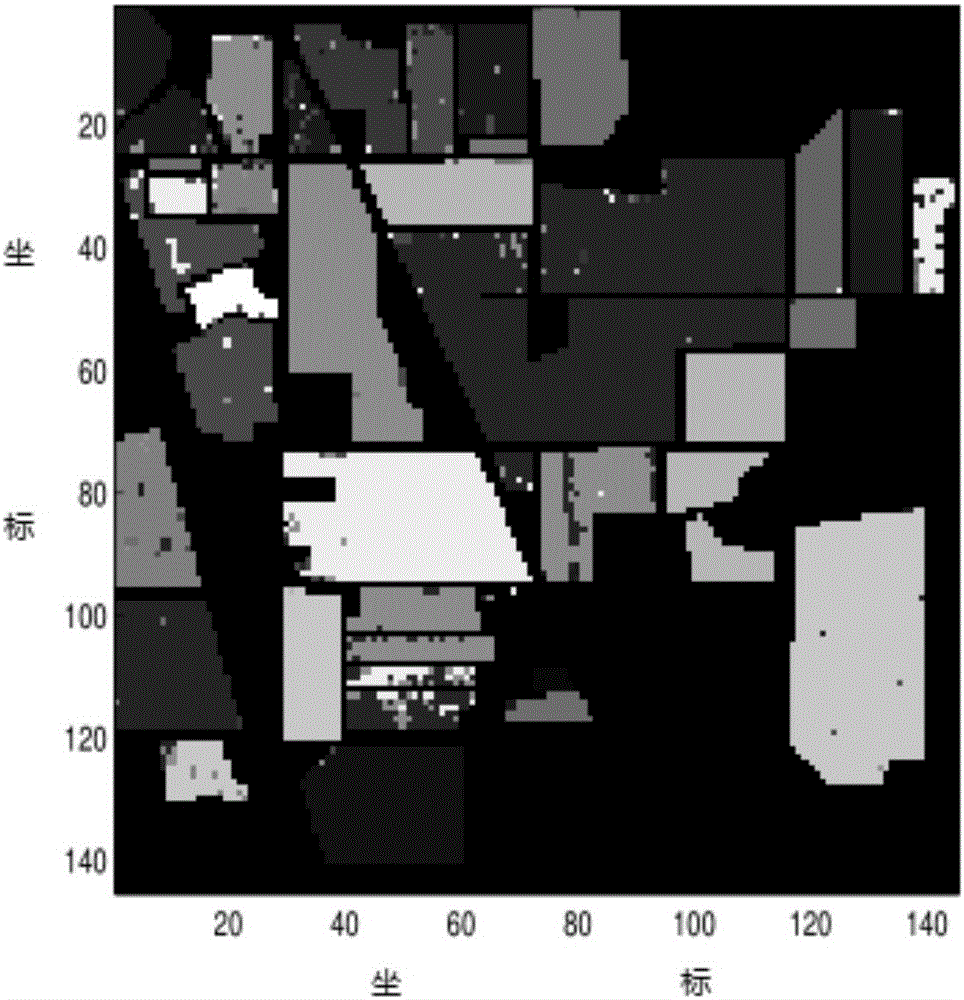
[0101] figure 2 It is the image truth table sourced from the Indian Pines dataset. The vertical and horizontal coordinates are the pixels in the physical space corresponding to the hyperspectral image. Each pixel represents about 20 square meters of real geographic space. image 3 For the classification effect diagram of the method of the present invention on Indian Pines, compared with the truth table, it can be seen that the classification results of the method of the present invention are correct in most of the pixels, and only a small number of pixels will have classification errors. (Since the attached drawings are all grayscale images, figure 2 and image 3 ) Figure 4 It is the classification accuracy rate obtained on the Indian Pines data using different parameters l, where the ordinate is the classification accuracy rate, and the abscissa is the number of values of l in the invention. It can be seen that as l increases, the classification accuracy rate also inc...
PUM
 Abstract
Description
Claims
Application Information
 - R&D
- Intellectual Property
- Life Sciences
- Materials
- Tech Scout
- Unparalleled Data Quality
- Higher Quality Content
- 60% Fewer Hallucinations
Browse by: Latest US Patents, China's latest patents, Technical Efficacy Thesaurus, Application Domain, Technology Topic, Popular Technical Reports.
© 2025 PatSnap. All rights reserved.Legal|Privacy policy|Modern Slavery Act Transparency Statement|Sitemap|About US| Contact US: help@patsnap.com


