A visualization method to show the interaction changes between characters

A role and interactive conversation technology, applied in the visual field of interactive changes, can solve the problems of boring text works, difficult plot time and comprehension, and inconvenient reading comprehension, etc., to achieve the effect of compact layout, easy understanding and compact structure

Active Publication Date: 2019-04-02
SHANGHAI JIAOTONG UNIV
View PDF3 Cites 0 Cited by
  • Summary
  • Abstract
  • Description
  • Claims
  • Application Information

AI Technical Summary

Problems solved by technology

[0003] In the existing written works, many different storylines, characters, and character conversations will appear with the development of the timeline, but because the written works are too boring, it is difficult to organize and understand the plot of the written works during the reading process, resulting in It is inconvenient to understand, and it is impossible to accurately know the hidden relationship between the characters in the storyline. Now there is no visual case to solve this problem

Method used


Image

  • A visualization method to show the interaction changes between characters
  • A visualization method to show the interaction changes between characters

Examples


Embodiment

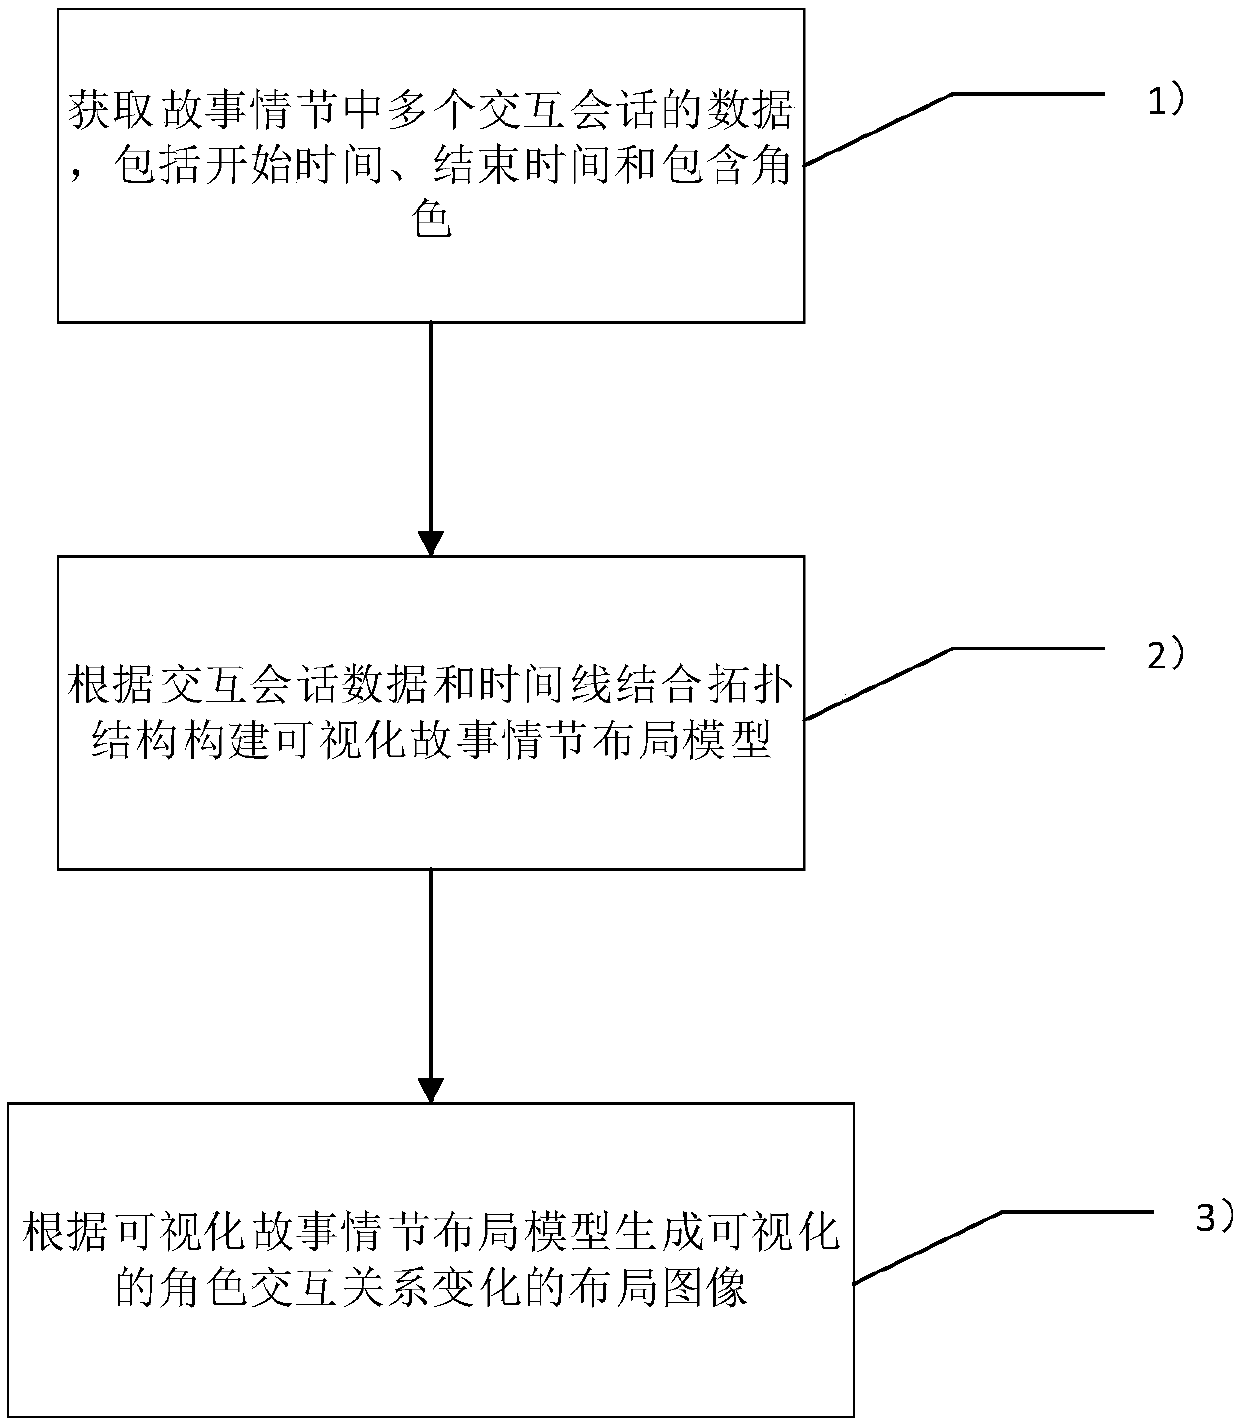
[0025] like figure 1 As shown, the present invention comprises the following steps:

[0026] 1. Data management

[0027] Interactive Session Data Model

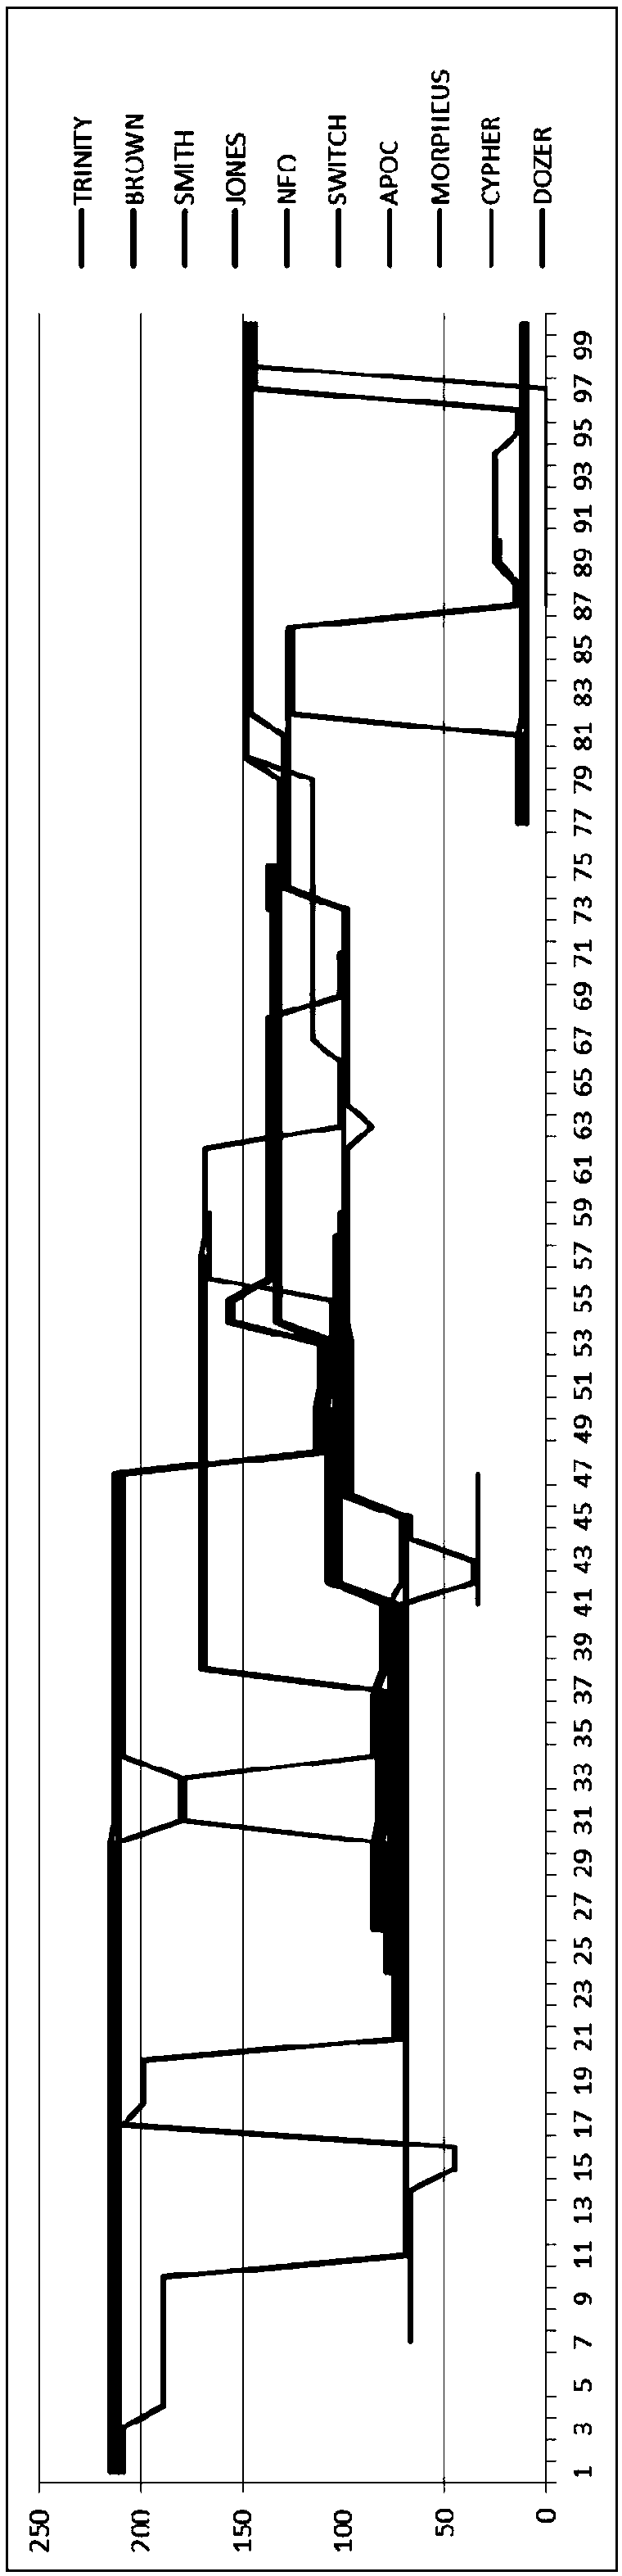
[0028] An interactive session is the most basic unit of data for storyline visualization. An interactive session contains three basic properties: start time, end time, and include roles. In the resulting visual storyline, interactive sessions are represented as a set of converging parallel lines. Each of these lines represents a character involved in the interactive session.

[0029] Generate interactive sessions from streaming data

[0030] The input stream data is divided by time into a list containing all the different role groupings at that point in time. Streaming data is entered in chronological order.

[0031] At each time point, the incoming packets will be divided into two categories: extended packets and new packets. An extended group refers to a group that contains exactly the same roles as a group at a pre...


PUM


Abstract

The invention relates to a visualization method for displaying an interaction change between roles. The method is used for generating a layout image of a visualized role interaction relationship change in a plot, and comprises the following steps of (1) obtaining data, including start time, end time and the roles, of multiple interaction sessions in the plot; (2) building a visualized plot layout model by combining a topological structure according to the data of the interaction sessions and timelines; (3) generating the layout image of the visualized role interaction relationship change according to the visualized plot layout model. Compared with the prior art, the visualization method has the advantages of being intuitive, visual, and compact in layout.

Description

technical field [0001] The invention relates to the field of image processing, in particular to a visualization method for displaying interactive changes between characters. Background technique [0002] In the image produced by the storyline visualization, each line represents an entity. When the lines representing two entities come together, there is some kind of interaction between the two entities. Likewise, when the two lines separate, it indicates the end of the interaction between the two entities. [0003] In the existing written works, there will be many different storylines, characters and character conversations with the development of the timeline, but because the written works are too boring, it is not easy to time and understand the plot of the written works during the reading process, resulting in reading. It is inconvenient to understand, and it is impossible to accurately know the hidden relationship between the various characters in the storyline, and the...

Claims


Application Information

Patent Timeline
Patent Type & Authority Patents(China)
IPC IPC(8): G06T11/60
CPCG06T11/60
Inventor 盛斌陈熙宁
Owner SHANGHAI JIAOTONG UNIV
Why Eureka
Try Eureka