Method and device for drawing symbols
A technology for symbolizing and drawing images, which is applied in the field of geographic information, can solve problems such as slow speed, and achieve the effect of increasing speed, improving drawing rate, and better drawing effect
- Summary
- Abstract
- Description
- Claims
- Application Information
AI Technical Summary
Problems solved by technology
Method used
Image
Examples
Embodiment 1
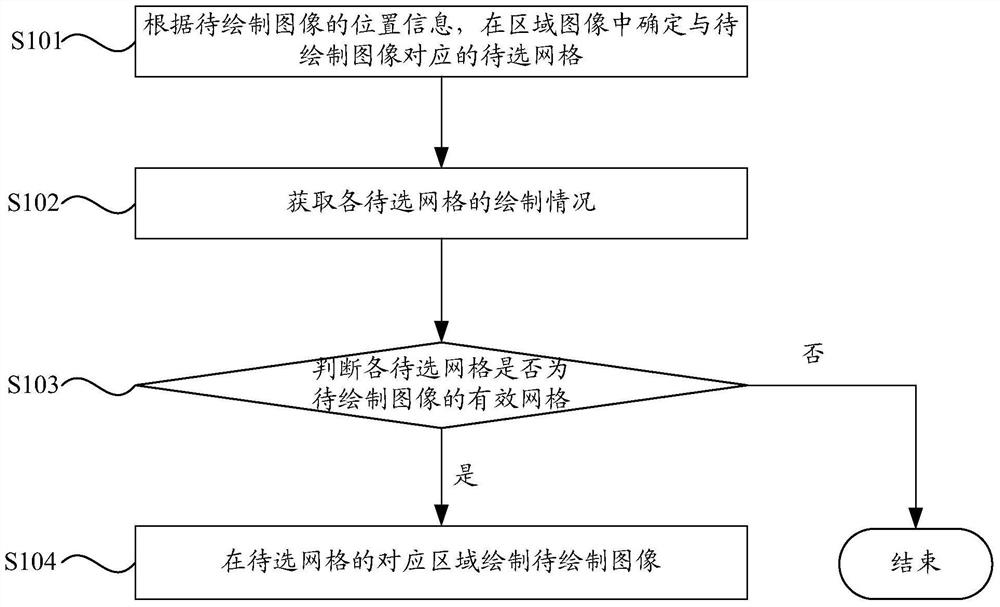
[0054] figure 1 , is a flow chart of the method for drawing symbols provided in Embodiment 1 of the present invention. Such as figure 1 As indicated, the process may include:
[0055] S101. Determine a grid to be selected corresponding to the image to be drawn in the area image according to the position information of the image to be drawn.
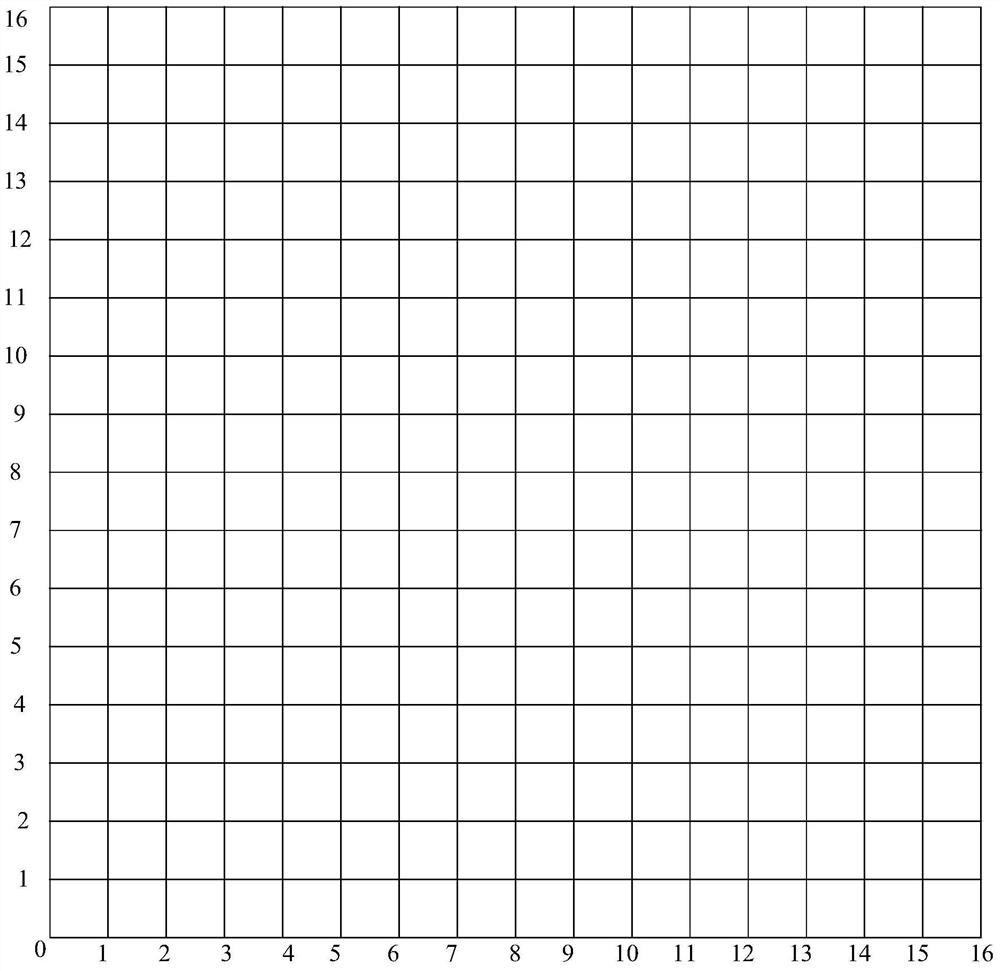
[0056] The area image can be divided into multiple grids, the number of pixels of the grid is greater than or equal to the number of pixels of the image to be drawn, and the number of grids to be selected is greater than or equal to one.
[0057] S102. Obtain the drawing situation of each grid to be selected.
[0058] S103. According to the drawing situation of each grid to be selected, determine whether each grid to be selected is a valid grid of the image to be drawn.
[0059] If yes, go to step S104, otherwise end the process.
[0060] S104. Draw the image to be drawn in the corresponding area of the grid to be selected.
Embodiment 2
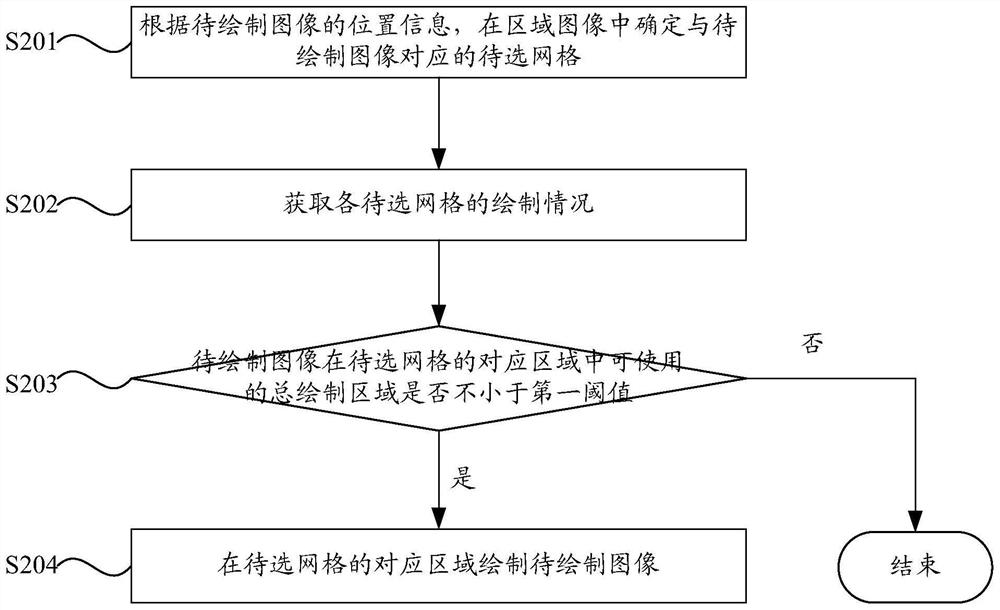
[0062] figure 2 , is a flow chart of the method for drawing symbols provided in Embodiment 2 of the present invention. Such as figure 2 As indicated, the process may include:
[0063] S201. Determine a grid to be selected corresponding to the image to be drawn in the area image according to the position information of the image to be drawn.
[0064] The area image can be divided into multiple grids, the number of pixels of the grid is greater than or equal to the number of pixels of the image to be drawn, and the number of grids to be selected is greater than or equal to one.
[0065] S202. Obtain the drawing situation of each grid to be selected.
[0066] S203. According to the drawing situation of each grid to be selected, determine whether the total drawing area available for the image to be drawn in the corresponding area of the grid to be selected is not less than the first threshold, if yes, go to step S204, otherwise end the process .
[0067] S204. Draw the im...
Embodiment 3
[0107] On the basis of the method for drawing symbols provided in the first and second embodiments above, the flow chart of the method for drawing symbols provided by the third embodiment of the present invention can be found in Figure 6 .
[0108] S601. Store the location information of the image to be drawn in a memory, and establish a spatial index.
[0109] S602. Acquire the size of the image to be drawn and the size of the region image.
[0110] S603. Determine the grid size according to the size of the image to be drawn.
[0111] S604. Perform expansion processing on the area image, so that the number of pixels of the processed area image conforms to 2 to the nth power and is closest to the number of pixels of the area image.
[0112] S605. Perform grid division on the expanded region image according to the size of the grid.
[0113] S606. Acquire position information of the image to be drawn.
[0114] S607. According to the position information of the image to be d...
PUM
 Abstract
Description
Claims
Application Information
 - R&D
- Intellectual Property
- Life Sciences
- Materials
- Tech Scout
- Unparalleled Data Quality
- Higher Quality Content
- 60% Fewer Hallucinations
Browse by: Latest US Patents, China's latest patents, Technical Efficacy Thesaurus, Application Domain, Technology Topic, Popular Technical Reports.
© 2025 PatSnap. All rights reserved.Legal|Privacy policy|Modern Slavery Act Transparency Statement|Sitemap|About US| Contact US: help@patsnap.com


