Geographic-information-based network delay visualization method and system

A network delay and geographic information technology, applied in the field of network delay visualization and system based on geographic information, can solve problems such as general analysis efficiency, poor intuitive effect, and network delay

Inactive Publication Date: 2017-04-19
XINJIANG UNIVERSITY
View PDF2 Cites 4 Cited by
  • Summary
  • Abstract
  • Description
  • Claims
  • Application Information

AI Technical Summary

Problems solved by technology

[0006] (2) Network delay refers to the transmission of various data through network protocols (such as TCP/IP) in the network medium. If the amount of information is too large and not limited, the excess network traffic will cause the device to respond slowly. cause network delay
[0008] Therefore, the res...

Method used


Image

  • Geographic-information-based network delay visualization method and system
  • Geographic-information-based network delay visualization method and system

Examples


Embodiment Construction

[0026] The present invention will be described in further detail below in conjunction with the accompanying drawings and specific embodiments.

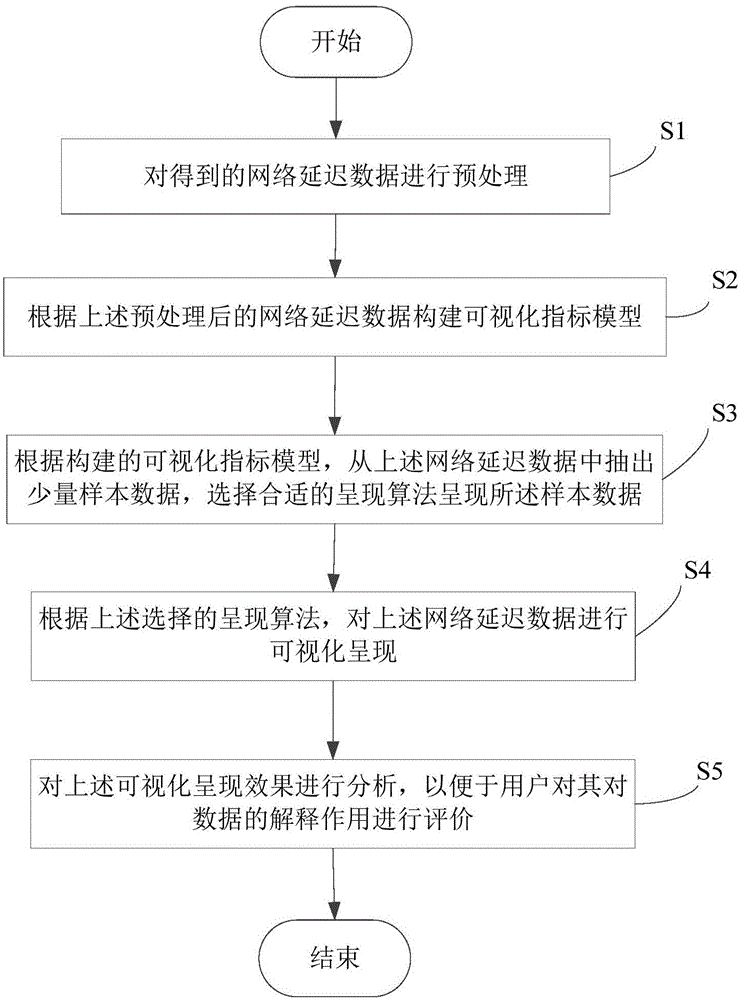
[0027] refer to figure 1 Shown is a flow chart of a preferred embodiment of the geographic information-based network delay visualization method of the present invention.

[0028] Step S1, preprocessing the network delay data.

[0029] For the obtained network delay data with different record structures and storage methods, the network delay data should be preprocessed first. The main work of the network delay data preprocessing includes: establishing a unified data format, processing invalid and missing values, extracting required fields, forming the original data source, and the network delay data after data preprocessing can be analyzed on demand up. in particular:

[0030] (1) Formatting of network delay data: Initially, various network delay data are obtained, and the data format must be converted into a unified network data f...


PUM


Abstract

The invention relates to a geographic-information-based network delay visualization method. The method comprises the steps that network delay data are preprocessed; a visualization index model is constructed according to the preprocessed network delay data; according to the constructed visualization index model, a small amount of sample data are extracted from the network delay data, and an appropriate rendering algorithm is selected to render the sample data; and visualization rendering is carried out on the network delay data according to the selected rendering algorithm. The invention further relates to a geographic-information-based network delay visualization system. According to the invention, the network delay data based on geographic information is visualized; node information distribution and location can be visually viewed; the relevance of the network delay data, regional development situation and the like can be accurately studied; and massive network delay data can be visually and quickly analyzed.

Description

technical field [0001] The invention relates to a method and system for visualizing network delay conditions based on geographic information. Background technique [0002] With the continuous development of geographical location-related network technologies such as mobile Internet and navigation positioning, geographical location information is becoming more and more important for the display of network data. Visualize the network data with geographical location information, and increase the geographical location information of nodes under the condition of standard aesthetics, so that the formed network is more authentic and beautiful, so that users can have a deeper and clearer understanding of network data . [0003] (1) Visualization of geographic information. We are in a three-dimensional space, and data from the real world often includes location information. Spatial data refers to data defined in three-dimensional space with position information. Understanding spati...

Claims


Application Information

Patent Timeline
IPC IPC(8): H04L12/24H04L12/26
CPCH04L43/045H04L41/0677H04L41/145H04L41/22
Inventor 努尔布力段海新王宁何旭东
Owner XINJIANG UNIVERSITY
Why Eureka
Try Eureka