Transportation co-occurrence phenomenon visualized analysis method based on taxi trajectory data

A trajectory data and traffic travel technology, applied in other database browsing/visualization, traffic flow detection, other database retrieval, etc., can solve the problems of difficulty and lack of effective analysis of complex data

Active Publication Date: 2017-05-10
DALIAN UNIV OF TECH
View PDF3 Cites 14 Cited by
  • Summary
  • Abstract
  • Description
  • Claims
  • Application Information

AI Technical Summary

Problems solved by technology

Due to the lack of systematic and efficient methods, people

Method used


Image

  • Transportation co-occurrence phenomenon visualized analysis method based on taxi trajectory data
  • Transportation co-occurrence phenomenon visualized analysis method based on taxi trajectory data
  • Transportation co-occurrence phenomenon visualized analysis method based on taxi trajectory data

Examples


Embodiment Construction

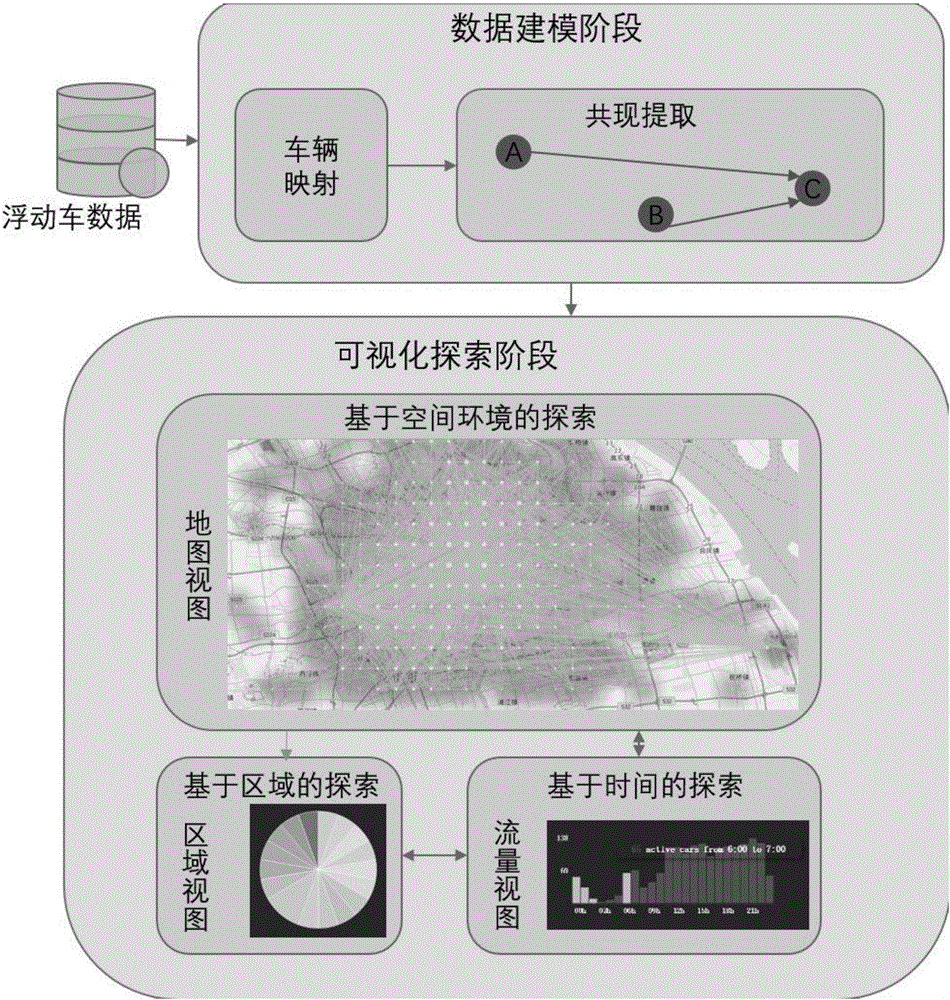
[0046] The embodiment of the present invention provides a method for visual analysis of traffic co-occurrence phenomena based on taxi trajectory data, the process is as follows figure 1 As shown, the design includes the following steps:

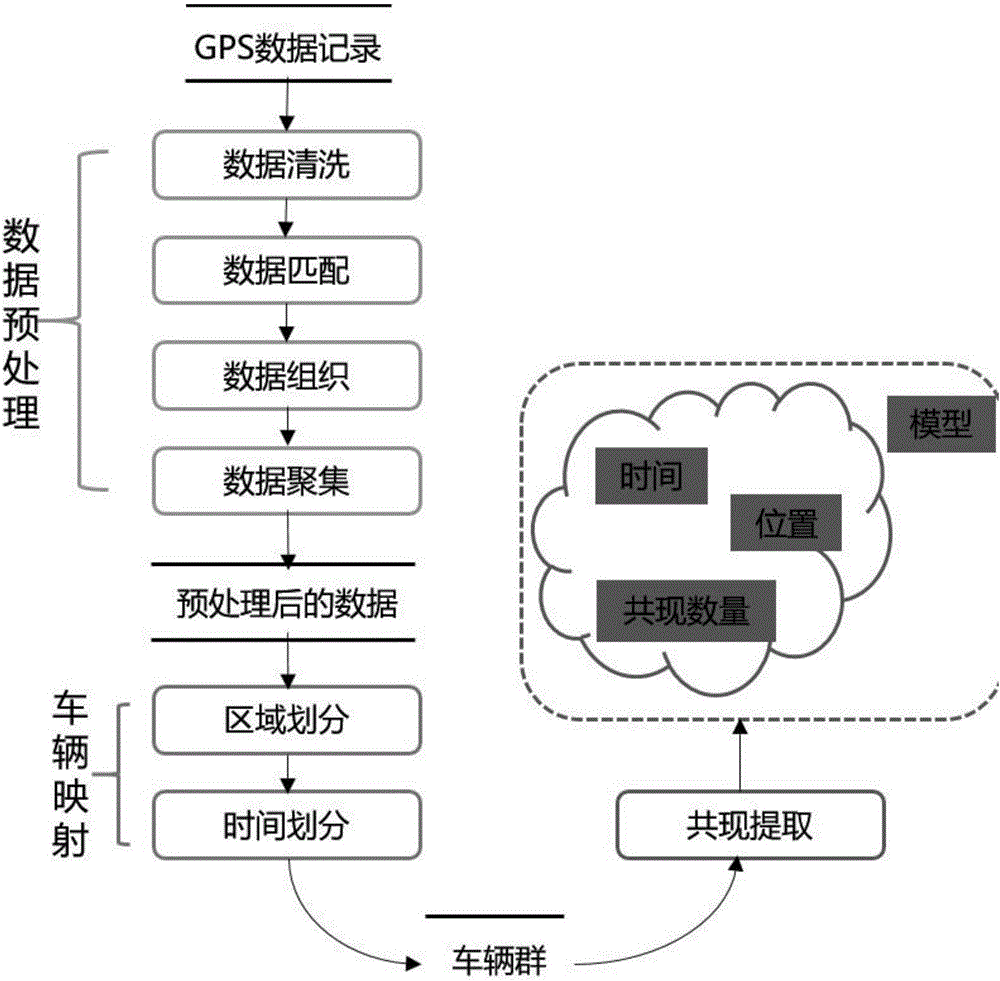
[0047] S1: Preprocess the trajectory data generated by recording the GPS data of 13,310 taxis in Shanghai on April 20, 2015.

[0048] The attributes of GPS raw data records are shown in Table 1 below.

[0049] Numbering name note 1 ID track number 2 VEHICLEID vehicle number 3 long GPS longitude 4 LAT GPS latitude 5 RATE GPS speed 6 ANGLE GPS position 7 DATE_TIME date time 8 STATE Status (1: Passenger, 0: Empty) 9 EXTENDSTAT 10 RESERVED

[0050] S2: Carry out vehicle mapping on the trajectory data generated by recording the GPS data of 13,310 taxis in Shanghai for the whole day on April 20, 2015, and map the vehicles to the corresponding vehicle ...


PUM


Abstract

The invention discloses a transportation co-occurrence phenomenon visualized analysis method based on taxi trajectory data. The method comprises the steps that after basic data preprocessing is performed, region division and time division are performed on data, vehicles are mapped into different vehicle groups, then, the data is modeled in a graph structure, co-occurrence event data is extracted, analysis tasks are discussed on the basis of data characteristics and design principle, the visualized design flow is provided, various visualized methods are combined, a visualized design scheme containing three views is obtained, and the simple and clear expression mode is provided for co-occurrence analysis. The visualized design is analyzed and verified on the basis of Shanghai taxi trajectory data set living samples, so that intuitive analysis of the co-occurrence phenomenon is performed in a multi-angle and multi-level mode.

Description

technical field [0001] The invention relates to the field of traffic data visualization, in particular to a method for visually analyzing traffic co-occurrence phenomena based on taxi trajectory data. Background technique [0002] A co-occurrence phenomenon in the laws of human movement in cities refers to the fact that people from two regions visit the same urban area during the same time period. Analyzing co-occurrence phenomena has great application value in society and business, such as pedestrian travel advice, traffic planning, infectious disease prevention, business activities and information dissemination. With the widespread use of GPS devices in vehicles, a large amount of data tracking human movement trajectories can be obtained. New opportunities for data-driven analytics are emerging. Due to the lack of systematic and efficient methods, people face great difficulties in effectively analyzing complex data. Data visualization combines human capabilities with an...

Claims


Application Information

Patent Timeline
IPC IPC(8): G06F17/30G08G1/01
CPCG06F16/29G06F16/903G06F16/904G08G1/01
Inventor 孔祥杰李梦琳杨卓夏锋
Owner DALIAN UNIV OF TECH
Why Eureka
Try Eureka