A signal change diagram drawing method and device, electronic equipment
A signal change and signal technology, applied in the computer field, can solve the problem of not being able to intuitively display the drastic change signal, and achieve the effect of facilitating the overall trend
- Summary
- Abstract
- Description
- Claims
- Application Information
AI Technical Summary
Problems solved by technology
Method used
Image

Examples
Embodiment 1
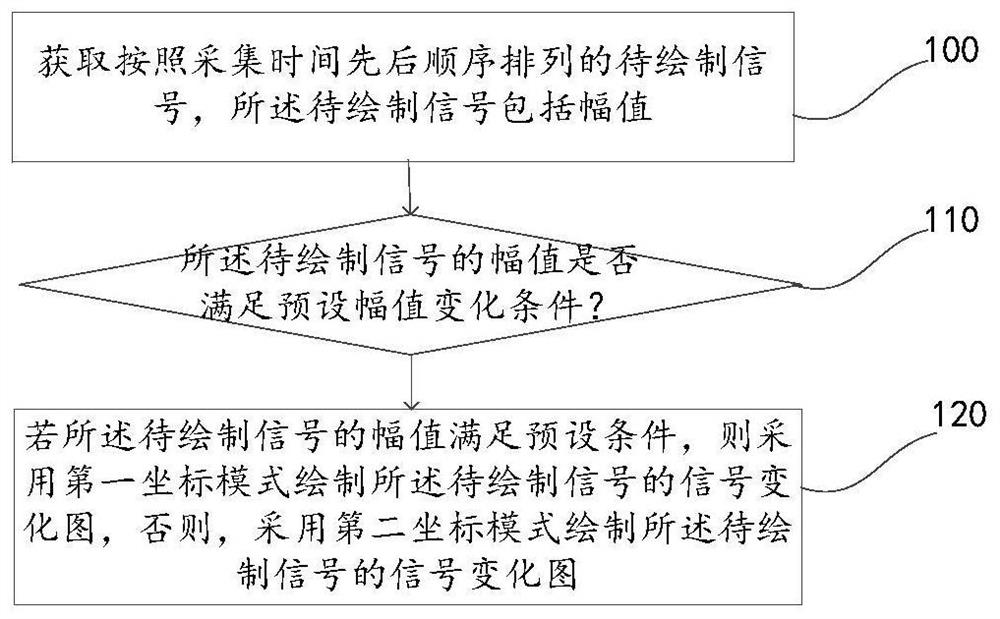
[0026] A method for drawing signal change diagrams disclosed in the present application, such as figure 1 As shown, the method includes: step 100 to step 120.
[0027] Step 100, acquire signals to be plotted arranged in order of acquisition time, where the signals to be plotted include amplitude values.
[0028] In the signal detection process, a certain number of signal values of the signals to be detected are usually collected first, and then a signal change diagram of the signals to be detected is drawn according to the collected signal values of the certain number of signals to be detected, so as to visually judge the signal value of the signal to be detected. Describe the change of the signal to be detected. During specific implementation, the collected signal value of the signal to be detected is the signal amplitude, and the collected signal of the signal to be detected also has an attribute of collection time. During specific implementation, the collected signals...
Embodiment 2
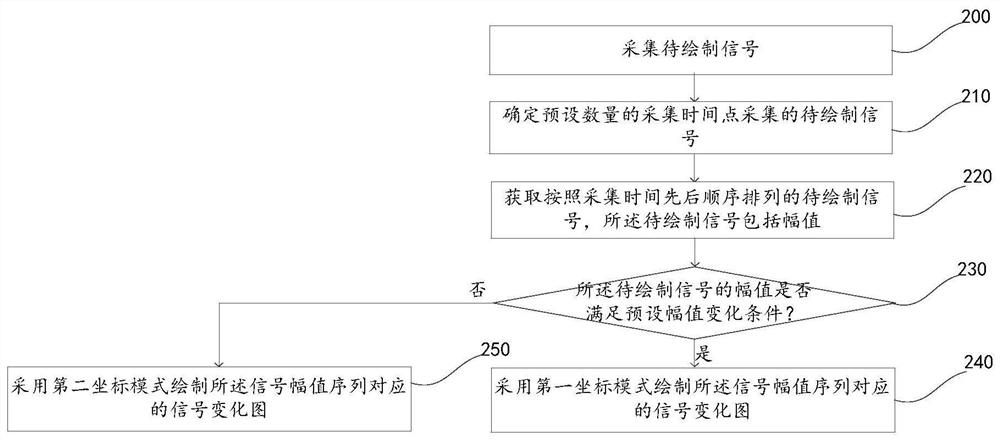
[0038] A method for drawing a signal change diagram disclosed in the embodiment of the present application, such as figure 2 As shown, the method includes: Step 200 to Step 250.
[0039] Step 200, collecting signals to be drawn.
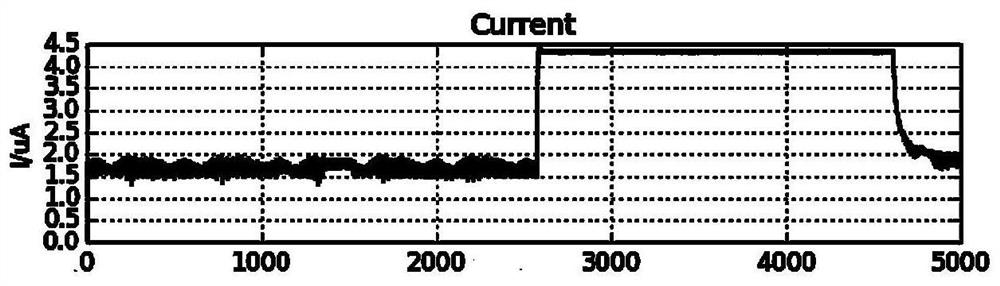
[0040]The signal to be drawn in this application may be an electrical signal such as a voltage signal, a current signal, or a power consumption signal. Different signal acquisition methods are different. In this embodiment, only the collected signal to be drawn is a current signal as an example for illustration. The signal to be drawn in this application may be an electrical signal collected from any electronic device, such as a PC, a mobile terminal, a personal digital assistant, a tablet computer, a TV, an electronic door lock, and the like. Different electronic devices have different signal change frequencies, so before collecting signals, set a corresponding sampling frequency according to the signal change frequency of the electronic device t...
Embodiment 3
[0060] Correspondingly, the embodiment of the present application discloses a signal change graph drawing device, such as Figure 6 As shown, the device includes:
[0061] The signal to be drawn acquisition module 600 is used to acquire the signals to be drawn arranged in the order of acquisition time, and the signal to be drawn includes amplitude and acquisition time;
[0062] A judging module 610, configured to judge whether the amplitude of the signal to be plotted meets a preset amplitude change condition;
[0063] Select the drawing module 620, for if the amplitude of the signal to be drawn meets the preset amplitude change condition, use the first coordinate mode to draw the signal change diagram of the signal to be drawn, otherwise, use the second coordinate mode to draw the signal change diagram Describe the signal change graph of the signal to be plotted.
[0064] optional, such as Figure 7 As shown, the selection drawing module 620 includes:
[0065] The first d...
PUM
 Abstract
Description
Claims
Application Information
 - R&D
- Intellectual Property
- Life Sciences
- Materials
- Tech Scout
- Unparalleled Data Quality
- Higher Quality Content
- 60% Fewer Hallucinations
Browse by: Latest US Patents, China's latest patents, Technical Efficacy Thesaurus, Application Domain, Technology Topic, Popular Technical Reports.
© 2025 PatSnap. All rights reserved.Legal|Privacy policy|Modern Slavery Act Transparency Statement|Sitemap|About US| Contact US: help@patsnap.com