Sensor optimized deployment method based on fault increasing trend correlation analysis
A sensor and correlation technology, applied in the direction of instruments, electrical testing/monitoring, control/regulation systems, etc., can solve problems such as failure to effectively describe the growth trend of faults, and achieve the effect of reducing monitoring costs and improving efficiency and accuracy
- Summary
- Abstract
- Description
- Claims
- Application Information
AI Technical Summary
Problems solved by technology
Method used
Image

Examples
Embodiment 1
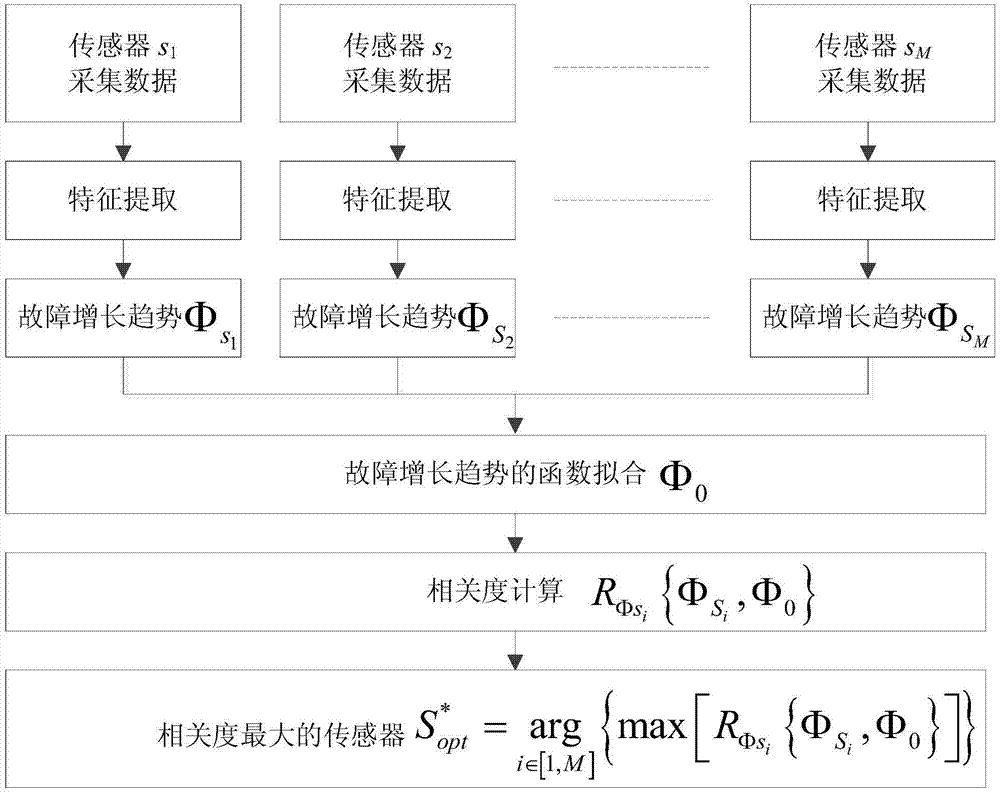
[0031] Such as Figure 1-3 As shown, a sensor optimization deployment method based on the correlation analysis of the failure growth trend includes the following steps:
[0032] S1. Initial deployment of sensor set S i ={S 1 , S 2 , S 3 ,..., S M }, M is the total number of sensors, and all sensors in the sensor set are used to collect data on the failure growth process.
[0033] S2. Perform feature extraction on the data collected by each sensor, and then use the traditional damage index (root mean square, kurtosis index, impulse index, peak index or margin index) to establish the failure growth trend described by each sensor
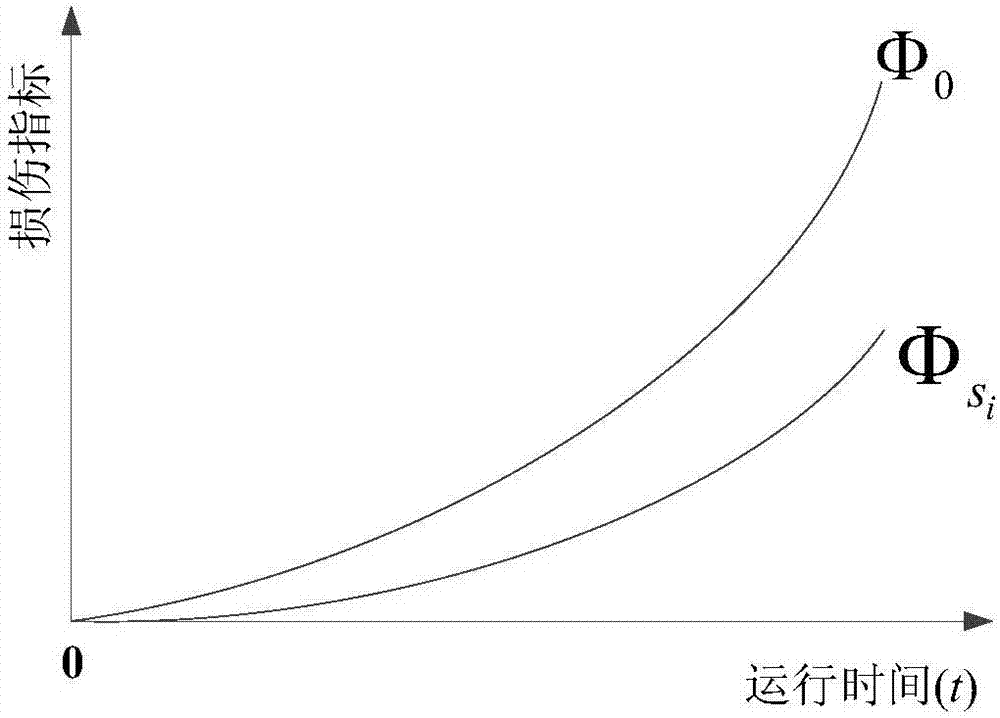
[0034] S3. Use function fitting methods (polynomial function, exponential function, double exponential function or Gaussian function) to describe the failure growth trend of all sensors Perform fitting to obtain the fault growth trend after fitting Φ 0 .
[0035] S4, calculate the i-th sensor S i Described failure growth trend And the fault growth trend afte...
Embodiment 2
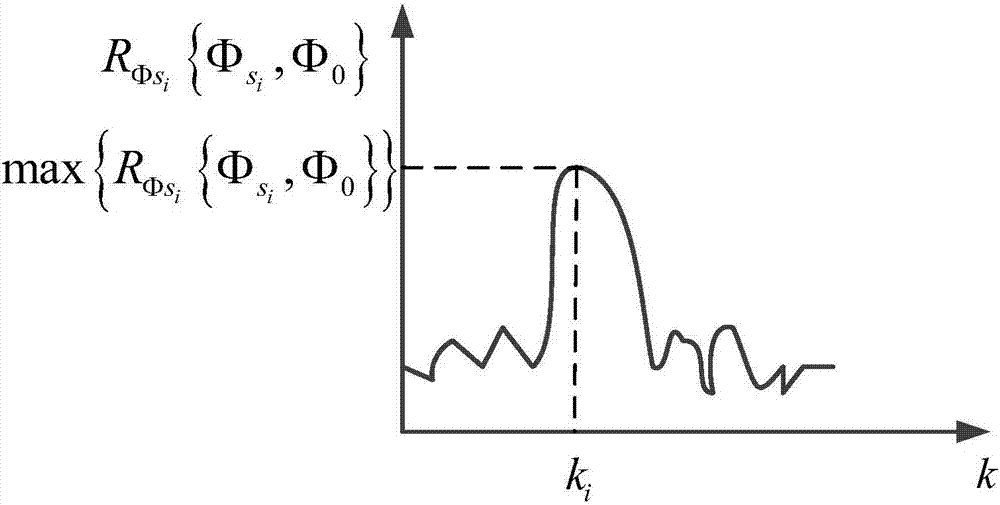
[0038] A sensor optimization deployment method based on correlation analysis of failure growth trend. The difference from Embodiment 1 is that this embodiment discloses the i-th sensor S i Described failure growth trend And the fault growth trend after fitting Φ 0 The correlation calculation formula is:
[0039]
[0040] Where for And Φ 0 The correlation degree, Φ Si (n) is the sensor S i Described true failure growth trend, Φ 0 (n) is the fault growth trend after fitting, N is the number of discrete sampling points in the fault growth process, k is the delay amount, N 0 Is the maximum amount of delay.
Embodiment 3
[0042] A method for optimal deployment of sensors based on analysis of the correlation of failure growth trends. Different from Embodiment 1, this embodiment discloses that the sensor set S is initially deployed i ={S 1 , S 2 , S 3 ,..., S M }, select the described fault growth trend and the fitted fault growth trend Φ 0 The most relevant sensors are deployed, and the remaining sensors are used as redundant sensors to remove specific implementation methods.
[0043] According to formula (2), the fault growth trend after selection and fitting Φ 0 The sensor with the highest correlation is the optimal sensor to monitor the failure growth process, that is, the optimally deployed sensor
[0044]
[0045] Where Is the i-th sensor S i Described failure growth trend And the fault growth trend after fitting Φ 0 Relevance, for The maximum value in It is the sensor with the greatest correlation.
PUM
 Abstract
Description
Claims
Application Information
 - Generate Ideas
- Intellectual Property
- Life Sciences
- Materials
- Tech Scout
- Unparalleled Data Quality
- Higher Quality Content
- 60% Fewer Hallucinations
Browse by: Latest US Patents, China's latest patents, Technical Efficacy Thesaurus, Application Domain, Technology Topic, Popular Technical Reports.
© 2025 PatSnap. All rights reserved.Legal|Privacy policy|Modern Slavery Act Transparency Statement|Sitemap|About US| Contact US: help@patsnap.com