Hyperspectral band selection method based on local clustering ratio sorting

A band selection, hyperspectral technology, applied in the field of image processing, can solve the problems of not considering noise, lack of diversity of bands, lack of noise robustness, etc., to achieve the effect of improving performance and increasing robustness

Active Publication Date: 2017-12-08
XIDIAN UNIV
View PDF5 Cites 4 Cited by
  • Summary
  • Abstract
  • Description
  • Claims
  • Application Information

AI Technical Summary

Problems solved by technology

[0004] However, this method also has some shortcomings. For example, it does not take into account the influence of noise, and the difference in each dimension of the band is included in the similarity measure, which lacks noise robustness; at the same time, it is a static allocation level. method, after the hyperspectral data is given, the level of each band is determined and unchanged, and the selected bands lack diversity

Method used


Image

  • Hyperspectral band selection method based on local clustering ratio sorting
  • Hyperspectral band selection method based on local clustering ratio sorting
  • Hyperspectral band selection method based on local clustering ratio sorting

Examples


Embodiment 1

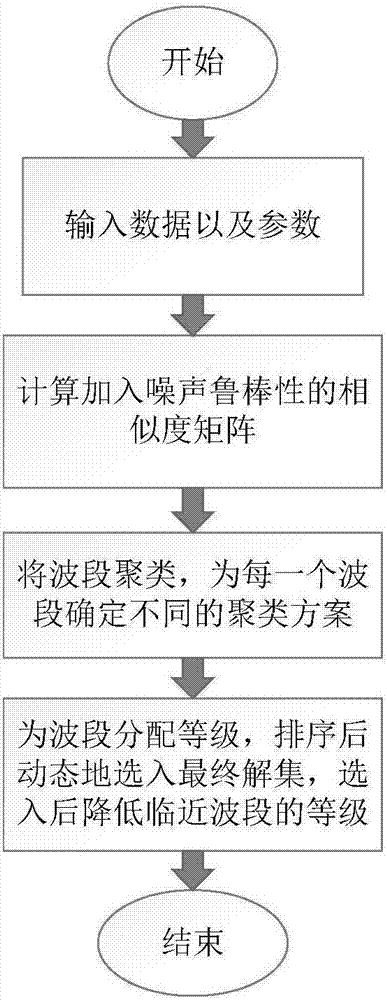
[0019] Existing hyperspectral image band selection methods have some shortcomings, for example, they do not take into account the error caused by noise in the band, rely too much on clustering methods, and do not dynamically adjust the selection strategy. In order to solve the above difficulties, the present invention proposes a hyperspectral band selection method based on local clustering ratio sorting, see figure 1 , including the following steps:

[0020] (1) Input data and parameters: input hyperspectral image raw data Ι∈R m×n×d , where m and n represent the length and width of the image respectively, and d represents the number of bands. Expand the hyperspectral image I into a two-dimensional matrix D={x 1 ,x 2 ,...,x d}, where x i Represents an mn-dimensional vector, that is, a band, 1≤i≤d; the input parameters are: the number of bands K to be selected, the similarity threshold parameter th1, and the clustering threshold parameter th2. These parameters are all arti...

Embodiment 2

[0028] The hyperspectral band selection method based on local clustering ratio sorting is the same as that in Embodiment 1, and specifically includes the following steps:

[0029] 2.1. According to the original hyperspectral image data expanded into a two-dimensional matrix D, determine a threshold diff for each pixel point i to determine whether the spectral value has changed i , splicing the thresholds of all bands into a vector diff according to the sequence of pixels in D:

[0030] diff i =th1×(max(D i )-min(D i ))

[0031] Among them, the similarity threshold parameter th1 is an artificially set parameter input in the first step, and is set to 0.01 for the two data sets (Indian Pines and Pavia University) in the experiment; max( ) and min( ) are respectively Indicates to take the maximum value and the minimum value of the parameter vector; D i Represents the i-th column in the hyperspectral image expanded into a two-dimensional matrix D, which means a vector composed...

Embodiment 3

[0038] The hyperspectral band selection method based on local clustering ratio sorting is the same as that of embodiment 1-2, the band clustering described in step 3, specifically including the following steps:

[0039] 3.1. Assign each band an independent maximum clusterable distance maxdis according to the clustering threshold parameter th2 i , in the experiment in this example, it is set to 0.17 for both data sets (Indian Pines and Pavia University), and it can also be set to a value around 0.2 based on experience:

[0040] maxdis i =sorted(S i,: ) th2×d

[0041] where sorted( ) index Indicates that after sorting the vector represented by · in ascending order, the index is the value at index, and S i,: Indicates the vector of the i-th row of the similarity matrix calculated in step 2. The physical meaning is the set of distances between the i-th band and all other bands. After sorting the sets of these distances in ascending order, take the index as th2× The number at...


PUM


Abstract

The invention discloses a hyperspectral band selection method based on local clustering ratio sorting. The problems that a hyperspectral band selection algorithm lacks noise robustness and the correlation of selected bands is strong are solved. The method comprises the specific steps that data, the expected selected number of bands and parameters are input; by considering the influence of noise, a similarity matrix which can reflect the real band information is calculated; band clustering is carried out; the ratio of the local and global information of the bands is calculated as the level; and the bands are dynamically added into a final solution set after descending sorting. A maximum clusterable distance is assigned to each band, which avoids incorrect clustering of some bands. When the bands are selected, the band level is the ratio of the local and global information. The strong correlation between adjacent bands is taken into account, and bands with redundant information are avoided. According to the invention, the calculated similarity matrix has certain robustness; the selected bands contain less redundant information; the classification performance is better; and the method is applied in the field of hyperspectral image processing.

Description

technical field [0001] The invention belongs to the technical field of image processing, and mainly relates to band selection of hyperspectral images, in particular to a hyperspectral band selection method based on local clustering ratio sorting. Band selection for hyperspectral images. Background technique [0002] Due to the high dimensionality of its features (spectral response values), hyperspectral images have great limitations in storage, transmission, analysis, etc. People naturally seek methods such as feature selection or feature extraction to reduce hyperspectral data. Hughes phenomenon brought about. Dimensionality reduction of hyperspectral images can be performed on the original spectral space, or converted to other spaces through linear and nonlinear changes. Band selection belongs to the former, which selects a subset of bands with obvious physical meaning, and its advantage is that it can better preserve the physical meaning of features. [0003] In the pa...

Claims


Application Information

Patent Timeline
Patent Type & Authority Applications(China)
IPC IPC(8): G06K9/62G01J3/28
CPCG01J3/2823G01J2003/2826G06F18/2323
Inventor 尚荣华兰雨阳焦李成刘芳马文萍王爽侯彪刘红英熊涛
Owner XIDIAN UNIV
Why Eureka
Try Eureka