Hyperspectral Band Selection Method Based on Local Cluster Scale Sorting
A band selection, hyperspectral technology, applied in the field of image processing, can solve the problems of not considering noise, lack of diversity of bands, lack of noise robustness, etc., to achieve the effect of increasing robustness and improving performance
- Summary
- Abstract
- Description
- Claims
- Application Information
AI Technical Summary
Problems solved by technology
Method used
Image
Examples
Embodiment 1
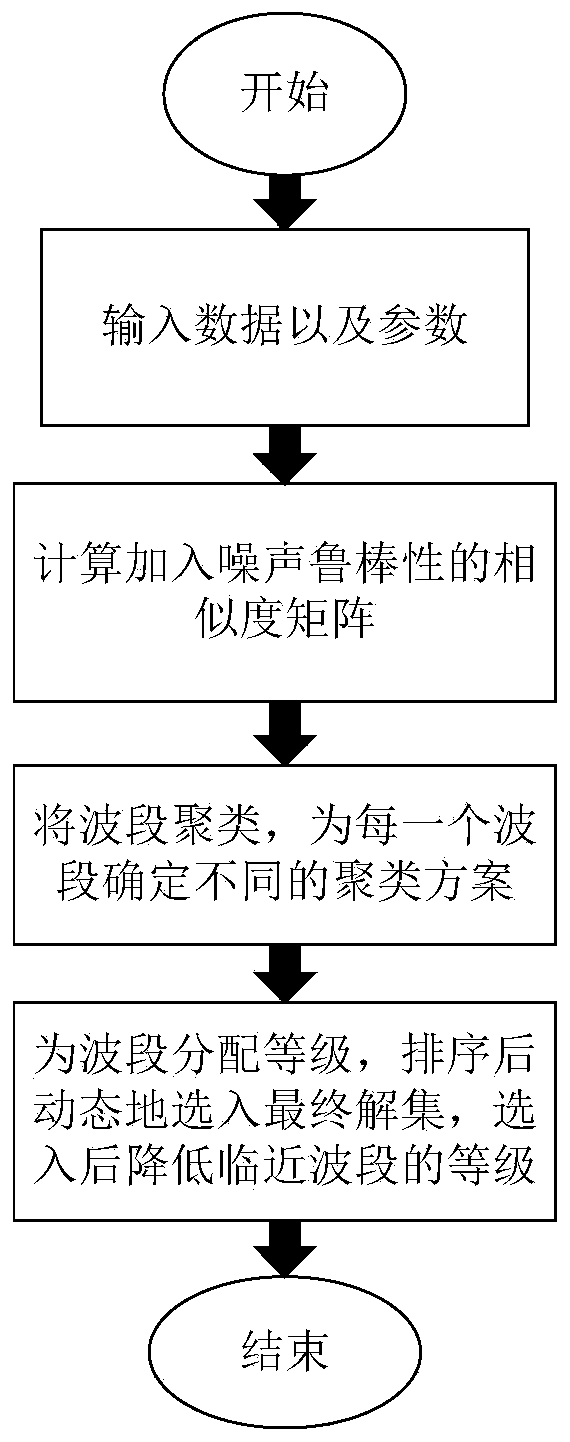
[0019] Existing hyperspectral image band selection methods have some shortcomings, for example, they do not take into account the error caused by noise in the band, rely too much on clustering methods, and do not dynamically adjust the selection strategy. In order to solve the above difficulties, the present invention proposes a hyperspectral band selection method based on local clustering ratio sorting, see figure 1 , including the following steps:
[0020] (1) Input data and parameters: input hyperspectral image raw data Ι∈R m×n×d , where m and n represent the length and width of the image respectively, and d represents the number of bands. Expand the hyperspectral image I into a two-dimensional matrix D={x 1 ,x 2 ,...,x d}, where x i Represents an mn-dimensional vector, that is, a band, 1≤i≤d; the input parameters are: the number of bands K to be selected, the similarity threshold parameter th1, and the clustering threshold parameter th2. These parameters are all arti...
Embodiment 2
[0028] The hyperspectral band selection method based on local clustering ratio sorting is the same as that in Embodiment 1, and specifically includes the following steps:
[0029] 2.1. According to the original hyperspectral image data expanded into a two-dimensional matrix D, determine a threshold diff for each pixel point i to determine whether the spectral value has changed i , splicing the thresholds of all bands into a vector diff according to the sequence of pixels in D:
[0030] diff i =th1×(max(D i )-min(D i ))
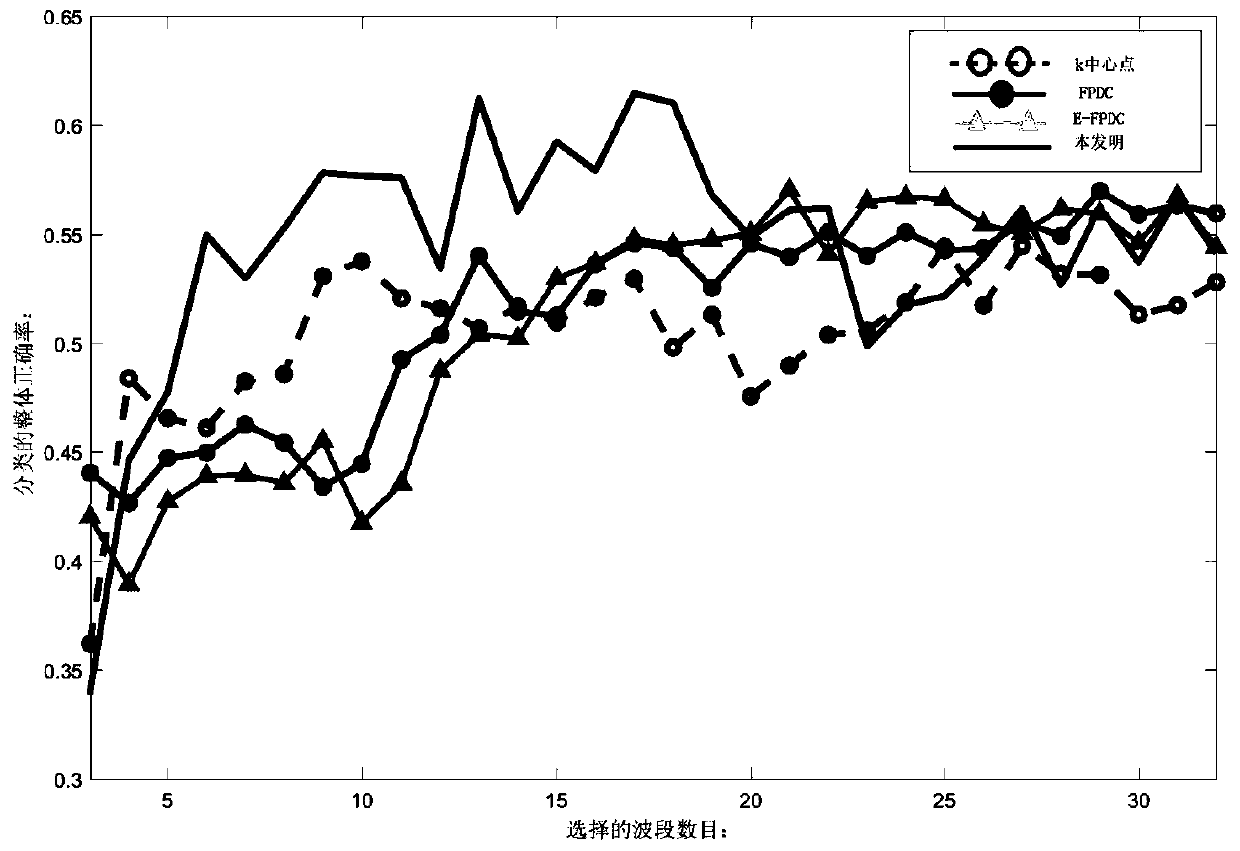
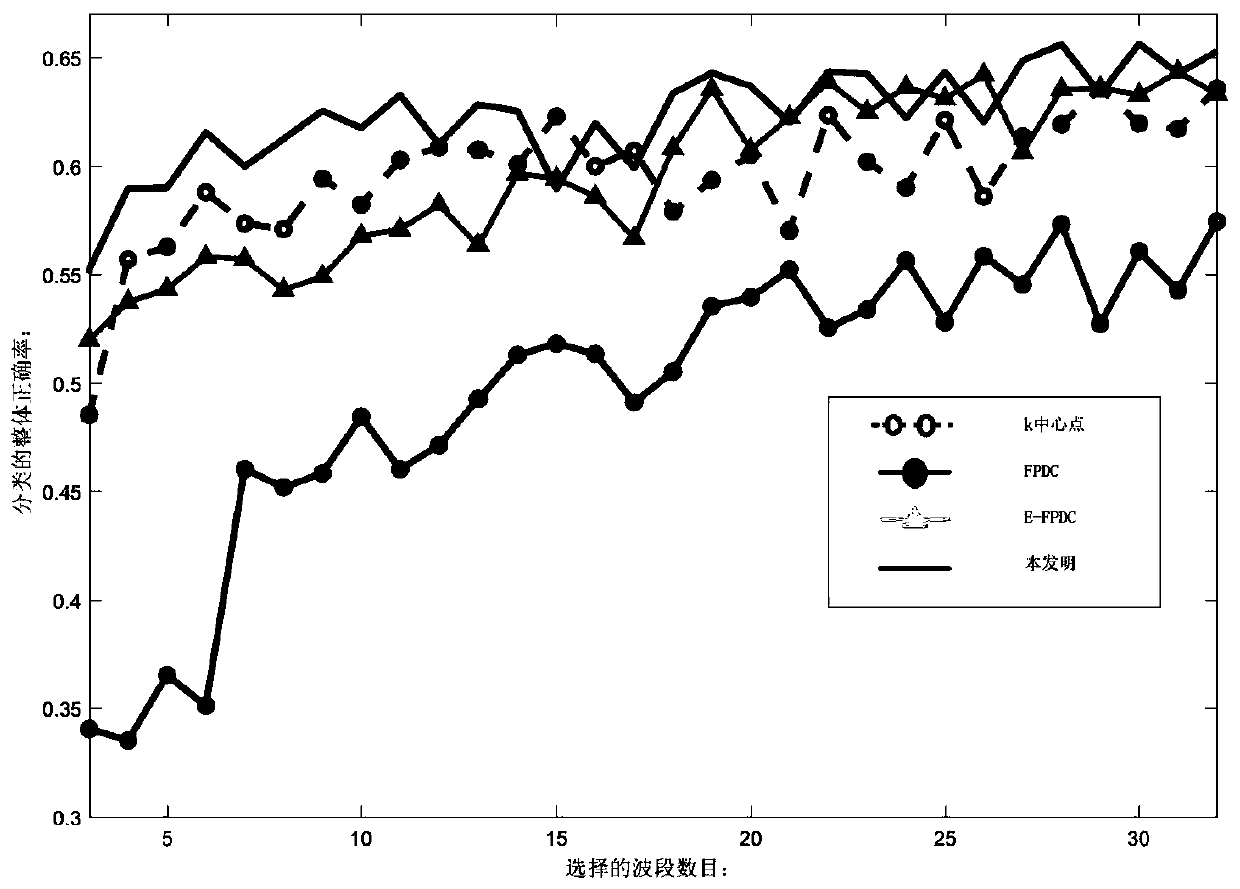
[0031] Among them, the similarity threshold parameter th1 is an artificially set parameter input in the first step, and is set to 0.01 for the two data sets (Indian Pines and Pavia University) in the experiment; max( ) and min( ) are respectively Indicates to take the maximum value and the minimum value of the parameter vector; D i Represents the i-th column in the hyperspectral image expanded into a two-dimensional matrix D, which means a vector composed...
Embodiment 3
[0038] The hyperspectral band selection method based on local clustering ratio sorting is the same as that of embodiment 1-2, the band clustering described in step 3, specifically including the following steps:
[0039] 3.1. Assign each band an independent maximum clusterable distance maxdis according to the clustering threshold parameter th2 i , in the experiment in this example, it is set to 0.17 for both data sets (Indian Pines and Pavia University), and it can also be set to a value around 0.2 based on experience:
[0040] maxdis i =sorted(S i,: ) th2×d
[0041] where sorted( ) index Indicates that after sorting the vector represented by · in ascending order, the index is the value at index, and S i,: Indicates the vector of the i-th row of the similarity matrix calculated in step 2. The physical meaning is the set of distances between the i-th band and all other bands. After sorting the sets of these distances in ascending order, take the index as th2× The number at...
PUM
 Abstract
Description
Claims
Application Information
 - R&D
- Intellectual Property
- Life Sciences
- Materials
- Tech Scout
- Unparalleled Data Quality
- Higher Quality Content
- 60% Fewer Hallucinations
Browse by: Latest US Patents, China's latest patents, Technical Efficacy Thesaurus, Application Domain, Technology Topic, Popular Technical Reports.
© 2025 PatSnap. All rights reserved.Legal|Privacy policy|Modern Slavery Act Transparency Statement|Sitemap|About US| Contact US: help@patsnap.com


