Power grid data processing and data visualization method based on cluster

A data processing and data technology, applied in the direction of digital data processing, text database browsing/visualization, special data processing applications, etc., can solve problems such as irregularities

Inactive Publication Date: 2018-04-24
EXAMING & EXPERIMENTAL CENT OF ULTRAHIGH VOLTAGE POWER TRANSMISSION COMPANY CHINA SOUTHEN POWER GRID
View PDF2 Cites 4 Cited by
  • Summary
  • Abstract
  • Description
  • Claims
  • Application Information

AI Technical Summary

Problems solved by technology

[0003] With the continuous development of informatization, data collection and storage technologies are becoming more and more mature. However, among the large amount of time-varying data generated by various business systems, many data often have other attribute dimensions, such as online monitoring data of power grid equipment. , including attributes such as online monitoring time and various monitoring items. Some of this kind of data change over time, some will show regularity or periodicity, and some will be irregular.

Method used


Image

  • Power grid data processing and data visualization method based on cluster
  • Power grid data processing and data visualization method based on cluster
  • Power grid data processing and data visualization method based on cluster

Examples


Embodiment

[0051] A cluster-based power grid data processing and data visualization method, the specific steps are as follows:

[0052] 1S. Collect raw data.

[0053] 2S. Clean the abnormal points and null values ​​existing in the original data; for the abnormal points, use filtering or correction methods to adjust the abnormal values ​​to the maximum or minimum boundary value; for the null values, use the average value to fill the gap of the null values Method.

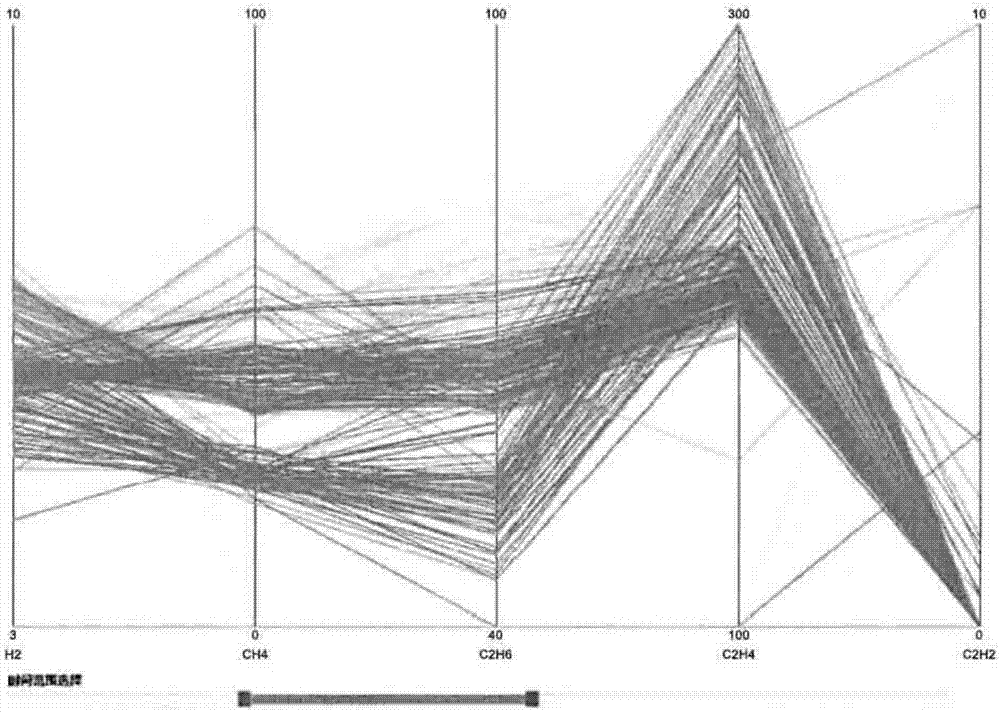
[0054] 3S. Parallel coordinate visual drawing is performed on the data passing step 2, figure 1 A parallel coordinate plot with a time axis is shown. Below the graph is the time axis with interactive functions. By dragging the start and end points on the time axis, you can select data within a certain time range to view, and the parallel coordinate graph will also change accordingly. The unselected data corresponds to The polyline at will fade. For the polyline in the parallel coordinate graph, the position of the attribute...


PUM


Abstract

The invention discloses a power grid data processing and data visualization method based on a cluster. The method comprises the specific steps as follows: 1S, collecting original data; 2S, cleaning anabnormal point and a null value existent in the original data; for the abnormal point, adjusting an abnormal value as a maximum or minimum boundary value by using a filtering or collecting method; for the null value, adopting a method for filling the null value by using the average value. The method disclosed by the invention has the following advantages: at first, the expression of the key feature is enhanced and the expression of the unrelated details is inhibited by using a clustering method; secondly, the data is abstracted and reconstructed by using a data analysis system, the implicit features of a complex multi-dimension time series data set are described to generate a compact overview image, the index and the searching are facilitated, and then a user is allowed to add other details in the interaction analysis process; thirdly, the conflict between the limited visual space and the data overload is relieved by using the interaction technology, and the user can well participatethe understanding and analysis on the data.

Description

technical field [0001] The invention relates to the technical field of power transmission and transformation between clouds in electric power systems, in particular to a cluster-based power grid data processing and data visualization method. Background technique [0002] Under the unified planning and guidance of China Southern Power Grid Co., Ltd., China Southern Power Grid EHV Transmission Company has successively built multiple sets of information systems such as "6+1" system, EMS, OMS, equipment status monitoring system, lightning positioning system, and meteorological information system. Each system strongly supports the company's safety production and operation management from different business perspectives. [0003] With the continuous development of informatization, data collection and storage technologies are becoming more and more mature. However, among the large amount of time-varying data generated by various business systems, many data often have other attribut...

Claims


Application Information

Patent Timeline
Patent Type & Authority Applications(China)
IPC IPC(8): G06F17/30
CPCG06F16/34G06F16/35
Inventor 王奇张晗宋云海李妍红蔡延雷苏浩辉周震震
Owner EXAMING & EXPERIMENTAL CENT OF ULTRAHIGH VOLTAGE POWER TRANSMISSION COMPANY CHINA SOUTHEN POWER GRID
Why Eureka
Try Eureka