Multi-dimensional data visualization method and device based on radial coordinate optimization

A technology of multi-dimensional data and coordinates, applied in multi-dimensional databases, structured data retrieval, database models, etc., can solve dot occlusion and overlap, prevent users from obtaining more meaningful information, and have a great influence on the arrangement order effect diagram, etc. problem, to achieve the effect of optimal processing

Active Publication Date: 2018-05-11
XIDIAN UNIV
View PDF8 Cites 4 Cited by
  • Summary
  • Abstract
  • Description
  • Claims
  • Application Information

AI Technical Summary

Problems solved by technology

The main disadvantages of this method are that there is room for improvement in the density, confusion and coverage of data visualization, and the membership matrix prevents users from obtaining more meaningful information.
[0006] The existing radial coordinate visualization method directly maps all data points to two-dimensional space, which will cause occlusion and coincidence between the circle points: although the data dimension points correspond to the circle, the arrangement order on the circle is not the same as the last The rendering effect of the effect is also great

Method used


Image

  • Multi-dimensional data visualization method and device based on radial coordinate optimization
  • Multi-dimensional data visualization method and device based on radial coordinate optimization
  • Multi-dimensional data visualization method and device based on radial coordinate optimization

Examples


Embodiment 1

[0059] The radial coordinate visualization method is a multidimensional data visualization technique. It reduces the dimensionality of multi-dimensional data and displays it in a low-dimensional space, and clusters and analyzes similar data points through certain features.

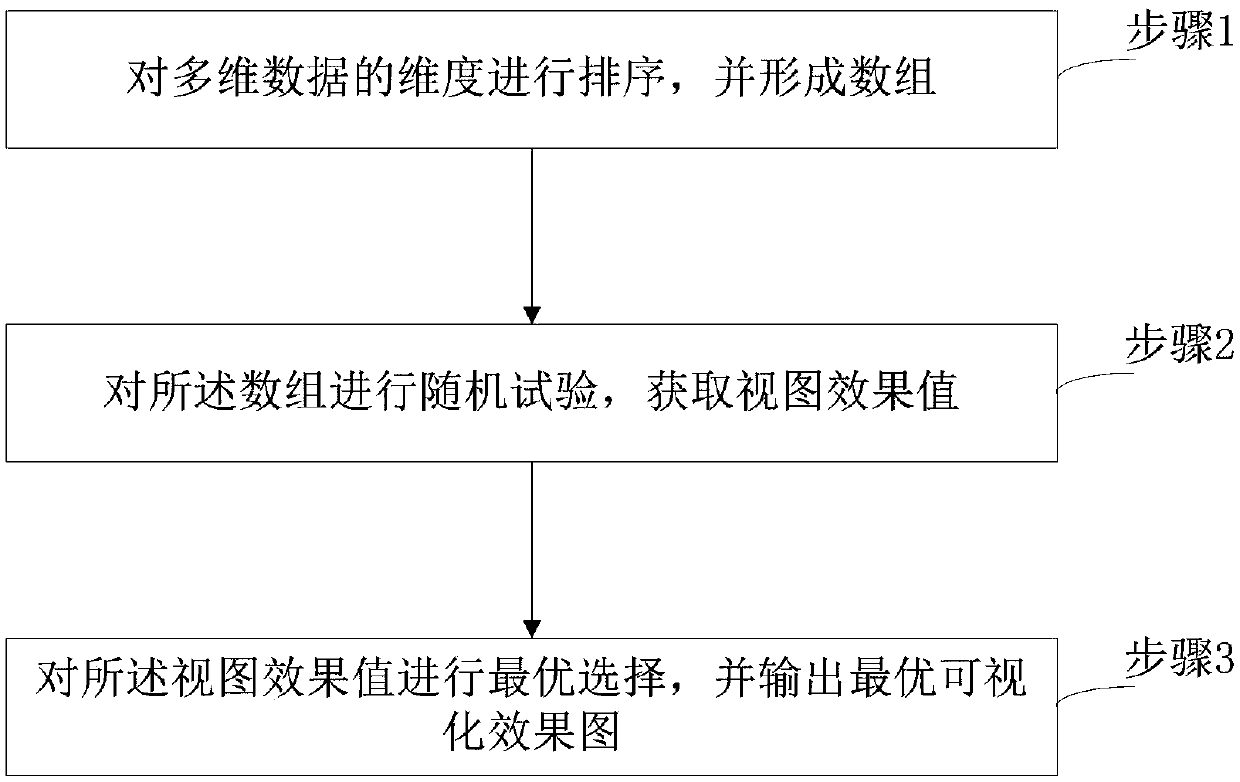
[0060] See figure 1 , figure 1 It is a flow chart of the visualization method provided by the embodiment of the present invention. An embodiment of the present invention provides a multi-dimensional data visualization method based on radial coordinate optimization, including the following steps:

[0061] Step 1. Sort the dimensions of the multidimensional data and form an array;

[0062] Specifically, the dimensions of the multidimensional data are numbered from 1 to M;

[0063]The data of each dimension includes a data feature, and an array containing M data features is obtained, where M is an integer greater than 1.

[0064] Specifically, sort the dimensions of the original Radviz Implementation and...


PUM


Abstract

The invention relates to a multi-dimensional data visualization method based on radial coordinate optimization. The method includes the steps of firstly, sequencing dimensions of multi-dimensional data to form arrays; secondly, randomly testing the arrays to obtain view effect values; thirdly, selecting the optimum view effect value, and outputting the optimum visualization effect view. By improving the three indexes including data density, data chaos and data coverage of the visualization effect and calculating and selecting the minimum view effect value, the optimum visualization effect viewis obtained and output, and the optimization treatment of an original algorithm is achieved. The embodiment of the invention further provides a multi-dimensional data visualization device based on radial coordinate optimization.

Description

technical field [0001] The invention belongs to the technical field of computer information processing, and relates to a multi-dimensional data visualization method and device based on radial coordinate optimization. Background technique [0002] Visualization is also called visual thinking or visual thinking. As the name implies, it allows people to understand the information conveyed by data more intuitively. Visualization technology is a technology that applies visualization concepts to computers, and processes various data in computers into charts or graphics that can be intuitively understood through certain operations. It is the most effective means to explain data information. Data visualization, the basic idea is to use each data item in the database as an item in the graph, so that a large number of data sets form a data image, and at the same time express each attribute value of the data in the form of multi-dimensional data, so that we can learn from different pla...

Claims


Application Information

Patent Timeline
Patent Type & Authority Applications(China)
IPC IPC(8): G06F17/30
CPCG06F16/248G06F16/283
Inventor 李瑞杜军朝刘惠蒋志平何琛陶世雯
Owner XIDIAN UNIV
Why Eureka
Try Eureka