3D map scatter data display method and system as well as information data processing terminal

A point data and map technology, applied in the field of information data processing terminals

Active Publication Date: 2018-06-29
GLOBAL TONE COMM TECH
View PDF5 Cites 6 Cited by
  • Summary
  • Abstract
  • Description
  • Claims
  • Application Information

AI Technical Summary

Problems solved by technology

The present invention can create various three-dimensional scenes

Method used


Image

  • 3D map scatter data display method and system as well as information data processing terminal
  • 3D map scatter data display method and system as well as information data processing terminal
  • 3D map scatter data display method and system as well as information data processing terminal

Examples


Embodiment Construction

[0050] In order to make the object, technical solution and advantages of the present invention more clear, the present invention will be further described in detail below in conjunction with the examples. It should be understood that the specific embodiments described here are only used to explain the present invention, not to limit the present invention.

[0051] The present invention resolves the strong correlation between most data and displays them as independent objects. When analyzing the correlation coefficient of two of the variables, the obtained results cannot truly reflect the correlation between the variables. Users can intuitively observe the changes in data and data intensity, and obtain the real relationship between the two things, which improves the data quality. The high latency and low interaction rate performance caused by queries has revolutionized data visualization and fully demonstrated the charm of data visualization.

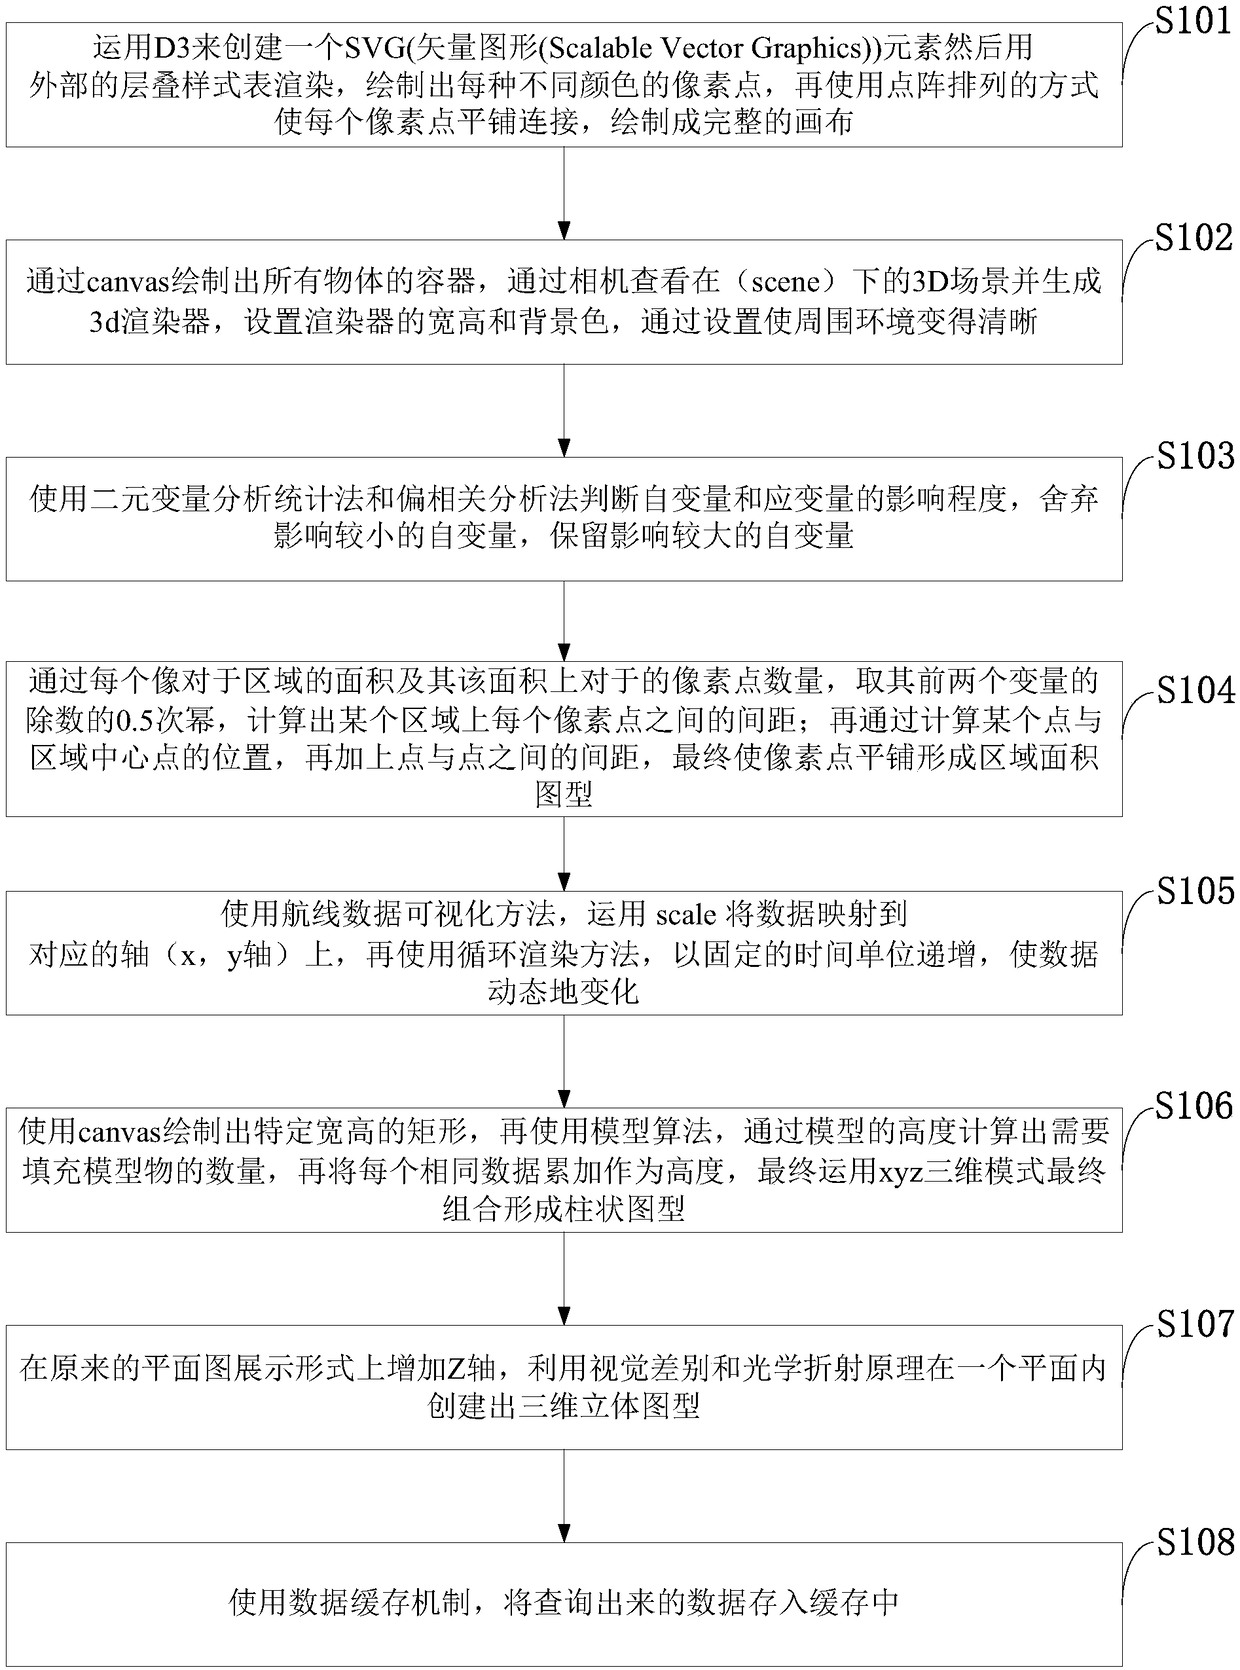
[0052] like figure 1 As shown,...


PUM


Abstract

The invention belongs to the technical field of computer software and discloses a 3D map scatter data display method and system as well as an information data processing terminal. A 3D stereoscopic graph is created in a plane in a 2D graphic mode and a 3D space mode by use of visual difference and optical diffraction; an object is made to be rendered to a webpage, and the object is enabled to looksmall in the distance and big on the contrary in a 3D projection manner; in the photographing principles, an included angle in the view point of a camera is set, so that the displayed object moves relatively; the influence degree of independent variables and dependent variables is judged with a binary variable analysis and statistic method and a partial correlation analysis method, and the independent variable with higher influence is reserved; data are mapped to a corresponding axis by use of scale with an airline data visualization method, progressive increase is performed at a regular timeunit with a circular rendering method, so that data dynamically change. Three 3D scenes can be created, and the cool 3D effect is sufficiently shown.

Description

technical field [0001] The invention belongs to the technical field of computer software, and in particular relates to a method and system for displaying 3D map scattered point data, and an information data processing terminal. Background technique [0002] At present, the existing technologies commonly used in the industry are as follows: With the advent of the era of big data, data visualization has attracted increasing attention. Most of the existing data visualization data has a strong correlation and cannot be separated and displayed as independent objects. It can only be displayed in a flat graphic, and cannot show the correlation and contrast between things in a three-dimensional, intuitive, and multi-angle manner. When analyzing a large amount of relevant data, the existing technology uses a single independent variable to explain the variation of the dependent variable, but in the present invention, multiple independent variables are used to analyze the variation of...

Claims


Application Information

Patent Timeline
Patent Type & Authority Applications(China)
IPC IPC(8): G06T15/00G06T17/05
CPCG06T15/00G06T17/05
Inventor 马长征程国艮隗公程杜占鹏
Owner GLOBAL TONE COMM TECH
Why Eureka
Try Eureka